Low Voltage Motor Control Centers Market by Type (Intelligent and Conventional), End-User (Industrial and Commercial), Component (Busbars, Circuit Breakers and Fuses, Overload Relays, VSDS, and Soft Starters), and Region - Global Forecast to 2022


[172 Pages Report] The global low voltage motor control centers market was valued at USD 2.91 Billion in 2016 and is estimated to grow at a CAGR of 5.62% during the forecast period. The increased use of low voltage electric motors in key industries, rising industrial automation, and increased industrial plant uptime are the major factors driving the low voltage motor control centers market.
The years considered for the study are as follows:
- Base Year: 2016
- Estimated Year: 2017
- Projected Year: 2022
- Forecast Period: 2017�2022
The base year for company profiles is 2016. Whenever information was unavailable for the base year, the prior year has been considered.
Objectives of the Study
- To define, describe, and forecast the global market on the basis of type, component, end-user, and region
- To provide detailed information regarding the major factors influencing the growth of this market (drivers, restraints, opportunities, and industry-specific challenges)
- To strategically analyze the market of low voltage motor control centers with respect to individual growth trends, future prospects, and contributions of each segment to the market
- To analyze market opportunities for stakeholders and provide details of the competitive landscape for market leaders
- To strategically profile key players and comprehensively analyze their market shares and core competencies
- To track and analyze competitive developments such as contracts & agreements, expansions, new product developments, and mergers & acquisitions in the this market
Research Methodology
This research study involved the use of extensive secondary sources, directories, and databases such as Hoover�s, Bloomberg Businessweek, Factiva, and OneSource to identify and collect information useful for a technical, market-oriented, and commercial study of the global market. The primary sources include industry experts from core and related industries, preferred suppliers, manufacturers, distributors, technology developers, standards and certification organizations of companies, and organizations related to all the segments of this industry�s value chain. The points given below explain the research methodology.
- Study of annual revenue and market developments of major players that provide low voltage motor control centers
- Analyses of major end-use industries and applications of low voltage motor control centers
- Assessment of future trends and growth of this market on the basis of investments in motors in the control and automation industry
- Assessment of the market with respect to conventional and intelligent low voltage motor control centers based on type
- Study of the contracts and developments related to the this market by key players across different regions
- Finalization of overall market sizes by triangulating the supply-side data, which includes product developments, supply chains, and annual revenues of companies manufacturing low voltage motor control centers across the globe
After arriving at the overall market size, the total market has been split into several segments and subsegments. The figure given below illustrates the breakdown of primaries conducted during the research study on the basis of company type, designation, and region.
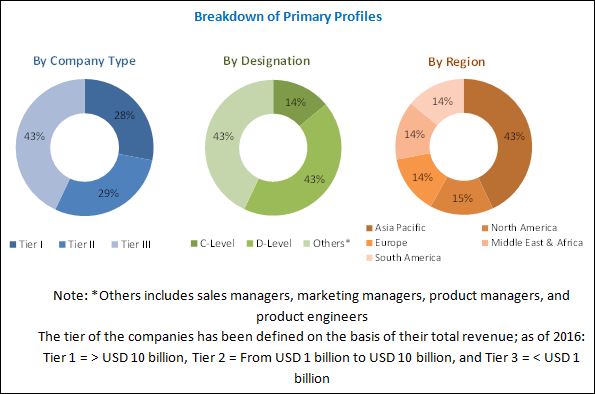
To know about the assumptions considered for the study, download the pdf brochure
Market Ecosystem:
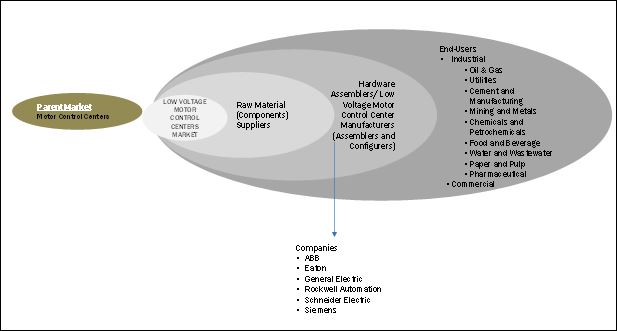
The ecosystem of the global low voltage motor control centers market starts with raw material or component suppliers who provide iron, copper, alloy, and insulation materials. The various components of low voltage motor control centers are busbars, overload relays, circuit breakers & fuses, variable speed drives, soft starters, disconnector switches, pushbuttons, wires, and cabinet sections, among others. The next stage is the manufacturing of low voltage motor control centers where all the components are assembled. After the final assembly, the low voltage motor control centers are tested. These devices are then distributed to industrial and commercial end-users. The industrial end-users are oil & gas, utilities, cement and manufacturing, metals and mining, chemicals and petrochemicals, food and beverage, water and wastewater, pulp and paper, and pharmaceutical industries.
Target Audience:
The report�s target audience includes:
- Low voltage motor control centers manufacturers, distributors, and suppliers
- Consulting companies in the energy and power sector
- Environmental research institutes
- Process industries and power and energy associations
- State and national regulatory authorities
- Energy efficiency consultancies
- Institutional investors and shareholders
- Government and research organizations
Scope of the Report:
- By Type
- Conventional Motor Control Centers
- Intelligent Motor Control Centers
- By Component
- Busbars
- Circuit Breakers & Fuses
- Overload Relays
- Variable Speed Drives
- Soft Starters
- Others
- By End-User
- Industrial
- Oil & Gas
- Mining and Metals
- Utilities
- Chemicals and Petrochemicals
- Cement and Manufacturing
- Food and Beverage
- Others
- Commercial
- Industrial
- By Region
- Asia-Pacific
- North America
- Europe
- South America
- Middle East & Africa
Available Customizations:
With the given market data, MarketsandMarkets offers customizations as per the client�s specific needs. The following customization options are available for this report:
Regional Analysis
Further breakdown of region or country-specific analyses
Company Information
Detailed analyses and profiling of additional market players (up to five)
The global low voltage motor control centers market is projected to grow at a CAGR of 5.62% from 2017 to 2022, to reach a market size of USD 4.03 Billion by 2022. The market growth can be attributed to increasing industrial automation and booming power sector globally. The increased use of low voltage electric motors in key industries and increased industrial plant uptime are expected to boost the demand for low voltage motor control centers.
The report segments the low voltage motor control centers market, by type, into conventional motor control centers and intelligent motor control centers. The conventional motor control centers segment is expected to lead the market for low voltage motor control centers in 2017. The intelligent motor control centers segment is projected to grow at the fastest rate during the forecast period due to increasing levels of industrial automation in end-user industries globally.
The busbars segment of the low voltage motor control centers market, by component, accounted for the largest market size in 2016. Busbars are the major current carrying components of low voltage motor control centers. These are used in utilities to deliver power to buildings and, in industrial applications, to deliver power to electrical loads. Also, the busbars alternative to traditional cabling provides numerous advantages to the installer and client, including savings on space, time, and cost. All these factors are expected to drive the busbars segment of low voltage motor control centers market.
The report segments the low voltage motor control centers market, by end-user, into industrial and commercial. The industrial segment includes the oil & gas, water and wastewater, power generation, mining, and others subsegments, the last of which includes the cement, chemicals and petrochemicals, and paper and pulp industries. The oil & gas segment accounted for the largest market share in 2016 as low voltage motor control centers are extensively used to control low voltage motors for drilling and various others production processes in the oil & gas sector. The utilities segment is expected to grow at the highest CAGR from 2017 to 2022, due to the increasing power generation capacity additions globally.
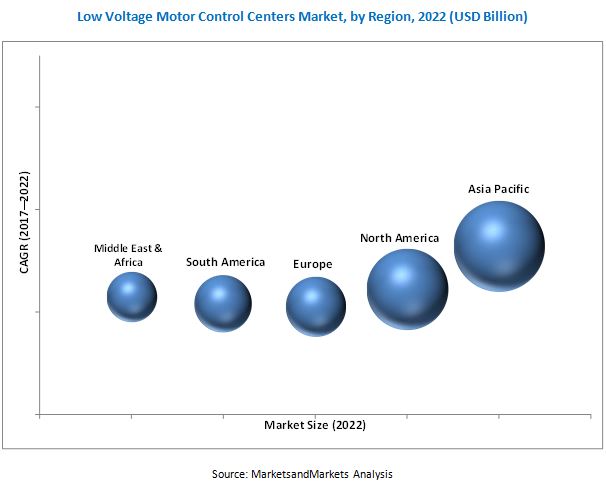
In this report, the low motor control centers market has been analyzed with respect to five regions, namely, Asia-Pacific, North America, Europe, South America, and the Middle East & Africa. The market in Asia-Pacific is expected to lead the global low voltage motor control centers market by 2022 and is projected to grow at the highest CAGR from 2017 to 2022. The market growth in this region can be attributed to rising industrialization and urbanization and increasing electricity demand. Countries such as China, India, Japan, and Australia are the key markets for low voltage motor control centers in the Asia Pacific region. The increasing investments in the water and wastewater industry and increasing infrastructural developments in the Middle East & Africa are expected to drive the low voltage motor control centers market in the Middle East & Africa.
The oil & gas industry is one of the leading end-user industries for low voltage motor control centers. The oil & gas industry requires all types of motor control centers to provide sufficient protection from voltage, speed, and frequency surges to run business operations smoothly and without any interruption. The recent downturn in crude oil prices has resulted in a steep fall in capital budgets, which has reduced the demand for industrial equipment. The stagnancy in the oil & gas industry is expected to act as a restraint for the low voltage motor control centers market.
The leading players in the low voltage motor control centers market include ABB (Switzerland), Schneider Electric (France), Eaton (Ireland), Siemens (Germany), Rockwell Automation (U.S.), and General Electric (U.S.), among others. New product developments was the most commonly adopted strategy by top players in the market from 2013 to 2017. It was followed by contracts & agreements, expansions & investments, mergers & acquisitions, and others (includes certifications, collaborations, partnerships, and joint ventures).
To speak to our analyst for a discussion on the above findings, click Speak to Analyst
 Exclusive indicates content/data unique to MarketsandMarkets and not available with any competitors.
Table of Contents
1 Introduction (Page No. - 15)
1.1 Objectives of the Study
1.2 Market Definition
1.3 Market Scope
1.3.1 Markets Covered
1.3.2 Regional Scope
1.3.3 Years Considered for the Study
1.4 Currency
1.5 Limitations
1.6 Stakeholders
2 Research Methodology (Page No. - 19)
2.1 Research Data
2.1.1 Secondary Data
2.1.1.1 Key Data From Secondary Sources
2.1.2 Primary Data
2.1.2.1 Key Data From Primary Sources
2.1.2.2 Key Industry Insights
2.1.2.3 Breakdown of Primaries
2.2 Market Size Estimation
2.2.1 Bottom-Up Approach
2.2.2 Top-Down Approach
2.3 Market Breakdown & Data Triangulation
2.4 Research Assumptions
3 Executive Summary (Page No. - 27)
4 Premium Insights (Page No. - 32)
4.1 Low Voltage Motor Control Centers Market, By Region
4.2 Low Voltage Motor Control Centers Market, By Type
4.3 Low Volatge Motor Control Centers Market, By Component
4.4 Low Voltage Motor Control Centers Market, By End-User
4.5 Asia Pacific Low Voltage Motor Control Centers Market
5 Market Overview (Page No. - 36)
5.1 Introduction
5.2 Market Dynamics
5.2.1 Drivers
5.2.1.1 Growing Demand for Industrial Automation in Developed Regions
5.2.1.2 Increased Use of Low Voltage Electric Motors in Key Industries
5.2.1.3 Increased Industrial Plant Uptime
5.2.1.4 Booming Power Sector & Augmented Power Generation Capacities Globally
5.2.2 Restraints
5.2.2.1 Stagnant Growth in the Oil & Gas Industry
5.2.2.2 Decrease in Mining Activities in Asia Pacific, Latin America, & Africa
5.2.3 Opportunities
5.2.3.1 Increasing Urbanization & Industrialization
5.2.3.2 Upgradation of Industrial Infrastructure in Developed Countries
5.2.3.3 Regulations Promoting Energy Savings Across Major Industries
5.2.4 Challenges
5.2.4.1 High Level of Complexity Involved in the Maintenance of Low Voltage Motor Control Centers
6 Industry Trends (Page No. - 44)
6.1 Supply Chain Analysis
6.1.1 Raw Material/Component Suppliers
6.1.2 Manufacturers & Assemblers
6.1.3 Distributors
6.1.4 End-Users
6.2 Porter�s Five Forces Analysis
6.2.1 Bargaining Power of Suppliers
6.2.2 Threat of New Entrants
6.2.3 Threat of Substitutes
6.2.4 Bargaining Power of Buyers
6.2.5 Intensity of Competitive Rivalry
7 Low Voltage Motor Control Centers Market, By Type (Page No. - 50)
7.1 Introduction
7.2 Conventional Motor Control Centers
7.3 Intelligent Motor Control Centers
8 Low Voltage Motor Control Centers Market, By Component (Page No. - 54)
8.1 Introduction
8.2 Busbars
8.3 Circuit Breakers & Fuses
8.4 Overload Relays
8.5 Variable Speed Drives
8.6 Soft Starters
8.7 Others
9 Low Voltage Motor Control Centers Market, By End-User (Page No. - 62)
9.1 Introduction
9.2 Industrial
9.2.1 Oil & Gas
9.2.2 Mining & Metals
9.2.3 Utilities
9.2.4 Chemicals & Petrochemicals
9.2.5 Cement & Manufacturing
9.2.6 Food & Beverage
9.2.7 Others
9.3 Commercial
10 Low Voltage Motor Control Centers Market, By Region (Page No. - 72)
10.1 Introduction
10.2 Asia Pacific
10.2.1 China
10.2.2 India
10.2.3 Japan
10.2.4 Australia
10.2.5 The Rest of Asia Pacific
10.3 North America
10.3.1 The US
10.3.2 Canada
10.3.3 Mexico
10.4 Europe
10.4.1 Germany
10.4.2 France
10.4.3 Italy
10.4.4 The UK
10.4.5 Spain
10.4.6 The Rest of Europe
10.5 South America
10.5.1 Brazil
10.5.2 Argentina
10.5.3 Venezuela
10.5.4 The Rest of South America
10.6 Middle East & Africa
10.6.1 Saudi Arabia
10.6.2 The UAE
10.6.3 Algeria
10.6.4 Kuwait
10.6.5 South Africa
10.6.6 The Rest of the Middle East & Africa
11 Competitive Landscape (Page No. - 126)
11.1 Overview
11.2 Market Share Analysis, 2016
11.3 Competitive Situation & Trends
12 Company Profiles (Page No. - 130)
12.1 ABB Ltd.
12.1.1 Overview
12.1.2 Product Offering
12.1.3 Business Strategy
12.1.4 Recent Developments
12.2 Eaton Corporation PLC
12.2.1 Overview
12.2.2 Product Offering
12.2.3 Business Strategy
12.2.4 Recent Developments
12.3 Siemens AG
12.3.1 Overview
12.3.2 Product Offering
12.3.3 Business Strategy
12.3.4 Recent Developments
12.4 General Electric Company
12.4.1 Overview
12.4.2 Product Offering
12.4.3 Business Strategy
12.4.4 Recent Developments
12.5 Schneider Electric SE
12.5.1 Overview
12.5.2 Product Offering
12.5.3 Business Strategy
12.5.4 Recent Developments
12.6 Rockwell Automation, Inc.
12.6.1 Overview
12.6.2 Product Offering
12.6.3 Business Strategy
12.6.4 Recent Developments
12.7 Mitsubishi Electric Corporation
12.7.1 Business Overview
12.7.2 Product Offering
12.7.3 Business Strategy
12.7.4 Recent Developments
12.8 Technical Control Systems, Ltd.
12.8.1 Overview
12.8.2 Product Offering
12.8.3 Business Strategy
12.8.4 Recent Developments
12.9 WEG SA
12.9.1 Overview
12.9.2 Product Offering
12.9.3 Business Strategy
12.9.4 Recent Developments
12.10 Lsis Co., Ltd.
12.10.1 Overview
12.10.2 Product Offering
12.10.3 Business Strategy
12.11 Larsen & Toubro Limited
12.11.1 Overview
12.11.2 Product Offering
12.11.3 Business Strategy
12.11.4 Recent Developments
12.12 Fuji Electric Co., Ltd.
12.12.1 Overview
12.12.2 Product Offering
12.12.3 Business Strategy
12.12.4 Recent Developments
12.13 Tesco Controls, Inc.
12.13.1 Overview
12.13.2 Product Offering
12.13.3 Business Strategy
12.13.4 Recent Developments
13 Appendix (Page No. - 163)
13.1 Insights of Industry Experts
13.2 Discussion Guide
13.3 Knowledge Store: Marketsandmarkets� Subscription Portal
13.4 Introducing RT: Real-Time Market Intelligence
13.5 Available Customizations
13.6 Related Reports
13.7 Author Details
List of Tables (95 Tables)
Table 1 Low Voltage Motor Control Centers Market Snapshot
Table 2 Low Voltage Motor Control Centers Market Size, By Type, 2015�2022 (USD Million)
Table 3 Conventional: Market Size, By Region, 2015�2022 (USD Million)
Table 4 Intelligent: Market Size, By Region, 2015�2022 (USD Million)
Table 5 Low Voltage Motor Control Centers Market Size, By Component, 2015�2022 (USD Million)
Table 6 Busbars: Market Size, By Region, 2015�2022 (USD Million)
Table 7 Circuit Breakers & Fuses: Market Size, By Region, 2015�2022 (USD Million)
Table 8 Overload Relays: Market Size, By Region, 2015�2022 (USD Million)
Table 9 Variable Speed Drives: Market Size, By Region, 2015�2022 (USD Million)
Table 10 Soft Starters: Market Size, By Region, 2015�2022 (USD Million)
Table 11 Others: Market Size, By Region, 2015�2022 (USD Million)
Table 12 Low Voltage Motor Control Centers Market Size, By End-User, 2015�2022 (USD Million)
Table 13 Industrial: Market Size, By Region, 2015�2022 (USD Million)
Table 14 Industrial: Market Size, By End-User, 2015�2022 (USD Million)
Table 15 Oil & Gas: Market Size, By Region, 2015�2022 (USD Million)
Table 16 Mining & Metals: Market Size, By Region, 2015�2022 (USD Million)
Table 17 Utilities: Market Size, By Region, 2015�2022 (USD Million)
Table 18 Chemicals & Petrochemicals: Market Size, By Region, 2015�2022 (USD Million)
Table 19 Cement & Manufacturing: Market Size, By Region, 2015�2022 (USD Million)
Table 20 Food & Beverage: Market Size, By Region, 2015�2022 (USD Million)
Table 21 Others: Market Size, By Region, 2015�2022 (USD Million)
Table 22 Commercial: Market Size, By Region, 2015�2022 (USD Million)
Table 23 Low Voltage Motor Control Centers Market Size, By Region, 2015�2022 (USD Million)
Table 24 Asia Pacific: Market Size, By Country, 2015�2022 (USD Million)
Table 25 Asia Pacific: Market Size, By Type, 2015�2022 (USD Million)
Table 26 Asia Pacific: Market Size, By Component, 2015�2022 (USD Million)
Table 27 Asia Pacific: Market Size, By End-User, 2015�2022 (USD Million)
Table 28 Asia Pacific: Market Size, By Industrial End-User, 2015�2022 (USD Million)
Table 29 China: Market Size, By End-User, 2015�2022 (USD Million)
Table 30 China: Market Size, By Industrial End-User, 2015�2022 (USD Million)
Table 31 India: Market Size, By End-User, 2015�2022 (USD Million)
Table 32 India: Market Size, By Industrial End-User, 2015�2022 (USD Million)
Table 33 Japan: Market Size, By End-User, 2015�2022 (USD Million)
Table 34 Japan: Market Size, By Industrial End-User, 2015�2022 (USD Million)
Table 35 Australia: Market Size, By End-User, 2015�2022 (USD Million)
Table 36 Australia: Market Size, By Industrial End-User, 2015�2022 (USD Million)
Table 37 The Rest of Asia Pacific: Market Size, By End-User, 2015�2022 (USD Million)
Table 38 The Rest of Asia Pacific: Market Size, By Industrial End-User, 2015�2022 (USD Million)
Table 39 North America: Market Size, By Country, 2015�2022 (USD Million)
Table 40 North America: Market Size, By Type, 2015�2022 (USD Million)
Table 41 North America: Market Size, By Component, 2015�2022 (USD Million)
Table 42 North America: Market Size, By End-User, 2015�2022 (USD Million)
Table 43 North America: Market Size, By Industrial End-User, 2015�2022 (USD Million)
Table 44 The US: Market Size, By End-User, 2015�2022 (USD Million)
Table 45 The US: Market Size, By Industrial End-User, 2015�2022 (USD Million)
Table 46 Canada: Market Size, By End-User, 2015�2022 (USD Million)
Table 47 Canada: Market Size, By Industrial End-User, 2015�2022 (USD Million)
Table 48 Mexico: Market Size, By End-User, 2015�2022 (USD Million)
Table 49 Europe: Market Size, By Country, 2015�2022 (USD Million)
Table 50 Europe: Market Size, By Type, 2015�2022 (USD Million)
Table 51 Europe: Market Size, By Component, 2015�2022 (USD Million)
Table 52 Europe: Market Size, By End-User, 2015�2022 (USD Million)
Table 53 Europe: Market Size, By Industrial End-User, 2015�2022 (USD Million)
Table 54 Germany: Market Size, By End-User, 2015�2022 (USD Million)
Table 55 Germany: Market Size, By Industrial End-User, 2015�2022 (USD Million)
Table 56 France: Market Size, By End-User, 2015�2022 (USD Million)
Table 57 France: Market Size, By Industrial End-User, 2015�2022 (USD Million)
Table 58 Italy: Market Size, By End-User, 2015�2022 (USD Million)
Table 59 Italy: Market Size, By Industrial End-User, 2015�2022 (USD Million)
Table 60 The UK: Market Size, By End-User, 2015�2022 (USD Million)
Table 61 The UK: Market Size, By Industrial End-User, 2015�2022 (USD Million)
Table 62 Spain: Market Size, By End User, 2015�2022 (USD Million)
Table 63 Spain: Market Size, By Industrial End-User, 2015�2022 (USD Million)
Table 64 The Rest of Europe: Market Size, By End-User, 2015�2022 (USD Million)
Table 65 The Rest of Europe: Market Size, By Industrial End-User, 2015�2022 (USD Million)
Table 66 South America: Market Size, By Country, 2015�2022 (USD Million)
Table 67 South America: Market Size, By Type, 2015�2022 (USD Million)
Table 68 South America: Market Size, B Y Component, 2015�2022 (USD Million)
Table 69 South America: Market Size, By End-User, 2015�2022 (USD Million)
Table 70 South America: Market Size, By Industrial End-User, 2015�2022 (USD Million)
Table 71 Brazil: Market Size, By End-User, 2015�2022 (USD Million)
Table 72 Brazil: Market Size, By Industrial End-User, 2015�2022 (USD Million)
Table 73 Argentina: Market Size, By End-User, 2015�2022 (USD Million)
Table 74 Argentina: Market Size, By Industrial End-User, 2015�2022 (USD Million)
Table 75 Venezuala: Market Size, By End-User, 2015�2022 (USD Million)
Table 76 Venezuala: Market Size, By Industrial End-User, 2015�2022 (USD Million)
Table 77 The Rest of South America: Market Size, By End-User, 2015�2022 (USD Million)
Table 78 The Rest of South America: Market Size, By Industrial End-User, 2015�2022 (USD Million)
Table 79 Middle East & Africa: Market Size, By Country, 2015�2022 (USD Million)
Table 80 Middle East & Africa: Market Size, By Type, 2015�2022 (USD Million)
Table 81 Middle East & Africa: Market Size, By Component, 2015�2022 (USD Million)
Table 82 Middle East & Africa: Market Size, By End-User, 2015�2022 (USD Million)
Table 83 Middle East & Africa: Market Size, By Industrial End-User, 2015�2022 (USD Million)
Table 84 Saudi Arabia: Market Size, By End-User, 2015�2022 (USD Million)
Table 85 Saudi Arabia: Market Size, By Industrial End-User, 2015�2022 (USD Million)
Table 86 The UAE: Market Size, By End-User, 2015�2022 (USD Million)
Table 87 The UAE: Market Size, By Industrial End-User, 2015�2022 (USD Million)
Table 88 Algeria: Market Size, By End-User, 2015�2022 (USD Million)
Table 89 Algeria: Market Size, By Industrial End-User, 2015�2022 (USD Million)
Table 90 Kuwait: Market Size, By End-User, 2015�2022 (USD Million)
Table 91 Kuwait: Market Size, By Industrial End-User, 2015�2022 (USD Million)
Table 92 South Africa: Low Voltage Motor Control Centers Market Size, By End-User, 2015�2022 (USD Million)
Table 93 South Africa: Market Size, By Industrial End-User, 2015�2022 (USD Million)
Table 94 The Rest of the Middle East & Africa: Market Size, By End-User, 2015�2022 (USD Million)
Table 95 The Rest of the Middle East & Africa: Market Size, By Industrial End-User, 2015�2022 (USD Million)
List of Figures (65 Figures)
Figure 1 Low Voltage Motor Control Centers Market Segmentation
Figure 2 Low Voltage Motor Control Centers Market: Research Design
Figure 3 Bottom-Up Approach
Figure 4 Top-Down Approach
Figure 5 Data Triangulation Methodology
Figure 6 Assumptions of the Research Study
Figure 7 The Market in Asia Pacific is Estimated to Hold the Largest Share of the Low Voltage Motor Control Centers Market in 2017
Figure 8 The Intelligent Segment is Expected to Grow at the Highest CAGR From 2017 to 2022
Figure 9 The Busbars Segment is Estimated to Account for the Largest Share of the Low Voltage Motor Control Centers Market From 2017 to 2022
Figure 10 The Industrial Segment is Estimated to Dominate the Low Voltage Motor Control Centers Market in 2017
Figure 11 The Oil & Gas Segment is Expected to Dominate the Industrial Low Voltage Motor Control Centers Market From 2017 to 2022
Figure 12 Attractive Opportunities in the Low Voltage Motor Control Centers Market, 2017�2022
Figure 13 The Market in Asia Pacific is Expected to Grow at the Highest CAGR From 2017 to 2022
Figure 14 The Conventional Low Volatge Motor Control Centers Market is Expected to Grow at the Highest CAGR During the Forecast Period
Figure 15 The Busbars Segment is Expected to Hold A Major Share of the Low Voltage Motor Control Centers Market, 2017�2022
Figure 16 The Industrial Segment is Expected to Grow at the Highest CAGR From 2017 to 2022
Figure 17 The Market in China Accounted for the Largest Share of the Market in Asia Pacific in 2016
Figure 18 Growing Demand for Industrial Automation to Drive the Low Voltage Motor Control Centers Market
Figure 19 Industrial Control and Factory Automation Market, 2016�2022
Figure 20 Electrical Network Expenditure, 2015
Figure 21 Crude Oil Price Trend (June 2014�April 2017)
Figure 22 Usable Iron Ore Production, 2014�2015
Figure 23 Growing Urbanization Trend, 1950�2050
Figure 24 Supply Chain Analysis: Low Voltage Motor Control Centers Market
Figure 25 Porter�s Five Forces Analysis: Low Voltage Motor Control Centers Market
Figure 26 The Conventional Motor Control Centers Segment is Expected to Be the Largest Low Voltage Motor Control Centers Market During the Forecast Period
Figure 27 Conventional Motor Control Centers Market, By Region, 2017 & 2022 (USD Million)
Figure 28 The Busbars Segment is Expected to Be the Largest Market for Low Voltage Motor Control Centers During the Forecast Period
Figure 29 Asia Pacific: the Fastest Growing Low Voltage Motor Control Centers Market in the Busbars Segment, 2017�2022
Figure 30 Circuit Breakers & Fuses Market, By Region, 2017�2022
Figure 31 Overload Relays Segment, By Region, 2017�2022 (USD Million)
Figure 32 The Industrial Segment is Expected to Be the Largest Market for Low Voltage Motor Control Centers During the Forecast Period
Figure 33 Industrial Segment, By Region, 2017�2022 (USD Million)
Figure 34 Asia Pacific: the Fastest Growing Low Voltage Motor Control Centers Market in the Oil & Gas Segment, 2017�2022
Figure 35 Mining & Metals Segment, By Region, 2017
Figure 36 Regional Snapshot: Low Voltage Motor Control Centers Market (2017�2022)
Figure 37 Asia Pacific: the Largest & Fastest Growing Low Voltage Motor Control Centers Market, 2017�2022
Figure 38 Asia Pacific: Market Snapshot
Figure 39 China: Low Voltage Motor Control Centers Market, By End-User, 2017�2022
Figure 40 India: Low Voltage Motor Control Centers Market, By End-User, 2017�2022
Figure 41 North America: Market Snapshot
Figure 42 Industrial: Expected to Be the Fastest Growing End-User Segment in the US During the Forecast Period
Figure 43 Germany: the Largest Market in Europe in 2016
Figure 44 Germany: Market, By End-User, 2017�2022
Figure 45 France: Market, By End-User, 2017�2022
Figure 46 South America: Market, By Country, 2016
Figure 47 Brazil: Motor Control Centers Market, By End-User, 2017�2022
Figure 48 Saudi Arabia: the Fastest Growing Market in the Middle East & Africa From 2017 to 2022
Figure 49 Saudi Arabia: Low Voltage Motor Control Centers Market, By End-User, 2017 & 2022
Figure 50 The UAE: Market, By End-User, 2017�2022
Figure 51 Companies Adopted New Product Launches as the Key Strategy to Capture the Market, 2013�2017
Figure 52 Market Share, Low Voltage Motor Control Centers Market, 2016
Figure 53 Market Evaluation Framework, 2013�2017
Figure 54 Battle for Market Share: New Product Launches Was the Key Strategy, 2013�2017
Figure 55 ABB Ltd.: Company Snapshot
Figure 56 Eaton Corporation PLC: Company Snapshot
Figure 57 Siemens AG: Company Snapshot
Figure 58 General Electric Company: Company Snapshot
Figure 59 Schneider Electric SE: Company Snapshot
Figure 60 Rockwell Automation, Inc.: Company Snapshot
Figure 61 Mitsubishi Electric Corporation: Company Snapshot
Figure 62 WEG SA: Company Snapshot
Figure 63 Lsis Co., Ltd.: Company Snapshot
Figure 64 Larsen & Toubro Limited: Company Snapshot
Figure 65 Fuji Electric Co., Ltd: Company Snapshot


Growth opportunities and latent adjacency in Low Voltage Motor Control Centers Market