Lymphedema Diagnostics Market by Technology (Lymphoscintigraphy, MRI, Near IR Fluorescence Imaging, Ultrasound), Disease Type (Cancer, Inflammatory Diseases, Cardiovascular, Filariasis), End User (Hospitals, Diagnostic Centers) - Global Forecasts to 2024


[165 Pages Report] The global lymphedema diagnostics market is projected to reach USD 35 million by 2024 from USD 24 million in 2019, at a CAGR of 7.4%. The growing global prevalence of lymphedema and cancer; technological advancements in diagnostic imaging modalities; and increasing investments, funds, and grants by public-private organizations are the major factors driving the growth of this market. However, the high cost of diagnostic imaging systems, the short half-life of radiopharmaceuticals, the limited supply of helium, and the increasing adoption of refurbished diagnostic imaging systems are expected to restrain the growth of this market.
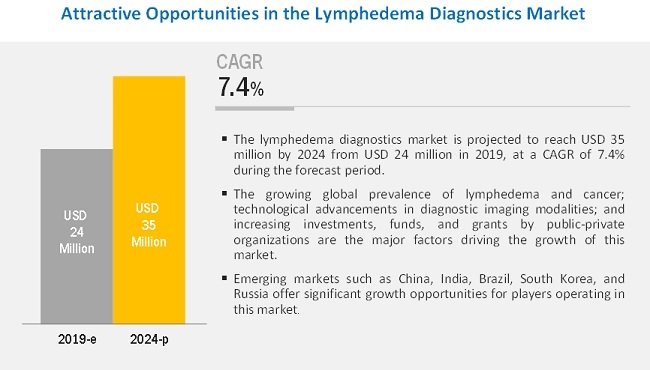
By technology, the lymphoscintigraphy segment is expected to account for the largest share during the forecast period.
Based on technology, the lymphedema diagnostics market is segmented into lymphoscintigraphy, magnetic resonance imaging (MRI), ultrasound imaging, computed tomography (CT), X-ray lymphography, bioimpedance analysis, and near-infrared fluorescence imaging. The lymphoscintigraphy segment accounted for the largest share of the market in 2018. The noninvasive nature and easy reproducibility of this technology, and the fact that lymphoscintigraphy does not adversely affect the lymphatic vascular endothelium are some of the key advantages supporting the adoption of this technology.
By disease type, the cancer segment is expected to be the largest contributor to the lymphedema diagnostics market.
On the basis of disease type, the market is segmented into cancer, cardiovascular disease, inflammatory diseases, and other diseases. The cancer segment accounted for the largest share of the market in 2018. The large share of this segment can be attributed to the rising prevalence of cancer-associated lymphedema and increasing awareness about early disease diagnosis.
The hospitals segment accounted for the largest share of the lymphedema diagnostics market in 2018.
On the basis of end user, the market is segmented into hospitals, diagnostic centers, research & academic institutes, and other end users (pharmaceutical & biotechnology companies and CROs). The hospitals segment accounted for the largest share of the market in 2018. The large share of this segment can be attributed to the large number of lymphedema diagnostic procedures performed in hospitals, the growing adoption of minimally invasive procedures, and the rising adoption of advanced imaging modalities to improve workflow efficiency in hospitals.
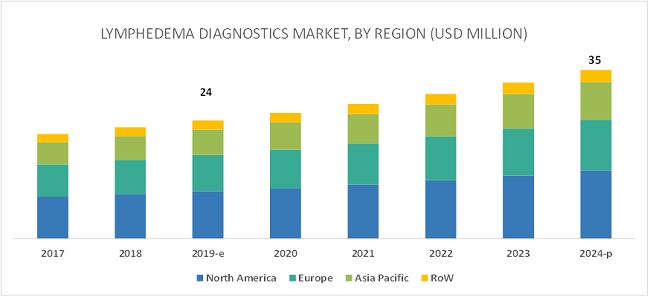
The Asia Pacific region is expected to grow at the fastest rate during the forecast period.
The lymphedema diagnostics market is segmented into four major regions, namely, North America, Europe, the Asia Pacific, and the RoW. The Asia Pacific region is one of the major revenue-generating regions in the market. This market is also expected to show high growth in the coming years, mainly due to the increasing incidence of chronic diseases, growing awareness about the benefits of early lymphedema diagnosis, improvements in healthcare systems, and growing research activities related to the development of advanced lymphedema diagnostic modalities.
Key Market Players
GE Healthcare (US), Philips (Netherlands), and Siemens Healthineers (Germany) dominated the lymphedema diagnostics market. Other prominent players include Canon, Inc. (Japan), Shimadzu Corporation (Japan), Stryker Corporation (US), Fluoptics (France), United Imaging Healthcare Co., Ltd. (China), Hitachi, Ltd. (Japan), Esaote, SpA (Italy), Neusoft Corporation (China), Mindray Medical International, Ltd. (China), Mitaka USA, Inc. (US), Curadel, LLC (US), and ImpediMed Ltd. (Australia), among others.
GE Healthcare (US) is one of the leading players in the global market. To sustain its leadership position and ensure future growth, the company focuses on product launches and agreements, partnerships, and collaborations as its key business growth strategies. The company also focuses on geographic expansions and the development of low-cost equipment, specifically for developing nations. With a wide product portfolio and strong geographic presence, the company is expected to witness significant growth in the market in the coming years.
Scope of the Report
|
Report Metric |
Details |
|
Market Size Available for Years |
2017�2024 |
|
Base Year Considered |
2018 |
|
Forecast Period |
2019�2024 |
|
Forecast Units |
Value (USD) |
|
Segments Covered |
Technology, Disease Type, End User, and Region |
|
Geographies Covered |
North America (US & Canada), Europe (Germany, France, UK, and RoE), APAC (Japan, China, India, and RoAPAC), and RoW (Latin America and Middle East & Africa) |
|
Companies Covered |
GE Healthcare (US), Philips (Netherlands), and Siemens Healthineers (Germany), Canon, Inc. (Japan), Shimadzu Corporation (Japan), Stryker Corporation (US), Fluoptics (France), United Imaging Healthcare Co., Ltd. (China), Hitachi, Ltd. (Japan), Esaote, SpA (Italy), Neusoft Corporation (China), Mindray Medical International, Ltd. (China), Mitaka USA, Inc. (US), Curadel, LLC (US), and ImpediMed Ltd. (Australia). 15 major players covered. |
This research report categorizes the market based on technology, disease type, end user, and region.
Lymphedema Diagnostics Market, by Technology
- X-ray Lymphography
- Lymphoscintigraphy
- Computed Tomography
- Ultrasound Imaging
- Magnetic Resonance Imaging
- Bioimpedance Analysis
- Near-infrared Fluorescence Imaging
- ICG Lymphography
- Fluorescein Sodium Microlymphangiography
Lymphedema Diagnostics Market, by Disease Type
- Cancer
- Cardiovascular Disease
- Inflammatory Diseases
- Other Diseases
Lymphedema Diagnostics Market, by End User
- Hospitals
- Diagnostic Centers
- Research & Academic Institutes
- Other End Users
Lymphedema Diagnostics Market, by Region
- North America
- US
- Canada
- Europe
- Germany
- France
- UK
- RoE
- Asia Pacific
- Japan
- China
- India
- RoAPAC
- Rest of the World
- Latin America
- Middle East & Africa
Key Questions Addressed by the Report:
- What are the growth opportunities related to the adoption of lymphedema diagnostics across major regions in the future?
- Emerging countries have immense opportunities for the growth and adoption of near-infrared fluorescence imaging for lymphedema diagnostics. Will this scenario continue in the next five years?
- Where will all the advancements in products offered by various companies take the industry in the mid- to long-term?
- What are the new trends and advancements in the market?
To speak to our analyst for a discussion on the above findings, click Speak to Analyst
 Exclusive indicates content/data unique to MarketsandMarkets and not available with any competitors.
Table of Contents
1 Introduction (Page No. - 16)
1.1 Objectives of the Study
1.2 Market Definition
1.3 Market Scope
1.3.1 Markets Covered
1.3.2 Years Considered for the Study
1.4 Currency
1.5 Stakeholders
2 Research Methodology (Page No. - 19)
2.1 Research Data
2.1.1 Secondary Data
2.1.1.1 Key Data From Secondary Sources
2.1.2 Primary Data
2.1.2.1 Key Data From Primary Sources
2.2 Market Size Estimation
2.2.1 Product-Based Market Estimation
2.2.2 Primary Research Validation
2.3 Market Breakdown and Data Triangulation
2.4 Research Limitations and Assumptions
2.4.1 Limitations
2.4.2 Assumptions
3 Executive Summary (Page No. - 29)
4 Premium Insights (Page No. - 33)
4.1 Lymphedema Diagnostics: Market Overview
4.2 Regional Analysis: Market, By Disease Type (2019)
4.3 Market, By Technology, 2019 vs 2024 (USD Million)
4.4 Near-Infrared Fluorescence Imaging Market, By Type, 2019 vs 2024 (USD Million)
4.5 Market, By Country
5 Market Overview (Page No. - 38)
5.1 Introduction
5.2 Market Dynamics
5.2.1 Drivers
5.2.1.1 Growing Global Prevalence of Lymphedema
5.2.1.2 Growing Global Prevalence of Cancer
5.2.1.3 Technological Advancements and Adoption of Newer Diagnostic Modalities
5.2.1.4 Increasing Investments, Funds, and Grants By Public-Private Organizations
5.2.2 Restraints
5.2.2.1 High Cost of Diagnostic Imaging Systems
5.2.2.2 Short Half-Life of Radiopharmaceuticals
5.2.2.3 Limited Supply of Helium
5.2.2.4 Increasing Adoption of Refurbished Diagnostic Imaging Systems
5.2.3 Opportunities
5.2.3.1 Emerging Countries
5.2.4 Challenges
5.2.4.1 Hospital Budget Cuts
6 Lymphedema Diagnostics Market, By Technology (Page No. - 45)
6.1 Introduction
6.2 Lymphoscintigraphy
6.2.1 Lymphoscintigraphy is Rapidly Developing to Be the First-Line Imaging Modality for Lymphedema Diagnostics
6.3 Magnetic Resonance Imaging
6.3.1 Magnetic Resonance Imaging Finds Major Applications in Lymphedema Treatment Planning
6.4 Ultrasound Imaging
6.4.1 Ultrasound Imaging has the Potential to Determine Tissue Changes Consistent With Different Stages of Lymphedema
6.5 Computed Tomography
6.5.1 High Cost of Computed Tomography to Limit Market Growth
6.6 X-Ray Lymphography
6.6.1 Invasive Nature & Risk of Radiation Exposure are Expected to Hamper Market Growth
6.7 Bioimpedance Analysis
6.7.1 Lack of Awareness About Bioimpedance Analysis is Limiting the Growth of This Segment
6.8 Near-Infrared Fluorescence Imaging
6.8.1 ICG Lymphography
6.8.1.1 ICG Lymphography Offers A Powerful Tool for Efficiently Diagnosing Various Stages of Lymphedema
6.8.2 Fluorescein Sodium Microlymphangiography
6.8.2.1 Fluorescein Sodium Microlymphangiography is Limited to Visualizing Only Initial Capillaries
7 Lymphedema Diagnostics Market, By Disease Type (Page No. - 59)
7.1 Introduction
7.2 Cancer
7.2.1 One in Three Cancer-Treated Patients Develop Lymphedema
7.3 Inflammatory Diseases
7.3.1 Growing Prevalence of Inflammatory Conditions to Drive Market Growth
7.4 Cardiovascular Disease
7.4.1 Growing Awareness About Early Disease Diagnosis to Drive the Adoption of Lymphedema Diagnostic Tools
7.5 Other Diseases
8 Lymphedema Diagnostics Market, By End User (Page No. - 64)
8.1 Introduction
8.2 Hospitals
8.2.1 The Large Number of Lymphedema Diagnostic Procedures Performed in Hospitals to Drive Market Growth
8.3 Diagnostic Centers
8.3.1 Increasing Number of Private Imaging Centers to Support Market Growth
8.4 Research & Academic Institutes
8.4.1 Budgetary Restrictions of Researchers are Limiting the Adoption of High-End Lymphedema Diagnostic Technologies
8.5 Other End Users
9 Lymphedema Diagnostics Market, By Region (Page No. - 69)
9.1 Introduction
9.2 North America
9.2.1 US
9.2.1.1 The US Dominated the North American Market in 2018
9.2.2 Canada
9.2.2.1 Dearth of Radiologists is Restricting Market Growth in Canada
9.3 Europe
9.3.1 Germany
9.3.1.1 Germany Accounts for the Largest Share of the European Market
9.3.2 France
9.3.2.1 Uncertainties With Regard to the Pricing Strategy of Diagnostic Companies to Limit Market Growth in France to A Certain Extent
9.3.3 UK
9.3.3.1 Rising Diagnostic Imaging Procedural Volumes Indicate Strong Growth in the UK Market
9.3.4 RoE
9.4 Asia Pacific
9.4.1 China
9.4.1.1 Rising Disease Incidence, Increasing Procedural Volumes, and Growth in the Geriatric Population have Contributed to Market Growth in China
9.4.2 Japan
9.4.2.1 Japan�s Well-Established and Well-Equipped Healthcare System Ensures Demand for and Easy Access to Diagnostic Imaging
9.4.3 India
9.4.3.1 Growing Incidence of Lymphatic Filariasis is A Key Contributor to Market Growth
9.4.4 RoAPAC
9.5 Rest of the World
9.5.1 Latin America
9.5.1.1 Latin America Holds the Largest Share of the RoW Market
9.5.2 Middle East & Africa
9.5.2.1 Growing Geriatric Population & Disease Prevalence are Driving Growth in Mea
10 Competitive Landscape (Page No. - 106)
10.1 Introduction
10.2 Ranking of Players, 2018
10.3 Competitive Scenario
10.4 Vendor Dive Overview
10.5 Vendor Inclusion Criteria
10.6 Vendor Dive
10.6.1 Visionary Leaders
10.6.2 Innovators
10.6.3 Dynamic Differentiators
10.6.4 Emerging Companies
11 Company Profiles (Page No. - 111)
(Business Overview, Products Offered, Recent Developments, MnM View)*
11.1 GE Healthcare
11.2 Siemens Healthineers (A Subsidiary of Siemens Group)
11.3 Philips
11.4 Canon, Inc.
11.5 Shimadzu Corporation
11.6 Stryker Corporation
11.7 Fluoptics
11.8 United Imaging Healthcare Co., Ltd.
11.9 Hitachi, Ltd.
11.10 Esaote SPA
11.11 Neusoft Corporation
11.12 Mindray Medical International Limited (A Subsidiary of Excelsior Union, Ltd.)
11.13 Mitaka Usa, Inc.
11.14 Curadel, LLC
11.15 Impedimed Limited
11.16 Other Companies
*Business Overview, Products Offered, Recent Developments, MnM View Might Not Be Captured in Case of Unlisted Companies.
12 Appendix (Page No. - 158)
12.1 Discussion Guide
12.2 Knowledge Store: Marketsandmarkets� Subscription Portal
12.3 Available Customizations
12.4 Related Reports
12.5 Author Details
List of Tables (107 Tables)
Table 1 Technological Advancements in Diagnostic Imaging Systems
Table 2 Key Investments By Government Bodies in the Diagnostic Imaging Market
Table 3 Lymphedema Diagnostics Market, By Technology, 2017�2024 (USD Million)
Table 4 Comparison of Diagnostic Imaging Tests for Lymphedema
Table 5 Lymphoscintigraphy Market, By Region, 2017�2024 (USD Million)
Table 6 Lymphoscintigraphy Market, By Country, 2017�2024 (USD Million)
Table 7 Magnetic Resonance Imaging Market, By Region, 2017�2024 (USD Million)
Table 8 Magnetic Resonance Imaging Market, By Country, 2017�2024 (USD Million)
Table 9 Ultrasound Imaging Market, By Region, 2017�2024 (USD Million)
Table 10 Ultrasound Imaging Market, By Country, 2017�2024 (USD Million)
Table 11 Computed Tomography Market, By Region, 2017�2024 (USD Million)
Table 12 Computed Tomography Market, By Country, 2017�2024 (USD Million)
Table 13 X-Ray Lymphography Market, By Region, 2017�2024 (USD Million)
Table 14 X-Ray Lymphography Market, By Country, 2017�2024 (USD Million)
Table 15 Bioimpedance Analysis Market, By Region, 2017�2024 (USD Million)
Table 16 Bioimpedance Analysis Market, By Country, 2017�2024 (USD Million)
Table 17 Near-Infrared Fluorescence Imaging Market, By Type, 2017�2024 (USD Million)
Table 18 Near-Infrared Fluorescence Imaging Market, By Region, 2017�2024 (USD Million)
Table 19 Near-Infrared Fluorescence Imaging Market, By Country, 2017�2024 (USD Million)
Table 20 ICG Lymphography Market, By Region, 2017�2024 (USD Million)
Table 21 ICG Lymphography Market, By Country, 2017�2024 (USD Million)
Table 22 Fluorescein Sodium Microlymphangiography Market, By Region, 2017�2024 (USD Million)
Table 23 Fluorescein Sodium Microlymphangiography Market, By Country, 2017�2024 (USD Million)
Table 24 Lymphedema Diagnostics Market, By Disease Type, 2017�2024 (USD Million)
Table 25 Market for Cancer, By Region, 2017�2024 (USD Million)
Table 26 Market for Inflammatory Diseases, By Region, 2017�2024 (USD Million)
Table 27 Market for Cardiovascular Disease, By Region, 2017�2024 (USD Million)
Table 28 Market for Other Diseases, By Region, 2017�2024 (USD Million)
Table 29 Market, By End User, 2017�2024 (USD Million)
Table 30 Market for Hospitals, By Region, 2017�2024 (USD Million)
Table 31 Market for Diagnostic Centers, By Region, 2017�2024 (USD Million)
Table 32 Lymphedema Diagnostics Market for Research & Academic Institutes, By Region, 2017�2024 (USD Million)
Table 33 Market for Other End Users, By Region, 2017�2024 (USD Million)
Table 34 Market, By Region, 2017�2024 (USD Million)
Table 35 Market, By Country, 2017�2024 (USD Million)
Table 36 North America: Market, By Country, 2017�2024 (USD Million)
Table 37 North America: Market, By Technology, 2017�2024 (USD Million)
Table 38 North America: Market for Near-Infrared Fluorescence Imaging, By Type, 2017�2024 (USD Million)
Table 39 North America: Market, By Disease Type, 2017�2024 (USD Million)
Table 40 North America: Market, By End User, 2017�2024 (USD Million)
Table 41 US: Market, By Technology, 2017�2024 (USD Million)
Table 42 US: Market for Near-Infrared Fluorescence Imaging, By Type, 2017�2024 (USD Million)
Table 43 US: Market, By Disease Type, 2017�2024 (USD Million)
Table 44 US: Market, By End User, 2017�2024 (USD Million)
Table 45 Canada: Market, By Technology, 2017�2024 (USD Million)
Table 46 Canada: Lymphedema Diagnostics Market for Near-Infrared Fluorescence Imaging, By Type, 2017�2024 (USD Million)
Table 47 Canada: Market, By Disease Type, 2017�2024 (USD Million)
Table 48 Canada: Market, By End User, 2017�2024 (USD Million)
Table 49 Europe: Market, By Country, 2017�2024 (USD Million)
Table 50 Europe: Market, By Technology, 2017�2024 (USD Million)
Table 51 Europe: Market for Near-Infrared Fluorescence Imaging, By Type, 2017�2024 (USD Million)
Table 52 Europe: Market, By Disease Type, 2017�2024 (USD Million)
Table 53 Europe: Market, By End User, 2017�2024 (USD Million)
Table 54 Germany: Market, By Technology, 2017�2024 (USD Million)
Table 55 Germany: Market for Near-Infrared Fluorescence Imaging, By Type, 2017�2024 (USD Million)
Table 56 Germany: Market, By Disease Type, 2017�2024 (USD Million)
Table 57 Germany: Market, By End User, 2017�2024 (USD Million)
Table 58 France: Lymphedema Diagnostics Market, By Technology, 2017�2024 (USD Million)
Table 59 France: Market for Near-Infrared Fluorescence Imaging, By Type, 2017�2024 (USD Million)
Table 60 France: Market, By Disease Type, 2017�2024 (USD Million)
Table 61 France: Market, By End User, 2017�2024 (USD Million)
Table 62 UK: Market, By Technology, 2017�2024 (USD Million)
Table 63 UK: Market for Near-Infrared Fluorescence Imaging, By Type, 2017�2024 (USD Million)
Table 64 UK: Market, By Disease Type, 2017�2024 (USD Million)
Table 65 UK: Market, By End User, 2017�2024 (USD Million)
Table 66 RoE: Market, By Technology, 2017�2024 (USD Million)
Table 67 RoE: Market for Near-Infrared Fluorescence Imaging, By Type, 2017�2024 (USD Million)
Table 68 RoE: Lymphedema Diagnostics Market, By Disease Type, 2017�2024 (USD Million)
Table 69 RoE: Market, By End User, 2017�2024 (USD Million)
Table 70 Asia Pacific: Market, By Country, 2017�2024 (USD Million)
Table 71 Asia Pacific: Market, By Technology, 2017�2024 (USD Million)
Table 72 Asia Pacific: Market for Near-Infrared Fluorescence Imaging, By Type, 2017�2024 (USD Million)
Table 73 Asia Pacific: Market, By Disease Type, 2017�2024 (USD Million)
Table 74 Asia Pacific: Market, By End User, 2017�2024 (USD Million)
Table 75 China: Market, By Technology, 2017�2024 (USD Million)
Table 76 China: Market for Near-Infrared Fluorescence Imaging, By Type, 2017�2024 (USD Million)
Table 77 China: Market, By Disease Type, 2017�2024 (USD Million)
Table 78 China: Market, By End User, 2017�2024 (USD Million)
Table 79 Japan: Market, By Technology, 2017�2024 (USD Million)
Table 80 Japan: Market for Near-Infrared Fluorescence Imaging, By Type, 2017�2024 (USD Million)
Table 81 Japan: Lymphedema Diagnostics Market, By Disease Type, 2017�2024 (USD Million)
Table 82 Japan: Market, By End User, 2017�2024 (USD Million)
Table 83 India: Market, By Technology, 2017�2024 (USD Million)
Table 84 India: Market for Near-Infrared Fluorescence Imaging, By Type, 2017�2024 (USD Million)
Table 85 India: Market, By Disease Type, 2017�2024 (USD Million)
Table 86 India: Market, By End User, 2017�2024 (USD Million)
Table 87 RoAPAC: Market, By Technology, 2017�2024 (USD Million)
Table 88 RoAPAC: Lymphedema Diagnostics Market for Near-Infrared Fluorescence Imaging, By Type, 2017�2024 (USD Million)
Table 89 RoAPAC: Market, By Disease Type, 2017�2024 (USD Million)
Table 90 RoAPAC: Market, By End User, 2017�2024 (USD Million)
Table 91 RoW: Market, By Region, 2017�2024 (USD Million)
Table 92 RoW: Market, By Technology, 2017�2024 (USD Million)
Table 93 RoW: Market for Near-Infrared Fluorescence Imaging, By Type, 2017�2024 (USD Million)
Table 94 RoW: Market, By Disease Type, 2017�2024 (USD Million)
Table 95 RoW: Market, By End User, 2017�2024 (USD Million)
Table 96 Latin America: Lymphedema Diagnostics Market, By Technology, 2017�2024 (USD Million)
Table 97 Latin America: Market for Near-Infrared Fluorescence Imaging, By Type, 2017�2024 (USD Million)
Table 98 Latin America: Market, By Disease Type, 2017�2024 (USD Million)
Table 99 Latin America: Market, By End User, 2017�2024 (USD Million)
Table 100 Middle East & Africa: Market, By Technology, 2017�2024 (USD Million)
Table 101 Middle East & Africa: Market for Near-Infrared Fluorescence Imaging, By Type, 2017�2024 (USD Million)
Table 102 Middle East & Africa: Market, By Disease Type, 2017�2024 (USD Million)
Table 103 Middle East & Africa: Market, By End User, 2017�2024 (USD Million)
Table 104 Product Launches, Enhancements, & Approvals
Table 105 Partnerships, Collaborations, & Agreements
Table 106 Acquisitions
Table 107 Expansions
List of Figures (30 Figures)
Figure 1 Lymphedema Diagnostics Market: Research Methodology Steps
Figure 2 Research Design
Figure 3 Breakdown of Primaries: Global Market
Figure 4 Research Methodology: Hypothesis Building
Figure 5 Market Size Estimation: Market
Figure 6 Data Triangulation Methodology
Figure 7 Market, By Technology, 2019 vs 2024 (USD Million)
Figure 8 Geographic Analysis: Lymphedema Diagnostics Market, By Disease Type, 2019
Figure 9 Market, By End User, 2019 vs 2024
Figure 10 Geographical Snapshot of the Market
Figure 11 Rising Prevalence of Lymphedema�A Major Factor Driving the Market for Lymphedema Diagnostics
Figure 12 North America to Account for the Largest Share of the Lymphedema Diagnostics Market, By Disease Type, in 2019
Figure 13 Near-Infrared Fluorescence Imaging to Register the Highest Growth in the Market During the Forecast Period
Figure 14 ICG Lymphography Segment Will Continue to Dominate the Near-Infrared Fluorescence Imaging Market in 2024
Figure 15 China to Register the Highest Growth During the Forecast Period
Figure 16 Lymphedema Diagnostics Market: Drivers, Restraints, Opportunities, and Challenges
Figure 17 North America: Market Snapshot
Figure 18 Europe: Market Snapshot
Figure 19 Asia Pacific: Market Snapshot
Figure 20 GE Healthcare Held the Leading Position in the Market in 2018
Figure 21 Market (Global) Competitive Leadership Mapping, 2018
Figure 22 GE Healthcare: Company Snapshot
Figure 23 Siemens AG: Company Snapshot
Figure 24 Philips: Company Snapshot
Figure 25 Canon, Inc.: Company Snapshot
Figure 26 Shimadzu Corporation: Company Snapshot
Figure 27 Stryker Corporation: Company Snapshot
Figure 28 Hitachi, Ltd.: Company Snapshot
Figure 29 Neusoft Corporation: Company Snapshot
Figure 30 Impedimed Limited: Company Snapshot
The study involved four major activities in estimating the current market size for the lymphedema diagnostics market. Exhaustive secondary research was done to collect information on the market and its different subsegments. The next step was to validate these findings, assumptions, and sizing with industry experts across the value chain through primary research. Both top-down and bottom-up approaches were employed to estimate the complete market size. Thereafter, market breakdown and data triangulation procedures were used to estimate the market size of segments and subsegments.
Secondary Research
In the secondary research process, various secondary sources such as annual reports, press releases & investor presentations of companies, white papers, certified publications, articles by recognized authors, gold-standard & silver-standard websites, regulatory bodies, and databases (such as D&B Hoovers, Bloomberg Businessweek, and Factiva) were referred to in order to identify and collect information for this study.
Primary Research
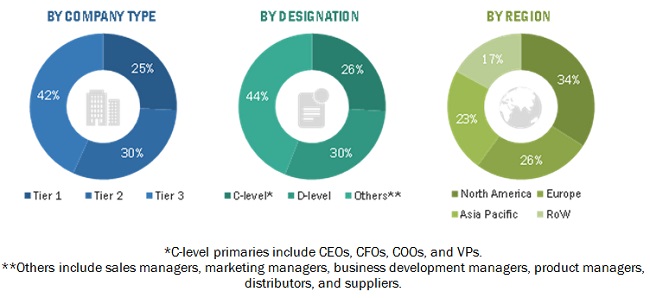
The lymphedema diagnostics market comprises several stakeholders, such as manufacturers of lymphedema diagnostic systems, clinical research organizations (CROs), diagnostic imaging centers, and hospitals. The demand side of this market is characterized by the global rise in the prevalence of cancer and lymphedema cases. Various primary sources from both the supply and demand sides of the market were interviewed to obtain qualitative and quantitative information. The following is the breakdown of primary respondents:
To know about the assumptions considered for the study, download the pdf brochure
Market Size Estimation
Both top-down and bottom-up approaches were used to estimate and validate the total size of the lymphedema diagnostics market. These methods were also used extensively to estimate the size of various subsegments in the market. The research methodology used to estimate the market size includes the following:
- The key players in the industry and markets have been identified through extensive secondary research.
- The industry�s supply chain and market size, in terms of value, have been determined through primary and secondary research processes.
- All percentage shares, splits, and breakdowns have been determined using secondary sources and verified through primary sources.
Data Triangulation
After arriving at the overall market size�using the market size estimation processes as explained above�the market was split into several segments and subsegments. In order to complete the overall market engineering process and arrive at the exact statistics of each market segment and subsegment, data triangulation and market breakdown procedures were employed, wherever applicable. The data was triangulated by studying various factors and trends from both the demand and supply sides in the market.
Report Objectives
- To define, describe, and forecast the market on the basis of technology, disease type, end user, and region
- To provide detailed information regarding the major factors influencing the growth of this market (such as drivers, restraints, opportunities, and challenges)
- To strategically analyze the micromarkets with respect to individual growth trends, prospects, and contributions to the total market
- To analyze the opportunities in the market for stakeholders and provide details of the competitive landscape for market leaders
- To forecast the revenue of market segments with respect to four main regions, namely, North America, Europe, the Asia Pacific, and the Rest of the World
- To strategically profile the key players and comprehensively analyze their market shares and core competencies
- To track and analyze competitive developments such as product launches, approvals, & enhancements; agreements, partnerships, collaborations, & contracts; acquisitions; and R&D activities in the lymphedema diagnostics market
Available Customizations
With the given market data, MarketsandMarkets offers customizations as per the company�s specific needs. The following customization options are available for the market:
Product Analysis
- Product matrix, which gives a detailed comparison of the product portfolios of the top five companies
Company Information
- Detailed analysis and profiling of additional market players (up to 5)

 Generating Response ...


Growth opportunities and latent adjacency in Lymphedema Diagnostics Market