Oil & Gas Processing Seals Market by Type (Single, Double), Material (Metal, Elastomer, Face Material), Application, and Region (Asia Pacific, Europe, North America, South America, Middle East & Africa) - Global Forecast to 2023


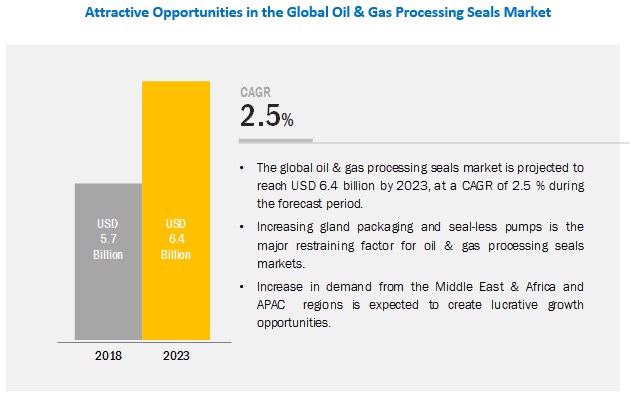
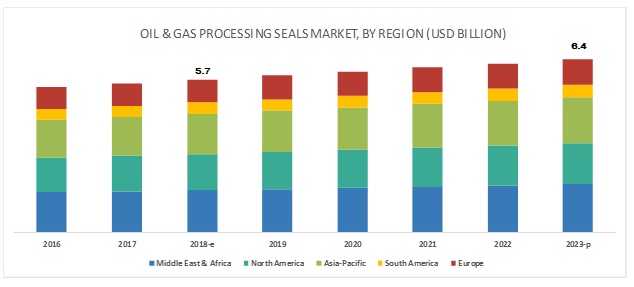
[116 Pages Report] The global oil & gas processing seals market is estimated to be USD 5.7 billion in 2018 and is projected to reach USD 6.4 billion by 2023, at a CAGR of 2.5 % during the same period. The increased production of shale gas in developing and developed countries is expected to drive the oil & gas processing seals market.
See how this study impacted revenues for other players in Oil & Gas Processing Seals Market
Client�s Problem Statement
Our client, a top European sealing solutions manufacturer, was keen to increase its market penetration in APAC and MEA markets. The senior management needed to take a host of crucial decisions � which product to focus on, which countries in APAC and MEA to prioritise, which technologies to focus on, which application to focus on & what offering/ value proposition to build for target customers.
MnM Approach
For each product type, MNM assisted the client with an outside-in perspective on the market potential in various end-use segments such as water, sewer, drainage & irrigation by region and country. Further, we helped them identify the highest potential technology for respective end-use segments in each region and country. MNM also helped them better understand the competitive landscape, their business models & strategies of different players to win in these markets. This helped them devise a differentiated product offering. Interviews with a host of potential customers in end-use industries were conducted to understand their unmet needs, pull for target products and what they looked for in a product supplier. This helped our client refine their value proposition to quickly gain share.
Revenue Impact (RI)
Our findings helped the client to penetrate $2 Bn market, with a projected revenue of $50 million in 5 years. The client was able to establish and grow his pipe seals, pipe repair and extruded profiles business in APAC and MEA.
By type, double seal is expected to be the largest contributor to the oil & gas processing seals market during the forecast period.
The growth of the segment is mainly attributed to the increased use of oil & gas processing seals because of their ability to sustain high pressure and temperature. These seals are designed for both static and dynamic applications. The distortion of the double seal helps in preventing the leakage, thus creating a seal.The above-mentioned factors are responsible for driving the demand for oil & gas processing seals during the forecast period.
By material, the metals segment is expected to be the largest contributor to the oil & gas processing seals market during the forecast period.
Metal-based oil & gas processing seals are used for high-temperature applications. Metal-based seals eliminate permeation problems and can handle an extremely wide range of temperatures and pressures. These are used in extreme environmental conditions to provide protection against corrosion, cryogenic conditions, chemical resistance, and radiation. The above-mentioned factors will drive the market during the forecast period.
By application, the downstream segment is projected to be the largest contributor to the oil & gas processing seals market during the forecast period.
The downstream segment is projected to lead the oil & gas processing seals market, the growth in this segment is attributed to increasing usage of seals in the refining of crude oil and the processing & purifying of natural gas at oil refineries and petrochemical plants. Furthermore, it helps in marketing and distribution of products. These services help in making crude oil into various usable products such as gasoline, fuel oils, and petroleum-based products.
Asia Pacific is expected to fastest-growing market during the forecast period.
The oil & gas processing seals market has been studied for Asia Pacific, North America, Europe, South America, and the Middle East & Africa. The Asia Pacific oil & gas processing seals market is projected to register the highest CAGR during the forecast period, in terms of value. The Middle East & Africa accounted for the largest market share during the forecast period in terms of value. The downstream application is expected to dominate the oil & gas processing seals market during the forecast period due to the increase in the number of manufacturing facilities and technological advancement in this region. This creates an immense opportunity for the consumption of oil & gas processing seals in the region.
Key Market Players
Companies such as Freudenberg Group (Germany), John Crane (US), Flowserve Corporation (US), Parker Hannifin Corp (US), Solenis (US), Saint-Gobain (France), Trelleborg AB (Sweden), DuPont (US), Precision Polymer Engineering (UK), M. Barnwell Services Limited (UK), and Techno AD Ltd (Israel) are the leading players in the oil & gas processing seals market, globally. Diversified product portfolio, high depth in application reach, and technical assistance to customers are factors responsible for strengthening the position of these companies in the oil & gas processing seals market. They have also been adopting various organic growth strategies such as expansion and new product launch to enhance their current position in the oil & gas processing seals market.
Scope of the Report:
Report Metric |
Details |
|
Market size available for years |
2016�2023 |
|
Base year |
2017 |
|
Forecast period |
2018�2023 |
|
Units considered in the report |
Value (USD Billion) |
|
Segments |
Type, Material, Application,and Region |
|
Geographies |
North America, APAC, Europe, Middle East & Africa, and South America |
|
Companies |
Freudenberg Group (Germany), John Crane (US), Flowserve Corporation (US), Parker Hannifin Corp (US), Solenis (US), Saint-Gobain (France), Trelleborg AB (Sweden), DuPont (US), Precision Polymer Engineering (UK), M. Barnwell Services Limited (UK) and Techno AD Ltd (Israel) |
This report categorizes the oil & gas processing seals market based on type, material, application, and region.
Oil & Gas Processing Seals Market, by Type:
- Single Seal
- Double Seal
Oil & Gas Processing Seals Market, by Material:
- Metals
- Elastomer
- Face Materials
- Others (Thermoplastics, Rubber)
Oil & Gas Processing Seals Market, by Application:
- Upstream
- Midstream
- Downstream
Oil & Gas Processing Seals Market, by Region:
- APAC
- North America
- Europe
- South America
- Middle East & Africa
Recent Developments
- In December 2015, Dupont launched Kalrez Spectrum 6380 perfluoroelastomer seal that offers high resistance to oxidizers and amines in gas sweetening process in the oil & gas industry. The company aims to protect metal equipment for corrosion and wear & tear and increase the reliability.
Key questions addressed by the report
- Which are the future revenue pockets in the oil & gas processing seals market?
- Which key developments are expected to have a high impact on the oil & gas processing seals market?
- Which product technologies are expected to overpower the existing technologies?
- How is the regulations scenario further expected to impact the market?
- What will be the future product mix of the oil & gas processing seals market?
- What are the prime strategies of leaders in the oil & gas processing seals market?
To speak to our analyst for a discussion on the above findings, click Speak to Analyst
 Exclusive indicates content/data unique to MarketsandMarkets and not available with any competitors.
Table of Contents
1 Introduction (Page No. - 15)
1.1 Objectives of the Study
1.2 Market Definition
1.3 Market Scope
1.3.1 Regions Covered
1.3.2 Years Considered for the Study
1.4 Currency
1.5 Stakeholders
2 Research Methodology (Page No. - 18)
2.1 Research Data
2.1.1 Secondary Data
2.1.1.1 Key Data From Secondary Sources
2.1.2 Primary Data
2.1.2.1 Key Data From Primary Sources
2.1.2.2 Key Industry Insights
2.1.2.3 Breakdown of Primary Interviews
2.2 Market Size Estimation
2.3 Data Triangulation
2.4 Assumptions and Limitations
2.4.1 Assumptions
2.4.2 Limitations
3 Executive Summary (Page No. - 25)
4 Premium Insights (Page No. - 28)
4.1 Attractive Opportunities in the Oil & Gas Processing Seals Market
4.2 Oil & Gas Processing Seals Market, By Region
4.3 Oil & Gas Processing Seals Market, By Type and Region
4.4 Oil & Gas Processing Seals Market, By Application
4.5 Oil & Gas Processing Seals Market, By Type
4.6 Oil & Gas Processing Seals Market: Major Countries
5 Market Overview (Page No. - 31)
5.1 Introduction
5.2 Market Dynamics
5.2.1 Drivers
5.2.1.1 Increased Efficiency in Offshore Oil Recovery
5.2.1.2 Increasing Crude Oil Production
5.2.2 Restraints
5.2.2.1 Gland Packaging and Seal-Less Pumps
5.2.2.2 Growth in the Renewable Energy Sector
5.2.2.3 Low Oil & Gas Prices
5.2.3 Opportunities
5.2.3.1 Discovery of New Oilfields
5.2.4 Challenges
5.2.4.1 Specific Requirements From End-Use Industries
5.3 Porter�s Five Forces Analysis
5.3.1 Threat of New Entrants
5.3.2 Threat of Substitutes
5.3.3 Bargaining Power of Suppliers
5.3.4 Bargaining Power of Buyers
5.3.5 Intensity of Competitive Rivalry
5.4 Macroeconomic Overview
5.4.1 Manufacturing Industry Trends and Forecast, By Country
5.5 Oil & Gas Wells, By Region (2016)
5.6 Crude Oil Throughput By Region, 2016 (In 1000 Bpd)
5.6.1 Oil & Gas Industry Trends, By Region and Country
6 Oil & Gas Processing Seals Market, By Material (Page No. - 43)
6.1 Introduction
6.2 Metal
6.2.1 Strong Physical and Chemical Properties are Expected to Drive the Demand for Metals in the Oil & Gas Processing Seals Market
6.3 Elastomer
6.3.1 Oil & Gas Processing Seals Based on Elastomer are Used in Different Applications in the Oil & Gas Industry
6.4 Seal Face Material
6.4.1 Excellent Mechanical Properties of Seal Face Material Drive Its Demand in the Oil & Gas Processing Seals Market
6.5 Others
7 Oil & Gas Processing Seals Market, By Type (Page No. - 47)
7.1 Introduction
7.2 Single Seal
7.2.1 Single Oil & Gas Processing Seals are Widely Used for their Cost and Energy Saving Properties
7.3 Double Seal
7.3.1 Double Oil & Gas Processing Seals Ensure Maximum Sealing and Minimum Leakage of Fluid Or Gas
8 Oil & Gas Processing Seals Market, By Application (Page No. - 51)
8.1 Introduction
8.2 Upstream
8.2.1 High-Temperature Resistance and Durability are the Properties of Oil & Gas Processing Seals That are Driving their Demand in This Segment
8.3 Midstream
8.3.1 Growing Midstream Oil & Gas Sector is Likely to Drive the Demand for Oil & Gas Processing Seals
8.4 Downstream
8.4.1 Downstream is A Key Application of Oil & Gas Processing Seals
9 Oil & Gas Processing Seals Market, By Region (Page No. - 55)
9.1 Introduction
9.2 North America
9.2.1 US
9.2.1.1 Growing Offshore and Onshore Drilling Activities are Expected to Drive the US Market for Oil & Gas Processing Seals
9.2.2 Canada
9.2.2.1 Increasing Investments in the Oil & Gas Industry in Canada are Boosting the Oil & Gas Processing Seals Market
9.2.3 Mexico
9.2.3.1 Growing Upstream Oil & Gas Sector is Likely to Drive the Market for Oil & Gas Processing Seals
9.3 Middle East & Africa
9.3.1 Saudi Arabia
9.3.1.1 Presence of the World�s Largest Petroleum Reserves has Boosted the Oil & Gas Processing Seals Market in Saudi Arabia
9.3.2 Iran
9.3.2.1 Increasing Crude Oil Processing Capacities Drive the Oil & Gas Processing Seals Market in Iran
9.3.3 UAE
9.3.3.1 Growing Oil Production Drives the Market for Oil & Gas Processing Seals in the UAE
9.3.4 Rest of Middle East & Africa
9.4 APAC
9.4.1 China
9.4.1.1 Presence of Large Oilfields and Drilling in New Reserves are Driving the Market
9.4.2 India
9.4.2.1 Major Oilfield Discoveries are Expected to Boost the Market in India
9.4.3 Indonesia
9.4.3.1 Increase in Investment in Oil Exploration Activities is Projected to Drive the Market
9.4.4 Malaysia
9.4.4.1 Increase in Refining and Storage CAPACity is Expected to Propel the Oil & Gas Processing Seals Market
9.4.5 Australia
9.4.5.1 Increase in Oil & Gas Production is Expected to Drive the Demand for Oil & Gas Processing Seals
9.4.6 Rest of APAC
9.5 Europe
9.5.1 Russia
9.5.1.1 Exploration of Oil and Gas Reserves in the Country Boosts the Demand for Oil & Gas Processing Seals
9.5.2 UK
9.5.2.1 Drilling, Well Completion, and Production are Expected to Generate A Demand for Oil & Gas Processing Seals in the UK
9.5.3 Netherlands
9.5.3.1 Growing Shale Gas Industry is Expected to Drive the Country�s Oil & Gas Processing Seals Market
9.5.4 Norway
9.5.4.1 New Offshore Discoveries Govern the Oil & Gas Processing Seals Market in Norway
9.5.5 Poland
9.5.5.1 Growing Investments in Technology and Innovation in the Oil & Gas Industry Drive the Oil & Gas Processing Seals Market
9.5.6 Rest of Europe
9.6 South America
9.6.1 Brazil
9.6.1.1 Increasing Exploration and Discovery of Undersea Oilfields are Likely to Propel the Oil & Gas Processing Seals Market in Brazil
9.6.2 Venezuela
9.6.2.1 Presence of Abundant Oil Fields Drives the Market for Oil & Gas Processing Seals in Venezuela
9.6.3 Rest of South America
10 Competitive Landscape (Page No. - 82)
10.1 Introduction
10.2 Market Ranking of Key Players
10.3 Competitive Scenario
10.3.1 New Product Launch
10.3.2 Expansion
11 Company Profiles (Page No. - 85)
(Business Overview, Products Offered, Recent Developments, SWOT Analysis, MnM View)*
11.1 Freudenberg Group
11.2 John Crane
11.3 Flowserve Corporation
11.4 Parker Hannifin Corp
11.5 Saint-Gobain
11.6 Trelleborg AB
11.7 Dupont
11.8 Precision Polymer Engineering
11.9 Techno AD Ltd.
11.10 M.Barnwell Services Limited
11.11 Precision Associates, Inc.
11.12 Green, Tweed & Company
*Details on Business Overview, Products Offered, Recent Developments, SWOT Analysis, MnM View Might Not Be Captured in Case of Unlisted Companies.
11.13 Ftl Technology
11.14 Aesseal PLC.
11.15 Technetics Group
11.16 Performance Sealing Inc.
11.17 Ceetak Ltd.
11.18 American High Performance Seals
12 Appendix (Page No. - 110)
12.1 Discussion Guide
12.2 Knowledge Store: Marketsandmarkets� Subscription Portal
12.3 Available Customizations
12.4 Related Reports
12.5 Author Details
List of Tables (63 Tables)
Table 1 Contribution of Manufacturing Industry to Gdp, By Country, 2015-2021 (USD Billion)
Table 2 North America: Oil & Gas Wells, By Country (2016)
Table 3 Middle East & Africa: Oil & Gas Wells, By Country (2016)
Table 4 APAC: Oil & Gas Wells, By Country (2016)
Table 5 Europe: Oil & Gas Wells, By Country (2016)
Table 6 South America: Oil & Gas Wells, By Country (2016)
Table 7 North America: Crude Oil Throughput, By Country, 2016 (1000 Bpd)
Table 8 South America: Crude Oil Throughput, By Country, 2016 (1000 Bpd)
Table 9 Middle East & Africa: Crude Oil Throughput, By Country, 2016 (1000 Bpd)
Table 10 APAC: Crude Oil Throughput, By Country, 2016 (1000 Bpd)
Table 11 Europe: Crude Oil Throughput, By Country, 2016 (1000 Bpd)
Table 12 Oil Production, Million Tonnes (2014-2015)
Table 13 Oil & Gas Processing Seals Market Size, By Material, 2016�2023 (USD Million)
Table 14 Oil & Gas Processing Seals Market Size, By Type, 2016�2023 (USD Million)
Table 15 Single Oil & Gas Processing Seals Market Size, 2016�2023 (USD Million)
Table 16 Double Oil & Gas Processing Seals Market Size, 2016�2023 (USD Million)
Table 17 Oil & Gas Processing Seals Market Size, By Application, 2016�2023 (USD Million)
Table 18 Oil & Gas Processing Seals Market Size in Upstream Application, By Region, 2016�2023 (USD Million)
Table 19 Oil & Gas Processing Seals Market Size in Midstream Application, By Region, 2016�2023 (USD Million)
Table 20 Oil & Gas Processing Seals Market Size in Downstream Application, By Region, 2016�2023 (USD Million)
Table 21 Oil & Gas Processing Seals Market Size, By Region, 2016�2023 (USD Million)
Table 22 Oil & Gas Processing Seals Market Size, By Material, 2016�2023 (USD Million)
Table 23 Oil & Gas Processing Seals Market Size, By Type, 2016�2023 (USD Million)
Table 24 Oil & Gas Processing Seals Market Size, By Application, 2016�2023 (USD Million)
Table 25 North America: Oil & Gas Processing Seals Market Size, By Country, 2016�2023 (USD Million)
Table 26 North America: Oil & Gas Processing Seals Market Size, By Type, 2016�2023 (USD Million)
Table 27 North America: Oil & Gas Processing Seals Market Size, By Application, 2016�2023 (USD Million)
Table 28 US: Oil & Gas Processing Seals Market Size, By Application, 2016�2023 (USD Million)
Table 29 Canada: Oil & Gas Processing Seals Market Size, By Application, 2016�2023 (USD Million)
Table 30 Mexico: Oil & Gas Processing Seals Market Size, Application, 2016�2023 (USD Million)
Table 31 Middle East & Africa: Oil & Gas Processing Seals Market Size, By Country, 2016�2023 (USD Million)
Table 32 Middle East & Africa: Oil & Gas Processing Seals Market Size, By Type, 2016�2023 (USD Million)
Table 33 Middle East and Africa: Oil & Gas Processing Seals Market Size, By Application, 2016�2023 (USD Million)
Table 34 Saudi Arabia: Oil & Gas Processing Seals Market Size, By Application, 2016�2023 (USD Million)
Table 35 Iran: Oil & Gas Processing Seals Market Size, By Application, 2016�2023 (USD Million)
Table 36 UAE: Oil & Gas Processing Seals Market Size, By Application, 2016�2023 (USD Million)
Table 37 Rest of Middle East & Africa: Oil & Gas Processing Seals Market Size, By Application, 2016�2023 (USD Million)
Table 38 APAC: Oil & Gas Processing Seals Market Size, By Country, 2016�2023 (USD Million)
Table 39 APAC: Oil & Gas Processing Seals Market Size, By Type, 2016�2023 (USD Million
Table 40 APAC: Oil & Gas Processing Seals Market Size, By Application, 2016�2023 (USD Million)
Table 41 China: Oil & Gas Processing Seals Market Size, By Application, 2016�2023 (USD Million)
Table 42 India: Oil & Gas Processing Seals Market Size, By Application, 2016�2023 (USD Million)
Table 43 Indonesia: Oil & Gas Processing Seals Market Size, By Application, 2016�2023 (USD Million)
Table 44 Malaysia: Oil & Gas Processing Seals Market Size, By Application, 2016�2023 (USD Million)
Table 45 Australia: Oil & Gas Processing Seals Market Size, By Application, 2016�2023 (USD Million)
Table 46 Rest of APAC: Oil & Gas Processing Seals Market Size, By Application, 2016�2023 (USD Million)
Table 47 Europe: Oil & Gas Processing Seals Market Size, By Country, 2016�2023 (USD Million)
Table 48 Europe: Oil & Gas Processing Seals Market Size, By Type, 2016�2023 (USD Million)
Table 49 Europe: Oil & Gas Processing Seals Market Size, By Application, 2016�2023 (USD Million)
Table 50 Russia: Oil & Gas Processing Seals Market Size, By Application, 2016�2023 (USD Million)
Table 51 UK: Oil & Gas Processing Seals Market Size, By Application, 2016�2023 (USD Million)
Table 52 Netherlands: Oil & Gas Processing Seals Market Size, Application, 2016�2023 (USD Million)
Table 53 Norway: Oil & Gas Processing Seals Market Size, By Application, 2016�2023 (USD Million)
Table 54 Poland: Oil & Gas Processing Seals Market Size, By Application, 2016�2023 (USD Million)
Table 55 Rest of Europe: Oil & Gas Processing Seals Market Size, Application, 2016�2023 (USD Million)
Table 56 South America: Oil & Gas Processing Seals Market Size, By Country, 2016�2023 (USD Million)
Table 57 South America: Oil & Gas Processing Seals Market Size, By Type, 2016�2023 (USD Million)
Table 58 South America: Oil & Gas Processing Seals Market Size, By Application, 2016�2023 (USD Million)
Table 59 Brazil: Oil & Gas Processing Seals Market Size, By Application, 2016�2023 (USD Million)
Table 60 Venezuela: Oil & Gas Processing Seals Market Size, By Application, 2016�2023 (USD Million)
Table 61 Rest of South America: Oil & Gas Processing Seals Market Size, By Application, 2016�2023 (USD Million)
Table 62 New Product Launch, 2015�2018
Table 63 Expansion, 2015�2018
List of Figures (40 Figures)
Figure 1 Oil & Gas Processing Seals Market Segmentation
Figure 2 Oil & Gas Processing Seals Market, By Region
Figure 3 Oil & Gas Processing Seals Market: Research Design
Figure 4 Bottom-Up Approach
Figure 5 Top-Down Approach
Figure 6 Oil & Gas Processing Seals Market: Data Triangulation
Figure 7 Metal Segment to Lead the Oil & Gas Processing Seals Market
Figure 8 Single Seal to Be the Largest Type of Oil & Gas Processing Seals
Figure 9 Downstream Application to Lead the Oil & Gas Processing Seals Market
Figure 10 APAC to Be the Fastest-Growing Oil & Gas Processing Seals Market
Figure 11 Increase in Oil Production and Downstream Activities to Drive the Market Between 2018 and 2023
Figure 12 Middle East & Africa to Lead the Oil & Gas Processing Seals Market
Figure 13 Single Seal Type Accounted for the Largest Share of the Oil & Gas Processing Seals Market
Figure 14 Downstream Segment to Account for the Largest Share of the Oil & Gas Processing Seals Market
Figure 15 Single Seal Segment to Account for the Largest Share of the Overall Oil & Gas Processing Seals Market
Figure 16 India to Grow at the Fastest Rate
Figure 17 Drivers, Restraints, Opportunities, and Challenges Governing the Oil & Gas Processing Seals Market
Figure 18 Oil & Gas Processing Seals Market: Porters Five Forces Analysis
Figure 19 Metal Segment to Dominate the Oil & Gas Processing Seals Market
Figure 20 Single Seal to Be the Largest Type of Oil & Gas Processing Seals
Figure 21 Downstream Segment to Dominate the Oil & Gas Processing Seals Market Between 2018 and 2023
Figure 22 India to Grow at the Highest Rate
Figure 23 North America: Oil & Gas Processing Seals Market Snapshot
Figure 24 Middle East & Africa: Oil & Gas Processing Seals Market Snapshot
Figure 25 APAC: Oil & Gas Processing Seals Market Snapshot
Figure 26 Key Developments in the Oil & Gas Processing Seals Market (2015�2018)
Figure 27 Ranking of Oil & Gas Processing Seals Manufacturers in 2017
Figure 28 Freudenberg Group: Company Snapshot
Figure 29 Freudenberg Group: SWOT Analysis
Figure 30 John Crane: SWOT Analysis
Figure 31 Flowserve Corporation: Company Snapshot
Figure 32 Flowserve Corporation: SWOT Analysis
Figure 33 Parker Hannifin Corp: Company Snapshot
Figure 34 Parker Hannifin Corp: SWOT Analysis
Figure 35 Saint-Gobain: Company Snapshot
Figure 36 Saint-Gobain: SWOT Analysis
Figure 37 Trelleborg AB: Company Snapshot
Figure 38 Trelleborg AB: SWOT Analysis
Figure 39 Dupont: Company Snapshot
Figure 40 Dupont: SWOT Analysis
The study involved four major activities in estimating the current market size for oil & gas processing seals. Exhaustive secondary research was done to collect information on the market, the peer market, and the parent market. The next step was to validate these findings, assumptions, with industry experts across the value chain through primary research. Both top-down and bottom-up approaches were employed to estimate the complete market size. Thereafter, market breakdown and data triangulation were used to estimate the market size of segments and subsegments.
Secondary Research
In the secondary research process, various secondary sources such as Hoovers, Bloomberg BusinessWeek, and Dun & Bradstreet have been referred to, so as to identify and collect information for this study. These secondary sources include annual reports, press releases & investor presentations of companies, whitepapers, certified publications, articles by recognized authors, gold standard & silver standard websites, associations, regulatory bodies, trade directories, and databases.
Primary Research
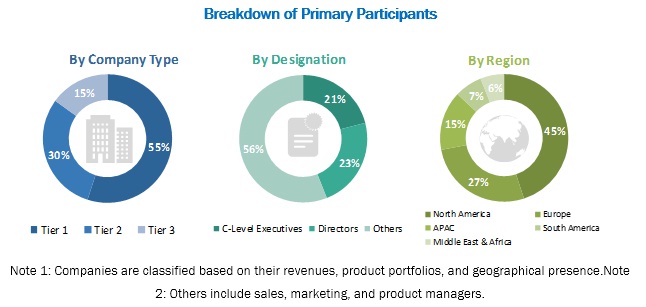
The oil & gas processing seals market comprises several stakeholders such as raw material suppliers, end product manufacturers, and regulatory organizations in the supply chain. The demand side of this market is characterized by the developments in the oil & gas industry. The supply side is characterized by market consolidation activities undertaken by oil & gas producers. Various primary sources from both supply and demand sides of the market were interviewed to obtain qualitative and quantitative information. Following is the breakdown of primary respondents:
To know about the assumptions considered for the study, download the pdf brochure
Market Size Estimation:
Both top-down and bottom-up approaches were used to estimate and validate the total size of the oil & gas processing seals market. These methods were also used extensively to estimate the size of various subsegments in the market. The research methodology used to estimate the market size includes the following:
- The key players in the industry and markets have been identified through extensive secondary research.
- The industry�s supply chain and market size, in terms of value, have been determined through primary and secondary research processes.
- All percentage shares, splits, and breakdowns have been determined using secondary sources and verified through primary sources.
Data Triangulation:
After arriving at the overall market size-using the market size estimation processes as explained above-the market was split into several segments and subsegments. In order to complete the overall market engineering process and arrive at the exact statistics of each market segment and sub-segment, the data triangulation and market breakdown procedures were employed, wherever applicable. The data was triangulated by studying various factors and trends from both, the demand and supply sides, in the oil & gas industry.Report Objectives:
- To define, describe, and analyze the oil & gas processing seals market based on type, material, application, and region
- To forecast and analyze the size of the oil & gas processing seals market (in terms of value) in five key regions, namely, Asia Pacific, North America, Europe, South America, and the Middle East & Africa
- To forecast and analyze the oil & gas processing seals market at the country level in each region
- To strategically analyze each submarket with respect to the individual growth trends and its contribution to the overall oil & gas processing seals market
- To analyze the drivers in the oil & gas processing seals market for the stakeholders by identifying high-growth segments of the market
- To identify significant market trends and factors driving or inhibiting the growth of the oil & gas processing seals market and its submarkets
- To strategically profile the key players in the oil & gas processing seals market and comprehensively analyze their growth strategies
Available Customizations
With the given market data, MarketsandMarkets offers customizations according to the specific needs of companies. The following customization options are available for the report:
Regional Analysis
- A further breakdown of the regional oil & gas processing seals market to the country level with additional material and/or types
Country Information
- Additional country information (up to 3)
Company Information
- Detailed analysis and profiles of additional market players (up to 5)


Growth opportunities and latent adjacency in Oil & Gas Processing Seals Market