On-Orbit Satellite Servicing Market Size, Share, Trends & Growth Analysis by Service (Active Debris Removal (ADR) and Orbit Adjustment, Robotic Servicing, Refueling, Assembly), Type (Small Satellite (<500 KG), Medium Satellite (501-1000 KG), Large Satellite (>1000 KG), End User, Orbit, and Region - Global Forecast to 2030
Update:: 16.10.24
On-Orbit Satellite Servicing Market Size & Share:
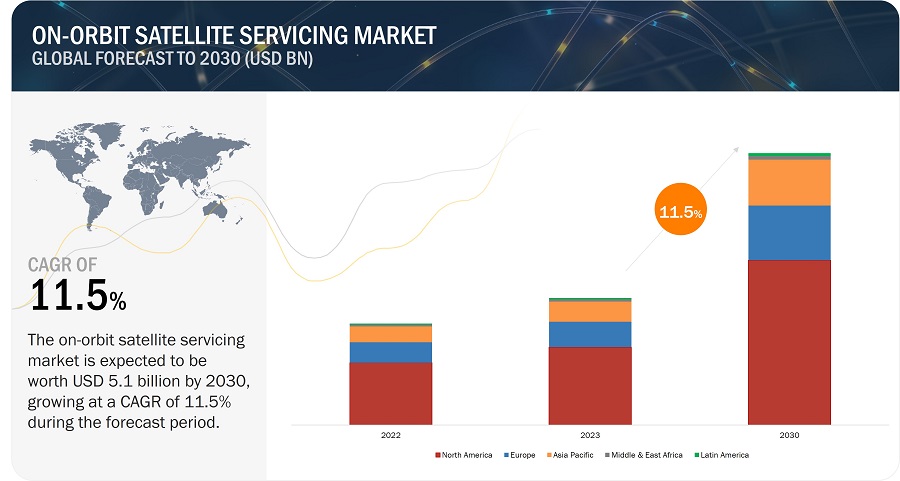
The on-orbit satellite servicing market is estimated to be USD 2.4 billion in 2023 and is projected to reach USD 5.1 billion by 2030, growing at a CAGR of 11.5% from 2023 to 2030. The market is driven by factors such as different value chain levels for vendors, increased use of dedicated satellite servicing mission extension vehicles, among others.
On-Orbit Satellite Servicing Market Forecast to 2030
To know about the assumptions considered for the study, Request for Free Sample Report
On-orbit satellite servicing Market Dynamics:
Drivers: Space debris mitigation
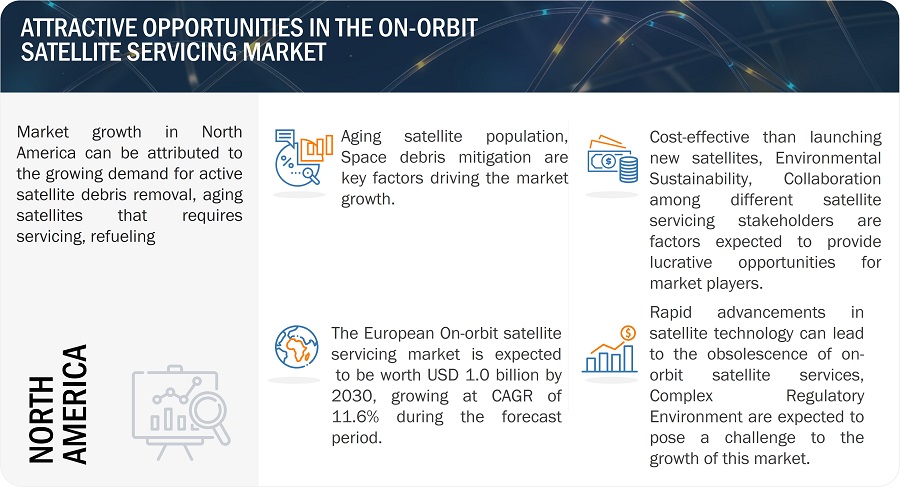
The demand for on-orbit services is increasing as space debris continues to pile up and the threat for operational satellite increases. On-orbit satellite services like debris removal and collision avoidance are necessary to assure safety and performance since space debris has the potential to damage or kill satellites. The need for space debris to be mitigated is projected to spur the on-orbit satellite servicing market. A growing trend for space debris mitigation will drive the on-orbit satellite services market. Space debris consists of the wreckage and non-functional spacecraft that inhabit space, including defunct and broken-up satellites, discarded upper stages from launch vehicles, and numerous other pieces of debris. The increased amount of space debris in orbit around the earth presents a seriously significant threat to spacecraft and satellites in orbit and can damage or destroy the spacecraft or satellites; therefore, on-orbit satellites service providers will develop new technology and solutions for space debris tracking, mitigation, and removal.
Ground-based and in-orbit sensors are used in debris monitoring and tracking to adjust according to space particle trajectories. With the use of this data, collision risks can be reduced and avoidance strategies can be developed. One type of debris avoidance maneuver involves modifying a satellite's orbit to steer clear of anticipated debris collisions. In addition to avoidance maneuvers, on-orbit satellite service carriers are developing new systems for debris elimination. It uses robotics technology to seize and put off space debris, decreasing the threat of collisions and the amount of particles in orbit.
As the number of satellites and spacecraft in orbit continues to grow, the need for effective debris mitigation solutions will increase. On-orbit satellite service providers that offer effective and reliable space debris mitigation solutions will be well-positioned to meet the growing demand for these services.
Restraints: Technological complexity
The on-orbit satellite servicing market, which includes life extension, salvage operations, and satellite repair and alteration, faces technological complexity as a significant restraint. Providing on-orbit satellite services requires advanced technology and specialized expertise, which can be expensive to develop and maintain. In many cases, these services require highly skilled personnel, specialized equipment, and software. For example, repairing or altering a satellite in orbit requires precise control of robotic arms, specialized tools, and communication systems.
Moreover, the technology required to provide on-orbit satellite services is constantly evolving, and companies need to invest heavily in R&D to stay competitive. This can create a high barrier for new companies looking to enter the market. In addition, on-orbit satellite services may be subject to unique technical challenges, such as operating in a zero-gravity environment, managing the effects of radiation and temperature extremes, and managing the logistics of servicing satellites that are often in different orbits and locations.
Companies need to have the resources and expertise to develop and maintain advanced technology, as well as the ability to adapt to new technical challenges as they arise.
Opportunities: Collaboration among different stakeholders
The on-orbit satellite servicing market presents opportunities for collaboration among different stakeholders in the space industry. On-orbit satellite providers collaborate with satellite operators to perceive the specific needs in their satellite networks and expand custom designed answers that meet the needs. This collaboration optimizes satellite performance and reduce expenses. Collaboration among on-orbit service companies and satellite producers focuses on growing technology and services which might be well suited with new satellite designs, that help on-orbit service providers can maintain pace with technological improvements. Similarly, the partnership with launch vendors targets to integrate satellite services seamlessly into the launch process, lowering the time and value related to deploying on-orbit satellite offerings. On-orbit satellite service carriers’ collaboration with regulatory bodies will ensure that their services comply with regulations and promote safety and sustainability in space activities. It will help to establish clear guidelines and standards for on-orbit satellite services. By working collectively, the stakeholders can optimize satellite performance, lessen charges, and promote safety and sustainability in space activities.
Challenges: Rapid advancement in satellite technology to lead to obsolescence of on-orbit satellite services
Rapid advancements in satellite technology can lead to the obsolescence of on-orbit satellite services, particularly for older satellites. Service providers may need to adapt quickly to keep pace with changing technologies. The pace of technological change in the satellite industry can be rapid, with new technologies emerging and existing technologies becoming obsolete at a fast pace. This can make it challenging for on-orbit satellite service providers to keep up with the latest developments and ensure that their services remain relevant and effective. As technology changes, so do regulatory requirements for satellite operators. On-orbit satellite service providers may need to stay up to date on these requirements and adapt their services to ensure compliance with changing regulations. Technological obsolescence can impact the quality of on-orbit satellite services, as older technologies may be less reliable or less effective than newer technologies. Service providers may need to invest in new technologies to maintain the quality of their services, which can be costly.
On-Orbit Satellite Servicing Market Ecosystem
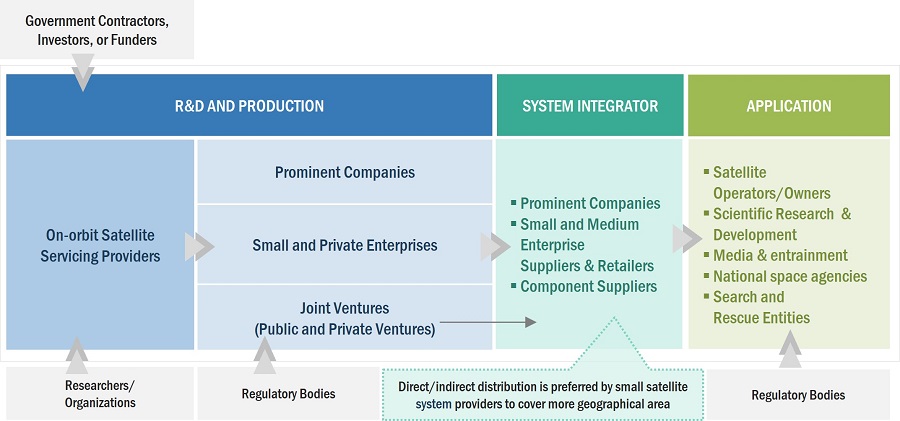
Raw material suppliers, component manufacturers, simulator manufacturers, distributors, and end users such as satellite manufacturers and government space agencies are key stakeholders in the on-orbit satellite servicing market ecosystem. Investors, funders, academic researchers, integrators, service providers, and licensing authorities serve as major influencers in the market. The strategy of securing contracts was widely adopted by leading players, such as Maxar Technologies (US), Astroscale Holdings Inc. (Japan), SpaceLogistics LLC (US), Airbus SE (Netherlands), and Thales Alenia Space (France) to enhance their presence in the market.
Based on Service, the Active Debris Removal (ADR) and Orbit Adjustment segment is projected to lead the on-orbit satellite servicing market during the forecast period
Active Debris Removal (ADR) technologies are designed to effectively capture and eliminate space debris in orbit, either by safely deorbiting it back to Earth or relocating it to a graveyard orbit where it poses no threat to other spacecraft. Various approaches exist for ADR, including the use of robotic arms, nets, tethers, and harpoons to capture and remove debris.
ADR offers numerous benefits, foremost among them being the reduction of collisions between spacecraft and space debris. By actively removing debris, ADR helps to minimize the amount of hazardous material present in orbit, thereby enhancing the safety and sustainability of space operations. However, ADR is a highly intricate and challenging task that demands advanced technologies and substantial resources. Additionally, it raises important legal and ethical considerations, such as establishing responsibility for debris cleanup and implementing measures to prevent the generation of new debris in the future.
Currently, multiple companies and organizations, including Astroscale (Japan), ClearSpace (US), and Northrop Grumman Corporation (US), are actively engaged in developing ADR technologies. Furthermore, governments worldwide are exploring policy and regulatory frameworks to address the issue of space debris and promote the adoption of ADR technologies.
Based on End User, the commercial segment is projected to grow at the highest CAGR in the on-orbit satellite servicing market during the forecast period
The market for commercial on-orbit satellite servicing is rapidly evolving, providing a range of valuable capabilities to commercial satellite operators. These services include in-orbit refueling, repairs, upgrades, and maintenance for satellites. Leading companies such as SpaceLogistics (US) and Astroscale (Japan) are actively involved in this market, developing advanced technologies like robotic arms, fluid transfer systems, and sensors to ensure safe and efficient servicing of satellites in orbit.
The primary advantage of commercial on-orbit satellite servicing lies in its potential to significantly extend the operational lifespan of commercial satellites. By offering services that enhance longevity, operators can continue generating revenue from their satellites for an extended period. This approach also reduces the need for costly and risky satellite replacements, while enabling operators to adapt their existing satellites to match technological advancements and market demands.
Overall, the commercial on-orbit satellite servicing market is poised for rapid growth as more satellite operators recognize the value of maximizing their space assets' utility and profitability through these services.
Based on Type, the large satellite segment is projected to grow at the highest CAGR in the on-orbit satellite servicing market during the forecast period
The market for on-orbit satellite servicing for large satellites involves the upkeep, repair, and upgrade of satellites with complex subsystems and sophisticated payloads. Large satellites, on which communications, Earth observation science missions rely upon, require extreme levels of operational management to extend their operational lifetime and optimize capabilities. Due to the potentially long operational life and operating environment of space, there is an increased attention to on-orbit maintenance and upgrades. These on-orbit maintenance and upgrade service will guarantee ongoing mission functionality and reliability for missions that may encounter issues such as component failure, system malfunction, positional changes to improve performance and extend mission life expectancy.
Based on Orbit, the low earth orbit (LEO) segment is projected to grow at the highest CAGR in the on-orbit satellite servicing market during the forecast period
The Low Earth Orbit (LEO) segment of the on-orbit satellite service industry is driven by the increasing number of satellites being deployed for communications, earth observation, and research purpose. The dense satellite presence in LEO requires advanced service solutions to control traffic, limit collision threats, and successfully manage debris. The need for offerings which can lengthen satellite existence and improve performance is similarly highlighted through the emergence of tiny satellite constellations. As regulations evolve and technology advances—especially in robotics—new opportunities and challenges are shaping this market. Players in the industry are encouraged to collaborate strategically and innovate technologically in this market.
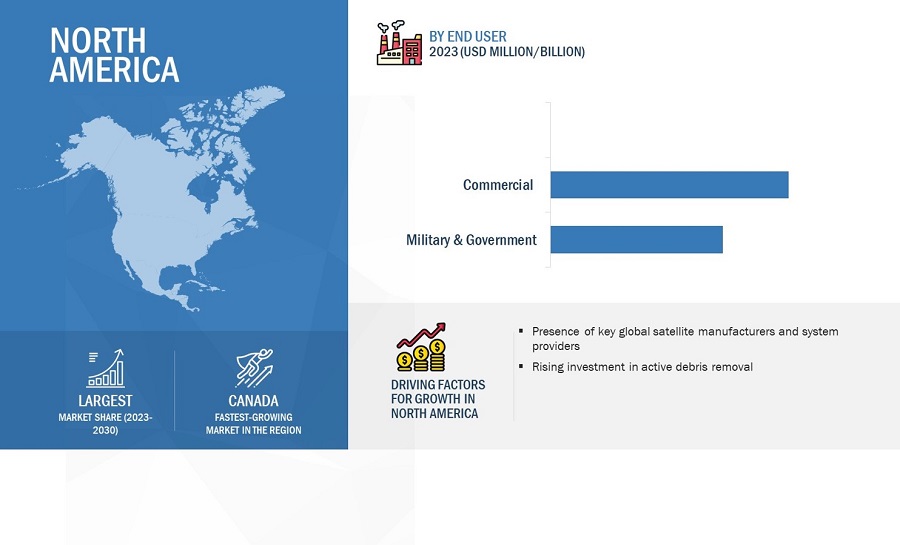
North America is expected to account for the largest share in the forecasted period .
The on-orbit satellite servicing market in North America is a vibrant and rapidly expanding sector that encompasses a diverse range of activities focused on servicing and maintaining satellites in orbit. This market involves the collaboration of government agencies, private companies, and research institutions, all contributing to the development, deployment, and commercialization of on-orbit satellite servicing technologies and services.
North America, particularly the United States, is at the forefront of on-orbit satellite servicing initiatives. NASA has played a pivotal role in advancing this field through programs like the NASA Satellite Servicing Capabilities Office (SSCO), which concentrates on developing cutting-edge technologies such as robotic systems, tools, and spacecraft rendezvous and docking capabilities.
Private companies in North America have also emerged as significant players in the on-orbit satellite servicing market. These companies offer an array of services including satellite refueling, repairs, upgrades, and maintenance. Notable examples include SpaceLogistics (US), specializing in satellite life extension services, and Northrop Grumman Corporation (US), which provides satellite servicing and robotic capabilities.
The North American market benefits from a robust aerospace and technology industry, strong research and development capabilities, and a supportive regulatory environment. The increasing demand from satellite operators to maximize the lifespan of their assets, reduce costs associated with satellite replacements, and adapt to evolving market needs through upgrades and modifications drives the market's growth.
Europe is expected to account for the second largest share in the forecasted period.
The growing demand for satellite extension missions, debris removal, and an increasing number of aged satellites are some of the major driving factors in the European on-orbit satellite servicing market. This is supported by rising investment in the space technology segment by both government and private players, along with advancements in robotics and autonomous systems, which enables significant growth in the market. Strategic investments by European Space Agency in technologies for autonomous docking and robotic servicing, as in the ADRIOS mission, further add to the growth in this region.
Asia Pacific is expected to account for the third largest share in the forecasted period.
The on-orbit satellite-servicing market growth in Asia-Pacific is attributed to the increasing satellite deployment into orbit to meet the demand for communication, earth observation, and navigation services. The increased capability to service on-orbit satellites are now enabled through recent technological advancements in robotics and AI, strengthened by major government investments in space programs of countries such as China, India, and Japan. With this increased sense of awareness of space debris and the need for sustainable operations, there is a growing adoption of servicing solutions to mitigate collision risks. Emerging players, especially in South Korea, further support the growth of the market in this region.
On-Orbit Satellite Servicing Market by Region
To know about the assumptions considered for the study, download the pdf brochure
Key Market Players
Players such as Maxar Technologies (US), Astroscale Holdings Inc. (Japan), SpaceLogistics LLC (US), Airbus SE (Netherlands), and Thales Alenia Space (France). The report covers various industry trends and new technological innovations in the on-orbit satellite servicing’ market for the period, 2019-2030.
Scope of the Report
|
Report Metric |
Details |
|
Estimated Market Size |
USD 2.4 Billion in 2023 |
|
Projected Market Size |
USD 5.1 Billion by 2030 |
|
CAGR |
11.5% |
|
Market Size Available for Years |
2019–2030 |
|
Base Year Considered |
2022 |
|
Forecast Period |
2023–2030 |
|
Forecast Units |
Value (USD Billion) |
|
Segments Covered |
Service, Type, End User, Orbit, and Region |
|
Geographies Covered |
North America, Europe, Asia Pacific, the Middle East & Africa, and Latin America |
|
Companies Covered |
Maxar Technologies (US), Astroscale Holdings Inc. (Japan), SpaceLogistics LLC (US), Airbus SE (Netherlands), and Thales Alenia Space (France) among 25 others. |
On-Orbit Satellite Servicing Market Highlights
This research report categorizes the On-orbit satellite servicing market based on Service, Type, End User, Orbit, and Region.
|
Segment |
Subsegment |
|
By Service |
|
|
By Orbit |
|
|
By End User |
|
|
By Type |
|
|
By Region |
|
Recent Developments
- In February 2023, Gilmour Space Technologies and Atomos Space announced the signing of an MOU to explore a multi-year contract for Gilmour and Atomos to mutually purchase the services for launching and in-space transportation.
- In September 2022, Orbit Fab jointly announced the partnership with ClearSpace, joining their £2.2 million contract awarded by the United Kingdom Space Agency (UKSA) to equip the ClearSpace debris-removing satellites with refueling capabilities. To refuel in orbit, ClearSpace will integrate Orbit Fab’s RAFTI™ refueling valve in their Active Debris Removal (ADR) satellite design.
- In September 2022, Thales Alenia Space and its partners have been chosen by the European Commission to lead EROSS IOD, a program dedicated to On-Orbit Servicing.
- In April 2022, Orbit Fab and Neutron Star Systems (NSS) established a cooperative agreement for the co-development of satellite refueling solutions with green propellants. The agreement lays the foundation to increase the range of refuellable propellants by combining NSS propellant-agnostic electric propulsion technology with Orbit Fab’s refueling interfaces and tankers.
- In March 2022, Altius Space Machines, Inc. and US Department of Defense signed a contract. The contract enabled Altius to assist Maxar in developing two flight-ready robotic arms, each 2 meters in length. Each arm will be underactuated, with a single motor running a tensioned cable system to transmit torque to any number of joints, reducing the weight and cost. Altius will supply novel and capable interfaces for each robotic arm, a key technology for the success of the project.
Frequently Asked Questions (FAQ):
What is the current size of the on-orbit satellite servicing market?
The on-orbit satellite servicing market is projected to grow from an estimated USD 2.4 billion in 2023 to USD 5.1 billion by 2030, at a CAGR of 11.1% .
Who are the winners in the on-orbit satellite servicing market?
Maxar Technologies (US), Astroscale Holdings Inc. (Japan), SpaceLogistics LLC (US), Airbus SE (Netherlands), and Thales Alenia Space (France) are some of the winners in the market.
What are some of the opportunities of the on-orbit satellite servicing market?
Cost-effective than launching new satellites, Environmental Sustainability, Collaboration among different stakeholders are few of the opportunities of the on-orbit satellite servicing market.
What are some of the technological advancements in the market?
Autonomous robots to provide on-orbit satellite services, on-orbit manufacturing, autonomous spacecraft operations, development of dedicated service aircraft among others.
What are the factors driving the growth of the market?
Aging satellite population, Space debris mitigationare some of the key factors driving the growth in the market.
To speak to our analyst for a discussion on the above findings, click Speak to Analyst


- 5.1 INTRODUCTION
- 5.2 TECHNOLOGY EVOLUTION OF ON-ORBIT SATELLITE SERVICING MARKET
-
5.3 MARKET DYNAMICSDRIVERS- Aging satellite population- Space debris mitigationRESTRAINTS- Technological complexity- Limited demandOPPORTUNITIES- More cost-effective than satellite launches- Environmental sustainability- Collaboration among different stakeholdersCHALLENGES- Rapid advancement in satellite technology to challenge market growth- Complex regulatory environment
- 5.4 VALUE CHAIN ANALYSIS
- 5.5 RECESSION IMPACT ANALYSIS
-
5.6 TRENDS/DISRUPTIONS IMPACTING CUSTOMER BUSINESSREVENUE SHIFT AND NEW REVENUE POCKETS FOR ON-ORBIT SATELLITE SYSTEM MANUFACTURERS
-
5.7 ECOSYSTEM ANALYSISPROMINENT COMPANIESPRIVATE ON-ORBIT ENTERPRISESMILITARY FORCES
-
5.8 PRICING ANALYSISAVERAGE SELLING PRICE
- 5.9 VOLUME DATA
-
5.10 PORTER'S FIVE FORCES ANALYSISTHREAT OF NEW ENTRANTSTHREAT OF SUBSTITUTESBARGAINING POWER OF SUPPLIERSBARGAINING POWER OF BUYERSINTENSITY OF COMPETITIVE RIVALRY
-
5.11 TARIFF AND REGULATORY LANDSCAPENORTH AMERICAEUROPEASIA PACIFICREST OF THE WORLD
- 5.12 TRADE ANALYSIS
-
5.13 KEY STAKEHOLDERS AND BUYING CRITERIAKEY STAKEHOLDERS IN BUYING PROCESSBUYING CRITERIA
- 5.14 KEY CONFERENCES AND EVENTS, 2023–2024
-
5.15 TECHNOLOGY ANALYSISKEY TECHNOLOGY- High-throughput satellites (HTS)- Autonomous satellite operations- Miniaturization in space technology
- 6.1 INTRODUCTION
-
6.2 TECHNOLOGY TRENDSAUTONOMOUS ROBOTS TO PROVIDE ON-ORBIT SATELLITE SERVICESON-ORBIT MANUFACTURINGAUTONOMOUS SPACECRAFT OPERATIONSDEVELOPMENT OF DEDICATED SERVICE AIRCRAFT3D PRINTING OF SATELLITE EQUIPMENT
-
6.3 CASE STUDY ANALYSISMISSION EXTENSION VEHICLESATELLITE REFUELING
-
6.4 PATENT ANALYSIS
-
6.5 IMPACT OF MEGATRENDSRISE OF SMALL SATELLITESADVANCEMENTS IN SATELLITE TECHNOLOGYSHIFT IN GLOBAL ECONOMIC POWER
- 7.1 INTRODUCTION
-
7.2 SMALL SATELLITES (< 500 KG)SMALLER AND LESS EXPENSIVE THAN TRADITIONAL LARGER SATELLITES
-
7.3 MEDIUM SATELLITES (501–1000 KG)DESIGNED TO ACCOMMODATE MORE COMPLEX PAYLOADS AND INSTRUMENTS THAN SMALL SATELLITES
-
7.4 LARGE SATELLITES (>1000 KG)VULNERABLE TO FAILURES OR MALFUNCTIONS DUE TO HIGHER NUMBER OF SUBSYSTEMS
- 8.1 INTRODUCTION
-
8.2 ACTIVE DEBRIS REMOVAL (ADR) AND ORBIT ADJUSTMENTUSED TO CAPTURE AND REMOVE SPACE DEBRIS FROM ORBIT
-
8.3 ROBOTIC SERVICINGUSED IN BOTH LOWER EARTH ORBIT AND GEOSTATIONARY ORBIT
-
8.4 REFUELINGINVOLVES USE OF ROBOTIC ARMS AND FLUID TRANSFER SYSTEMS TO TRANSFER FUEL TO SATELLITE SAFELY AND EFFICIENTLY
-
8.5 ASSEMBLYALLOWS SATELLITES TO BE BUILT AND LAUNCHED IN MODULAR PIECES
- 9.1 INTRODUCTION
-
9.2 LOW EARTH ORBIT (LEO)INCREASING NUMBER OF SATELLITES LAUNCHED INTO LEO
-
9.3 MEDIUM EARTH ORBIT (MEO)EXTENSIVELY UTILIZED BY SATELLITE NAVIGATION SYSTEMS
-
9.4 GEOSTATIONARY EARTH ORBIT (GEO)CONTRIBUTES TO LONG-TERM SUSTAINABILITY OF SPACE OPERATIONS BY REDUCING SPACE DEBRIS
- 10.1 INTRODUCTION
-
10.2 MILITARY & GOVERNMENTON-ORBIT SATELLITE SERVICING TO PERFORM CRITICAL MAINTENANCE AND REPAIRS ON MILITARY SATELLITES AND SUPPORT SCIENTIFIC MISSIONS
-
10.3 COMMERCIALON-ORBIT SATELLITE SERVICING TO EXTEND OPERATIONAL LIFETIME OF COMMERCIAL SATELLITES
- 11.1 INTRODUCTION
- 11.2 REGIONAL RECESSION IMPACT ANALYSIS
-
11.3 NORTH AMERICAPESTLE ANALYSIS: NORTH AMERICAUS- New technologies and business models to make it easier and cost-effective to service satellitesCANADA- Expertise in robotics and automation
-
11.4 EUROPEPESTLE ANALYSIS: EUROPEUK- Actively investing in on-orbit satellite servicing technologyGERMANY- Several projects funded by German Aerospace CenterRUSSIA- Many ongoing satellite servicing projectsITALY- Growing fleet of old satellitesFRANCE- Heavy investment in R&D by CNESREST OF EUROPE
-
11.5 ASIA PACIFICPESTLE ANALYSIS: ASIA PACIFICCHINA- Major country-level satellite servicing market globallyINDIA- Strong technology capabilities and growing private sector involvementJAPAN- Establishment of Space Industry Vision 2025 programAUSTRALIA- Government actively promoting development of space industrySOUTH KOREA- Launched several experimental satellites to test on-orbit servicing technologiesREST OF ASIA PACIFIC
-
11.6 MIDDLE EAST & AFRICAPESTLE ANALYSIS: MIDDLE EAST & AFRICAIRAN- Challenges in accessing latest technologies and equipment due to international sanctionsISRAEL- Supportive government and thriving startup ecosystemUAE- Government investing heavily in development of space programsSOUTH AFRICA- Development of space-related technologies
-
11.7 LATIN AMERICAPESTLE ANALYSIS: LATIN AMERICABRAZIL- Development of space-related technologies and servicesMEXICO- Initiative to develop technologies for space debris mitigation and on-orbit servicingARGENTINA- Government initiatives to develop on-orbit satellite servicing capabilities

- 12.1 INTRODUCTION
-
12.2 COMPETITIVE OVERVIEWKEY DEVELOPMENTS OF LEADING PLAYERS IN ON-ORBIT SATELLITE SERVICING MARKET (2020–2022)
- 12.3 MARKET RANKING ANALYSIS
- 12.4 REVENUE ANALYSIS
- 12.5 MARKET SHARE ANALYSIS
-
12.6 COMPANY EVALUATION MATRIXSTARSEMERGING LEADERSPERVASIVE PLAYERSPARTICIPANTSCOMPETITIVE BENCHMARKING
-
12.7 STARTUP/SME EVALUATION MATRIXPROGRESSIVE COMPANIESRESPONSIVE COMPANIESSTARTING BLOCKSDYNAMIC COMPANIES
-
12.8 COMPETITIVE SCENARIODEALS
- 13.1 INTRODUCTION
-
13.2 KEY PLAYERSMAXAR TECHNOLOGIES- Business overview- Services offered- Recent developments- MnM viewASTROSCALE HOLDINGS INC.- Business overview- Services offered- Recent developments- MnM viewSPACELOGISTICS LLC- Business Overview- Services offered- Recent developments- MnM viewAIRBUS SE- Business overview- Services offered- Recent developments- MnM viewTHALES ALENIA SPACE- Business overview- Services offered- Recent developments- MnM viewTETHERS UNLIMITED, INC.- Business overview- Services offered- Recent developmentsALTIUS SPACE MACHINES, INC.- Business Overview- Services offered- Recent developmentsORBIT FAB, INC.- Business overview- Services offered- Recent developmentsMOMENTUS, INC.- Business overview- Services offered- Recent developmentsCLEARSPACE- Business Overview- Services offered- Recent developmentsATOMOS SPACE- Business overview- Services offered- Recent developmentsROGUE SPACE SYSTEMS- Business Overview- Services offered- Recent developmentsSTARFISH SPACE- Business Overview- Services offered- Recent developmentsD-ORBIT- Business overview- Services offered- Recent developmentsTURION SPACE- Business overview- Services offered- Recent developments
-
13.3 OTHER PLAYERSOBRUTA SPACE SOLUTIONS CORPLÚNASA LTD.INFINITE ORBITSHYORISTIC INNOVATIONSORBITAID AEROSPACE PRIVATE LIMITEDFUTURE SPACE INDUSTRIESHIGH EARTH ORBIT ROBOTICSSPACE MACHINES COMPANY PTY LTDORION ASTSCOUT AEROSPACE LLC
- 14.1 DISCUSSION GUIDE
- 14.2 KNOWLEDGESTORE: MARKETSANDMARKETS’ SUBSCRIPTION PORTAL
- 14.3 CUSTOMIZATION OPTIONS
- 14.4 RELATED REPORTS
- 14.5 AUTHOR DETAILS
- TABLE 1 INCLUSIONS AND EXCLUSIONS
- TABLE 2 USD EXCHANGE RATES
- TABLE 3 MARKET SIZE ESTIMATION AND METHODOLOGY
- TABLE 4 ON-ORBIT SATELLITE SERVICING MARKET: ROLE IN ECOSYSTEM
- TABLE 5 AVERAGE SELLING PRICE OF ON-ORBIT SATELLITE SERVICES
- TABLE 6 ON-ORBIT SATELLITE SERVICING MARKET, SATELLITE VOLUME DATA (IN UNITS), 2019-2030
- TABLE 7 ON-ORBIT SATELLITE SERVICES: IMPACT OF PORTER'S FIVE FORCES
- TABLE 8 NORTH AMERICA: REGULATORY BODIES, GOVERNMENT AGENCIES, AND OTHER AGENCIES
- TABLE 9 EUROPE: REGULATORY BODIES, GOVERNMENT AGENCIES, AND OTHER AGENCIES
- TABLE 10 ASIA PACIFIC: REGULATORY BODIES, GOVERNMENT AGENCIES, AND OTHER AGENCIES
- TABLE 11 REST OF THE WORLD: REGULATORY BODIES, GOVERNMENT AGENCIES, AND OTHER AGENCIES
- TABLE 12 ON-ORBIT SATELLITE SERVICING MARKET: COUNTRY-WISE IMPORTS, 2019–2021 (USD THOUSAND)
- TABLE 13 ON-ORBIT SATELLITE SERVICING MARKET: COUNTRY-WISE EXPORTS, 2019–2021 (USD THOUSAND)
- TABLE 14 INFLUENCE OF STAKEHOLDERS ON BUYING PROCESS FOR TOP END USERS (%)
- TABLE 15 KEY BUYING CRITERIA FOR TOP 3 ON-ORBIT SATELLITE SERVICES
- TABLE 16 ON-ORBIT SATELLITE SERVICING MARKET: KEY CONFERENCES AND EVENTS
- TABLE 17 MISSION EXTENSION VEHICLE
- TABLE 18 SATELLITE REFUELING
- TABLE 19 INNOVATIONS AND PATENT REGISTRATIONS, 2020-2022
- TABLE 20 ON-ORBIT SATELLITE SERVICING MARKET, BY TYPE, 2019–2022 (USD MILLION)
- TABLE 21 ON-ORBIT SATELLITE SERVICING MARKET, BY TYPE, 2023–2030 (USD MILLION)
- TABLE 22 ON-ORBIT SATELLITE SERVICING MARKET, BY SERVICE, 2019–2022 (USD MILLION)
- TABLE 23 ON-ORBIT SATELLITE SERVICING MARKET, BY SERVICE, 2023–2030 (USD MILLION)
- TABLE 24 ON-ORBIT SATELLITE SERVICING MARKET, BY ORBIT, 2019–2022 (USD MILLION)
- TABLE 25 ON-ORBIT SATELLITE SERVICING MARKET, BY ORBIT, 2023–2030 (USD MILLION)
- TABLE 26 ON-ORBIT SATELLITE SERVICING MARKET, BY END USER, 2019–2022 (USD MILLION)
- TABLE 27 ON-ORBIT SATELLITE SERVICING MARKET, BY END USER, 2023–2030 (USD MILLION)
- TABLE 28 ON-ORBIT SATELLITE SERVICING MARKET, BY REGION, 2019–2022 (USD MILLION)
- TABLE 29 ON-ORBIT SATELLITE SERVICING MARKET, BY REGION, 2023–2030 (USD MILLION)
- TABLE 30 REGIONAL RECESSION IMPACT ANALYSIS
- TABLE 31 NORTH AMERICA: ON-ORBIT SATELLITE SERVICING MARKET, BY COUNTRY, 2019–2022 (USD MILLION)
- TABLE 32 NORTH AMERICA: ON-ORBIT SATELLITE SERVICING MARKET, BY COUNTRY, 2023–2030 (USD MILLION)
- TABLE 33 NORTH AMERICA: ON-ORBIT SATELLITE SERVICING MARKET, BY END USER, 2019–2022 (USD MILLION)
- TABLE 34 NORTH AMERICA: ON-ORBIT SATELLITE SERVICING MARKET, BY END USER, 2023–2030 (USD MILLION)
- TABLE 35 NORTH AMERICA: ON-ORBIT SATELLITE SERVICING MARKET, BY TYPE, 2019–2022 (USD MILLION)
- TABLE 36 NORTH AMERICA: ON-ORBIT SATELLITE SERVICING MARKET, BY TYPE, 2023–2030 (USD MILLION)
- TABLE 37 US: ON-ORBIT SATELLITE SERVICING MARKET, BY END USER, 2019–2022 (USD MILLION)
- TABLE 38 US: ON-ORBIT SATELLITE SERVICING MARKET, BY END USER, 2023–2030 (USD MILLION)
- TABLE 39 US: ON-ORBIT SATELLITE SERVICING MARKET, BY TYPE, 2019–2022 (USD MILLION)
- TABLE 40 US: ON-ORBIT SATELLITE SERVICING MARKET, BY TYPE, 2023–2030 (USD MILLION)
- TABLE 41 CANADA: ON-ORBIT SATELLITE SERVICING MARKET, BY END USER, 2019–2022 (USD MILLION)
- TABLE 42 CANADA: ON-ORBIT SATELLITE SERVICING MARKET, BY END USER, 2023–2030 (USD MILLION)
- TABLE 43 CANADA: ON-ORBIT SATELLITE SERVICING MARKET, BY TYPE, 2019–2022 (USD MILLION)
- TABLE 44 CANADA: ON-ORBIT SATELLITE SERVICING MARKET, BY TYPE, 2023–2030 (USD MILLION)
- TABLE 45 EUROPE: ON-ORBIT SATELLITE SERVICING MARKET, BY COUNTRY, 2019–2022 (USD MILLION)
- TABLE 46 EUROPE: ON-ORBIT SATELLITE SERVICING MARKET, BY COUNTRY, 2023–2030 (USD MILLION)
- TABLE 47 EUROPE: ON-ORBIT SATELLITE SERVICING MARKET, BY END USER, 2019–2022 (USD MILLION)
- TABLE 48 EUROPE: ON-ORBIT SATELLITE SERVICING MARKET, BY END USER, 2023–2030 (USD MILLION)
- TABLE 49 EUROPE: ON-ORBIT SATELLITE SERVICING MARKET, BY TYPE, 2019–2022 (USD MILLION)
- TABLE 50 EUROPE: ON-ORBIT SATELLITE SERVICING MARKET, BY TYPE, 2023–2030 (USD MILLION)
- TABLE 51 UK: ON-ORBIT SATELLITE SERVICING MARKET, BY END USER, 2019–2022 (USD MILLION)
- TABLE 52 UK: ON-ORBIT SATELLITE SERVICING MARKET, BY END USER, 2023–2030 (USD MILLION)
- TABLE 53 UK: ON-ORBIT SATELLITE SERVICING MARKET, BY TYPE, 2019–2022 (USD MILLION)
- TABLE 54 UK: ON-ORBIT SATELLITE SERVICING MARKET, BY TYPE, 2023–2030 (USD MILLION)
- TABLE 55 GERMANY: ON-ORBIT SATELLITE SERVICING MARKET, BY END USER, 2019–2022 (USD MILLION)
- TABLE 56 GERMANY: ON-ORBIT SATELLITE SERVICING MARKET, BY END USER, 2023–2030 (USD MILLION)
- TABLE 57 GERMANY: ON-ORBIT SATELLITE SERVICING MARKET, BY TYPE, 2019–2022 (USD MILLION)
- TABLE 58 GERMANY: ON-ORBIT SATELLITE SERVICING MARKET, BY TYPE, 2023–2030 (USD MILLION)
- TABLE 59 RUSSIA: ON-ORBIT SATELLITE SERVICING MARKET, BY END USER, 2019–2022 (USD MILLION)
- TABLE 60 RUSSIA: ON-ORBIT SATELLITE SERVICING MARKET, BY END USER, 2023–2030 (USD MILLION)
- TABLE 61 RUSSIA: ON-ORBIT SATELLITE SERVICING MARKET, BY TYPE, 2019–2022 (USD MILLION)
- TABLE 62 RUSSIA: ON-ORBIT SATELLITE SERVICING MARKET, BY TYPE, 2023–2030 (USD MILLION)
- TABLE 63 ITALY: ON-ORBIT SATELLITE SERVICING MARKET, BY END USER, 2019–2022 (USD MILLION)
- TABLE 64 ITALY: ON-ORBIT SATELLITE SERVICING MARKET, BY END USER, 2023–2030 (USD MILLION)
- TABLE 65 ITALY: ON-ORBIT SATELLITE SERVICING MARKET, BY TYPE, 2019–2022 (USD MILLION)
- TABLE 66 ITALY: ON-ORBIT SATELLITE SERVICING MARKET, BY TYPE, 2023–2030 (USD MILLION)
- TABLE 67 FRANCE: ON-ORBIT SATELLITE SERVICING MARKET, BY END USER, 2019–2022 (USD MILLION)
- TABLE 68 FRANCE: ON-ORBIT SATELLITE SERVICING MARKET, BY END USER, 2023–2030 (USD MILLION)
- TABLE 69 FRANCE: ON-ORBIT SATELLITE SERVICING MARKET, BY TYPE, 2019–2022 (USD MILLION)
- TABLE 70 FRANCE: ON-ORBIT SATELLITE SERVICING MARKET, BY TYPE, 2023–2030 (USD MILLION)
- TABLE 71 REST OF EUROPE: ON-ORBIT SATELLITE SERVICING MARKET, BY END USER, 2019–2022 (USD MILLION)
- TABLE 72 REST OF EUROPE: ON-ORBIT SATELLITE SERVICING MARKET, BY END USER, 2023–2030 (USD MILLION)
- TABLE 73 REST OF EUROPE: ON-ORBIT SATELLITE SERVICING MARKET, BY TYPE, 2019–2022 (USD MILLION)
- TABLE 74 REST OF EUROPE: ON-ORBIT SATELLITE SERVICING MARKET, BY TYPE, 2023–2030 (USD MILLION)
- TABLE 75 ASIA PACIFIC: ON-ORBIT SATELLITE SERVICING MARKET, BY COUNTRY, 2019–2022 (USD MILLION)
- TABLE 76 ASIA PACIFIC: ON-ORBIT SATELLITE SERVICING MARKET, BY COUNTRY, 2023–2030(USD MILLION)
- TABLE 77 ASIA PACIFIC: ON-ORBIT SATELLITE SERVICING MARKET, BY END USER, 2019–2022 (USD MILLION)
- TABLE 78 ASIA PACIFIC: ON-ORBIT SATELLITE SERVICING MARKET, BY END USER, 2023–2030 (USD MILLION)
- TABLE 79 ASIA PACIFIC: ON-ORBIT SATELLITE SERVICING MARKET, BY TYPE, 2019–2022 (USD MILLION)
- TABLE 80 ASIA PACIFIC: ON-ORBIT SATELLITE SERVICING MARKET, BY TYPE, 2023–2030 (USD MILLION)
- TABLE 81 CHINA: ON-ORBIT SATELLITE SERVICING MARKET, BY END USER, 2019–2022 (USD MILLION)
- TABLE 82 CHINA: ON-ORBIT SATELLITE SERVICING MARKET, BY END USER, 2023–2030 (USD MILLION)
- TABLE 83 CHINA: ON-ORBIT SATELLITE SERVICING MARKET, BY TYPE, 2019–2022 (USD MILLION)
- TABLE 84 CHINA: ON-ORBIT SATELLITE SERVICING MARKET, BY TYPE, 2023–2030 (USD MILLION)
- TABLE 85 INDIA: ON-ORBIT SATELLITE SERVICING MARKET, BY END USER, 2019–2022 (USD MILLION)
- TABLE 86 INDIA: ON-ORBIT SATELLITE SERVICING MARKET, BY END USER, 2023–2030 (USD MILLION)
- TABLE 87 INDIA: ON-ORBIT SATELLITE SERVICING MARKET, BY TYPE, 2019–2022 (USD MILLION)
- TABLE 88 INDIA: ON-ORBIT SATELLITE SERVICING MARKET, BY TYPE, 2023–2030 (USD MILLION)
- TABLE 89 JAPAN: ON-ORBIT SATELLITE SERVICING MARKET, BY END USER, 2019–2022 (USD MILLION)
- TABLE 90 JAPAN: ON-ORBIT SATELLITE SERVICING MARKET, BY END USER, 2023–2030 (USD MILLION)
- TABLE 91 JAPAN: ON-ORBIT SATELLITE SERVICING MARKET, BY TYPE, 2019–2022 (USD MILLION)
- TABLE 92 JAPAN: ON-ORBIT SATELLITE SERVICING MARKET, BY TYPE, 2023–2030 (USD MILLION)
- TABLE 93 AUSTRALIA: ON-ORBIT SATELLITE SERVICING MARKET, BY END USER, 2019–2022 (USD MILLION)
- TABLE 94 AUSTRALIA: ON-ORBIT SATELLITE SERVICING MARKET, BY END USER, 2023–2030 (USD MILLION)
- TABLE 95 AUSTRALIA: ON-ORBIT SATELLITE SERVICING MARKET, BY TYPE, 2019–2022 (USD MILLION)
- TABLE 96 AUSTRALIA: ON-ORBIT SATELLITE SERVICING MARKET, BY TYPE, 2023–2030 (USD MILLION)
- TABLE 97 SOUTH KOREA: ON-ORBIT SATELLITE SERVICING MARKET, BY END USER, 2019–2022 (USD MILLION)
- TABLE 98 SOUTH KOREA: ON-ORBIT SATELLITE SERVICING MARKET, BY END USER, 2023–2030 (USD MILLION)
- TABLE 99 SOUTH KOREA: ON-ORBIT SATELLITE SERVICING MARKET, BY TYPE, 2019–2022 (USD MILLION)
- TABLE 100 SOUTH KOREA: ON-ORBIT SATELLITE SERVICING MARKET, BY TYPE, 2023–2030 (USD MILLION)
- TABLE 101 REST OF ASIA PACIFIC: ON-ORBIT SATELLITE SERVICING MARKET, BY END USER, 2019–2022 (USD MILLION)
- TABLE 102 REST OF ASIA PACIFIC: ON-ORBIT SATELLITE SERVICING MARKET, BY END USER, 2023–2030 (USD MILLION)
- TABLE 103 REST OF ASIA PACIFIC: ON-ORBIT SATELLITE SERVICING MARKET, BY TYPE, 2019–2022 (USD MILLION)
- TABLE 104 REST OF ASIA PACIFIC: ON-ORBIT SATELLITE SERVICING MARKET, BY TYPE, 2023–2030 (USD MILLION)
- TABLE 105 MIDDLE EAST & AFRICA: ON-ORBIT SATELLITE SERVICING MARKET, BY COUNTRY, 2019–2022 (USD MILLION)
- TABLE 106 MIDDLE EAST & AFRICA: ON-ORBIT SATELLITE SERVICING MARKET, BY COUNTRY, 2023–2030 (USD MILLION)
- TABLE 107 MIDDLE EAST & AFRICA: ON-ORBIT SATELLITE SERVICING MARKET, BY END USER, 2019–2022 (USD MILLION)
- TABLE 108 MIDDLE EAST & AFRICA: ON-ORBIT SATELLITE SERVICING MARKET, BY END USER, 2023–2030 (USD MILLION)
- TABLE 109 MIDDLE EAST & AFRICA: ON-ORBIT SATELLITE SERVICING MARKET, BY TYPE, 2019–2022 (USD MILLION)
- TABLE 110 MIDDLE EAST & AFRICA: ON-ORBIT SATELLITE SERVICING MARKET, BY TYPE, 2023–2030 (USD MILLION)
- TABLE 111 IRAN: ON-ORBIT SATELLITE SERVICING MARKET, BY END USER, 2019–2022 (USD MILLION)
- TABLE 112 IRAN: ON-ORBIT SATELLITE SERVICING MARKET, BY END USER, 2023–2030 (USD MILLION)
- TABLE 113 IRAN: ON-ORBIT SATELLITE SERVICING MARKET, BY TYPE, 2019–2022 (USD MILLION)
- TABLE 114 IRAN: ON-ORBIT SATELLITE SERVICING MARKET, BY TYPE, 2023–2030 (USD MILLION)
- TABLE 115 ISRAEL: ON-ORBIT SATELLITE SERVICING MARKET, BY END USER, 2019–2022 (USD MILLION)
- TABLE 116 ISRAEL: ON-ORBIT SATELLITE SERVICING MARKET, BY END USER, 2023–2030 (USD MILLION)
- TABLE 117 ISRAEL: ON-ORBIT SATELLITE SERVICING MARKET, BY TYPE, 2019–2022 (USD MILLION)
- TABLE 118 ISRAEL: ON-ORBIT SATELLITE SERVICING MARKET, BY TYPE, 2023–2030 (USD MILLION)
- TABLE 119 UAE: ON-ORBIT SATELLITE SERVICING MARKET, BY END USER, 2019–2022 (USD MILLION)
- TABLE 120 UAE: ON-ORBIT SATELLITE SERVICING MARKET, BY END USER, 2023–2030 (USD MILLION)
- TABLE 121 UAE: ON-ORBIT SATELLITE SERVICING MARKET, BY TYPE, 2019–2022 (USD MILLION)
- TABLE 122 UAE: ON-ORBIT SATELLITE SERVICING MARKET, BY TYPE, 2023–2030 (USD MILLION)
- TABLE 123 SOUTH AFRICA: ON-ORBIT SATELLITE SERVICING MARKET, BY END USER, 2019–2022 (USD MILLION)
- TABLE 124 SOUTH AFRICA: ON-ORBIT SATELLITE SERVICING MARKET, BY END USER, 2023–2030 (USD MILLION)
- TABLE 125 SOUTH AFRICA: ON-ORBIT SATELLITE SERVICING MARKET, BY TYPE, 2019–2022 (USD MILLION)
- TABLE 126 SOUTH AFRICA: ON-ORBIT SATELLITE SERVICING MARKET, BY TYPE, 2023–2030 (USD MILLION)
- TABLE 127 LATIN AMERICA: ON-ORBIT SATELLITE SERVICING MARKET, BY COUNTRY, 2019–2022 (USD MILLION)
- TABLE 128 LATIN AMERICA: ON-ORBIT SATELLITE SERVICING MARKET, BY COUNTRY, 2023–2030 (USD MILLION)
- TABLE 129 LATIN AMERICA: ON-ORBIT SATELLITE SERVICING MARKET, BY END USER, 2019–2022 (USD MILLION)
- TABLE 130 LATIN AMERICA: ON-ORBIT SATELLITE SERVICING MARKET, BY END USER, 2023–2030 (USD MILLION)
- TABLE 131 LATIN AMERICA: ON-ORBIT SATELLITE SERVICING MARKET, BY TYPE, 2019–2022 (USD MILLION)
- TABLE 132 LATIN AMERICA: ON-ORBIT SATELLITE SERVICING MARKET, BY TYPE, 2023–2030 (USD MILLION)
- TABLE 133 BRAZIL: ON-ORBIT SATELLITE SERVICING MARKET, BY END USER, 2019–2022 (USD MILLION)
- TABLE 134 BRAZIL: ON-ORBIT SATELLITE SERVICING MARKET, BY END USER, 2023–2030 (USD MILLION)
- TABLE 135 BRAZIL: ON-ORBIT SATELLITE SERVICING MARKET, BY TYPE, 2019–2022 (USD MILLION)
- TABLE 136 BRAZIL: ON-ORBIT SATELLITE SERVICING MARKET, BY TYPE, 2023–2030 (USD MILLION)
- TABLE 137 MEXICO: ON-ORBIT SATELLITE SERVICING MARKET, BY END USER, 2019–2022 (USD MILLION)
- TABLE 138 MEXICO: ON-ORBIT SATELLITE SERVICING MARKET, BY END USER, 2023–2030 (USD MILLION)
- TABLE 139 MEXICO: ON-ORBIT SATELLITE SERVICING MARKET, BY TYPE, 2019–2022 (USD MILLION)
- TABLE 140 MEXICO: ON-ORBIT SATELLITE SERVICING MARKET, BY TYPE, 2023–2030 (USD MILLION)
- TABLE 141 ARGENTINA: ON-ORBIT SATELLITE SERVICING MARKET, BY END USER, 2019–2022 (USD MILLION)
- TABLE 142 ARGENTINA: ON-ORBIT SATELLITE SERVICING MARKET, BY END USER, 2023–2030 (USD MILLION)
- TABLE 143 ARGENTINA: ON-ORBIT SATELLITE SERVICING MARKET, BY TYPE, 2019–2022 (USD MILLION)
- TABLE 144 ARGENTINA: ON-ORBIT SATELLITE SERVICING MARKET, BY TYPE, 2023–2030 (USD MILLION)
- TABLE 145 KEY DEVELOPMENTS OF LEADING PLAYERS IN ON-ORBIT SATELLITE SERVICING MARKET
- TABLE 146 ON-ORBIT SATELLITE SERVICING MARKET: DEGREE OF COMPETITION
- TABLE 147 ON-ORBIT SATELLITE SERVICING MARKET: COMPETITIVE BENCHMARKING
- TABLE 148 ON-ORBIT SATELLITE SERVICING MARKET: LIST OF KEY STARTUPS/SMES
- TABLE 149 ON-ORBIT SATELLITE SERVICING MARKET: DEALS, JANUARY 2019–DECEMBER 2023
- TABLE 150 MAXAR TECHNOLOGIES: COMPANY OVERVIEW
- TABLE 151 MAXAR TECHNOLOGIES: SERVICES OFFERED
- TABLE 152 ASTROSCALE HOLDINGS INC.: COMPANY OVERVIEW
- TABLE 153 ASTROSCALE HOLDINGS INC.: SERVICES OFFERED
- TABLE 154 ASTROSCALE HOLDINGS INC.: DEALS
- TABLE 155 SPACELOGISTICS LLC: COMPANY OVERVIEW
- TABLE 156 SPACELOGISTICS LLC: SERVICES OFFERED
- TABLE 157 SPACELOGISTICS LLC: DEALS
- TABLE 158 AIRBUS SE: COMPANY OVERVIEW
- TABLE 159 AIRBUS SE: SERVICES OFFERED
- TABLE 160 THALES ALENIA SPACE: COMPANY OVERVIEW
- TABLE 161 THALES ALENIA SPACE: SERVICES OFFERED
- TABLE 162 THALES ALENIA SPACE: DEALS
- TABLE 163 TETHERS UNLIMITED, INC.: COMPANY OVERVIEW
- TABLE 164 TETHERS UNLIMITED, INC.: SERVICES OFFERED
- TABLE 165 ALTIUS SPACE MACHINES, INC.: COMPANY OVERVIEW
- TABLE 166 ALTIUS SPACE MACHINES, INC.: SERVICES OFFERED
- TABLE 167 ALTIUS SPACE MACHINES, INC.: DEALS
- TABLE 168 ORBIT FAB, INC.: COMPANY OVERVIEW
- TABLE 169 ORBIT FAB, INC.: SERVICES OFFERED
- TABLE 170 ORBIT FAB, INC.: DEALS
- TABLE 171 MOMENTUS, INC.: COMPANY OVERVIEW
- TABLE 172 MOMENTUS, INC.: SERVICES OFFERED
- TABLE 173 CLEARSPACE: COMPANY OVERVIEW
- TABLE 174 CLEARSPACE: SERVICES OFFERED
- TABLE 175 CLEARSPACE: DEALS
- TABLE 176 ATOMOS SPACE: COMPANY OVERVIEW
- TABLE 177 ATOMOS SPACE: SERVICES
- TABLE 178 ATOMOS SPACE: DEALS
- TABLE 179 ROGUE SPACE SYSTEMS: COMPANY OVERVIEW
- TABLE 180 ROGUE SPACE SYSTEMS: SERVICES OFFERED
- TABLE 181 STARFISH SPACE: COMPANY OVERVIEW
- TABLE 182 STARFISH SPACE: SERVICES OFFERED
- TABLE 183 D-ORBIT: COMPANY OVERVIEW
- TABLE 184 D-ORBIT: SERVICES OFFERED
- TABLE 185 TURION SPACE: COMPANY OVERVIEW
- TABLE 186 TURION SPACE: SERVICES OFFERED
- TABLE 187 OBRUTA SPACE SOLUTIONS CORP: COMPANY OVERVIEW
- TABLE 188 LÚNASA LTD.: COMPANY OVERVIEW
- TABLE 189 INFINITE ORBITS: COMPANY OVERVIEW
- TABLE 190 HYORISTIC INNOVATIONS: COMPANY OVERVIEW
- TABLE 191 ORBITAID AEROSPACE PRIVATE LIMITED: COMPANY OVERVIEW
- TABLE 192 FUTURE SPACE INDUSTRIES: COMPANY OVERVIEW
- TABLE 193 HIGH EARTH ORBIT ROBOTICS: COMPANY OVERVIEW
- TABLE 194 SPACE MACHINES COMPANY PTY LTD: COMPANY OVERVIEW
- TABLE 195 ORION AST: COMPANY OVERVIEW
- TABLE 196 SCOUT AEROSPACE LLC: COMPANY OVERVIEW
- FIGURE 1 ON-ORBIT SATELLITE SERVICING MARKET SEGMENTATION
- FIGURE 2 ON-ORBIT SATELLITE SERVICING MARKET: RESEARCH PROCESS FLOW
- FIGURE 3 ON-ORBIT SATELLITE SERVICING MARKET: RESEARCH DESIGN
- FIGURE 4 KEY DATA FROM SECONDARY SOURCES
- FIGURE 5 KEY DATA FROM PRIMARY SOURCES
- FIGURE 6 MARKET SIZE ESTIMATION METHODOLOGY: BOTTOM-UP APPROACH
- FIGURE 7 MARKET SIZE ESTIMATION METHODOLOGY: TOP-DOWN APPROACH
- FIGURE 8 ON-ORBIT SATELLITE SERVICING MARKET: DATA TRIANGULATION
- FIGURE 9 COMMERCIAL SEGMENT TO DOMINATE ON-ORBIT SATELLITE SERVICING MARKET DURING FORECAST PERIOD
- FIGURE 10 SMALL SATELLITES (< 500 KG) SEGMENT TO LEAD ON-ORBIT SATELLITE SERVICING MARKET DURING FORECAST PERIOD
- FIGURE 11 ROBOTIC SERVICING SEGMENT TO LEAD ON-ORBIT SATELLITE SERVICING MARKET DURING FORECAST PERIOD
- FIGURE 12 NORTH AMERICA TO DOMINATE ON-ORBIT SATELLITE SERVICING MARKET IN 2023
- FIGURE 13 GROWING PROBLEM OF SPACE DEBRIS TO DRIVE DEMAND FOR ON-ORBIT SATELLITE SERVICING
- FIGURE 14 ACTIVE DEBRIS REMOVAL (ADR) AND ORBIT ADJUSTMENT SEGMENT TO REGISTER HIGHEST CAGR DURING FORECAST PERIOD
- FIGURE 15 LOW EARTH ORBIT (LEO) SEGMENT TO DOMINATE MARKET FROM 2023 TO 2030
- FIGURE 16 COMMERCIAL SEGMENT TO DOMINATE MARKET FROM 2023 TO 2030
- FIGURE 17 FRANCE TO BE FASTEST-GROWING MARKET FROM 2023 TO 2030
- FIGURE 18 TECHNOLOGY EVOLUTION ROADMAP
- FIGURE 19 DRIVERS, RESTRAINTS, OPPORTUNITIES, AND CHALLENGES IN ON-ORBIT SATELLITE SERVICING MARKET
- FIGURE 20 CUBESATS MISSION (UNITS) BEYOND LEO, 2018-2025
- FIGURE 21 ON-ORBIT SATELLITE SERVICING MARKET: VALUE CHAIN ANALYSIS
- FIGURE 22 REVENUE SHIFT IN ON-ORBIT SATELLITE SERVICING MARKET
- FIGURE 23 ON-ORBIT SATELLITE SERVICING MARKET: ECOSYSTEM ANALYSIS
- FIGURE 24 INFLUENCE OF STAKEHOLDERS ON BUYING PROCESS FOR TOP END USERS IN ON-ORBIT SATELLITE SERVICING MARKET
- FIGURE 25 KEY BUYING CRITERIA FOR TOP 3 ON-ORBIT SATELLITE SERVICES
- FIGURE 26 LARGE SATELLITES SEGMENT TO REGISTER HIGHEST CAGR DURING FORECAST PERIOD
- FIGURE 27 ACTIVE DEBRIS REMOVAL (ADR) AND ORBIT ADJUSTMENT TO BE FASTEST-GROWING SEGMENT DURING FORECAST PERIOD
- FIGURE 28 LOW EARTH ORBIT (LEO) SEGMENT TO GROW AT HIGHEST RATE DURING FORECAST PERIOD
- FIGURE 29 COMMERCIAL SEGMENT TO BE FASTEST-GROWING END USER OF ON-ORBIT SATELLITE SERVICING DURING FORECAST PERIOD
- FIGURE 30 NORTH AMERICA TO DOMINATE ON-ORBIT SATELLITE SERVICING MARKET IN 2023
- FIGURE 31 GLOBAL PESSIMISTIC AND REALISTIC VIEW DUE TO RECESSION IMPACT
- FIGURE 32 NORTH AMERICA: ON-ORBIT SATELLITE SERVICING MARKET SNAPSHOT
- FIGURE 33 EUROPE: ON-ORBIT SATELLITE SERVICING MARKET SNAPSHOT
- FIGURE 34 ASIA PACIFIC: ON-ORBIT SATELLITE SERVICING MARKET SNAPSHOT
- FIGURE 35 MARKET RANKING ANALYSIS OF TOP 5 PLAYERS IN ON-ORBIT SATELLITE SERVICING MARKET, 2022
- FIGURE 36 REVENUE ANALYSIS OF TOP 5 PLAYERS IN ON-ORBIT SATELLITE SERVICING MARKET, 2019–2021 (USD MILLION)
- FIGURE 37 MARKET SHARE ANALYSIS OF KEY COMPANIES, 2022
- FIGURE 38 ON-ORBIT SATELLITE SERVICING MARKET: COMPANY EVALUATION MATRIX, 2022
- FIGURE 39 ON-ORBIT SATELLITE SERVICING MARKET: STARTUP/SME EVALUATION MATRIX, 2022
- FIGURE 40 MAXAR TECHNOLOGIES: COMPANY SNAPSHOT
- FIGURE 41 AIRBUS SE: COMPANY SNAPSHOT
- FIGURE 42 MOMENTUS, INC.: COMPANY SNAPSHOT
The research study conducted on the On-orbit satellite servicing market involved extensive use of secondary sources, including directories, databases of articles, journals on On-orbit satellite servicing , company newsletters, and information portals such as Hoover’s, Bloomberg, and Factiva to identify and collect information useful for this extensive, technical, market-oriented, and commercial study of the On-orbit satellite servicing market. Primary sources are several industry experts from the core and related industries, alliances, organizations, Original Equipment Manufacturers (OEMs), vendors, suppliers, and technology developers. These sources relate to all segments of the value chain of the On-orbit satellite servicing industry. In-depth interviews were conducted with various primary respondents, including key industry participants, subject-matter experts, C-level executives of key market players, and industry consultants, among others, to obtain and verify critical qualitative and quantitative information and to assess future prospects of the market.
Secondary Research
In the secondary research process, various secondary sources were referred to identify and collect information for this study on the On-orbit satellite servicing market. Secondary sources included annual reports, press releases, and investor presentations of companies; white papers and certified publications; articles from recognized authors; manufacturer's associations; directories; and databases. Secondary research was mainly used to obtain key information about the supply chain of the On-orbit satellite servicing industry, the monetary chain of the market, the total pool of key players, market classification and segmentation according to the industry trends to the bottom-most level, regional markets, and key developments from both market- and technology-oriented perspectives.
Primary Research
Extensive primary research was conducted to obtain qualitative and quantitative information for this report on the On-orbit satellite servicing market. Several primary interviews were conducted with the market experts from both demand- and supply-side across major regions, namely, North America, Europe, Asia Pacific, the Middle East & Africa, and Latin America. Primary sources from the supply-side included industry experts such as business development managers, sales heads, technology and innovation directors, and related key executives from various key companies and organizations operating in the On-orbit satellite servicing market.
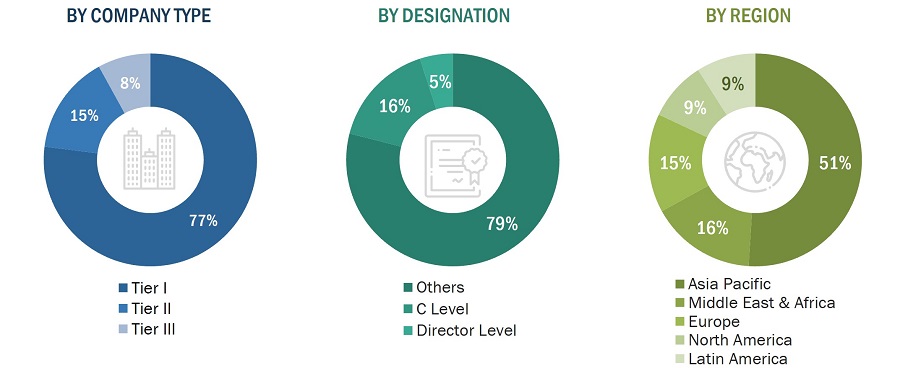
To know about the assumptions considered for the study, download the pdf brochure
KEY PRIMARY SOURCES
|
Company Name |
Designation |
|
Indian Space Research Organisation |
Senior Scientist |
|
Australasian Youth CubeSat |
Project Advisory |
|
Sapeinza Universita di Roma |
Researcher |
|
Space Generation Advisory Council |
Project Lead |
Market Size Estimation
The On-orbit satellite servicing market is an emerging one due to the growing demand for satellite launches. Both top-down and bottom-up approaches were used to estimate and validate the size of the On-orbit satellite servicing market. The research methodology used to estimate the market size also included the following details:
Key players were identified through secondary research, and their market ranking was determined through primary and secondary research. This included a study of annual and financial reports of the top market players and extensive interviews of leaders, including CEOs, directors, and marketing executives. All percentage shares, splits, and breakdowns were determined using secondary sources and verified through primary sources. All possible parameters that affect the markets covered in this research study were accounted for, viewed in extensive detail, verified through primary research, and analyzed to obtain the final quantitative and qualitative data. This data was consolidated, enhanced with detailed inputs, analyzed by MarketsandMarkets, and presented in this report.
Market size estimation methodology: Bottom-up Approach
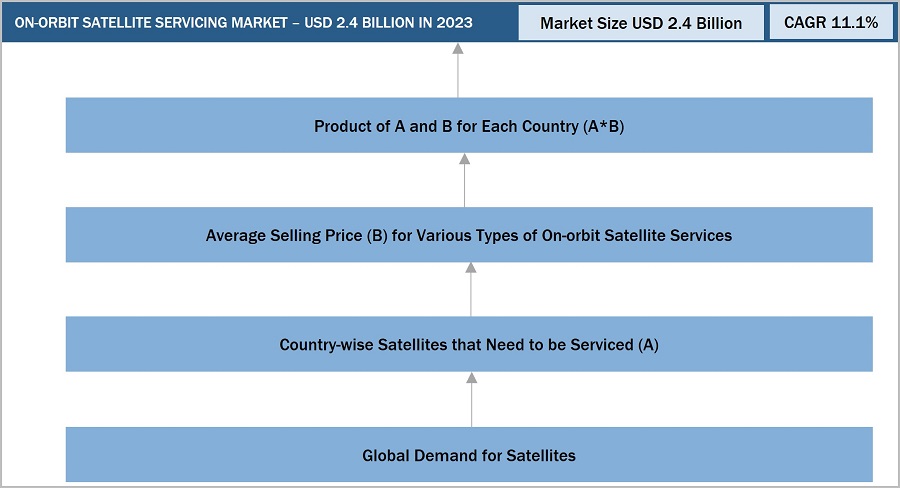
Market size estimation methodology: Top Down Approach
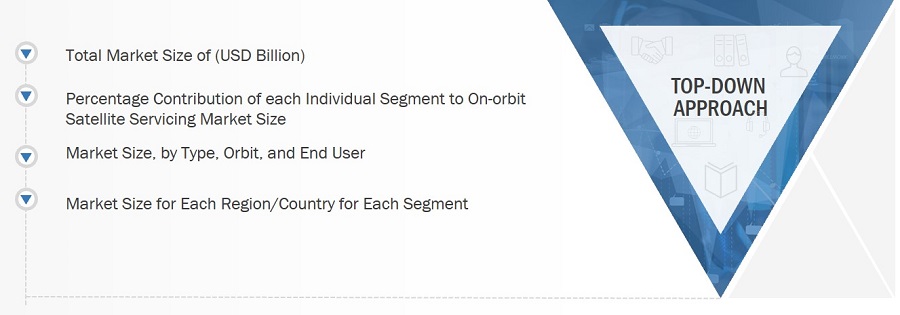
Data Triangulation
After arriving at the overall size of the On-orbit satellite servicing market from the market size estimation process explained above, the total market was split into several segments and subsegments. The data triangulation and market breakdown procedures explained below were implemented, wherever applicable, to complete the overall market engineering process and arrive at the estimated sizes of different market segments and subsegments. The data was triangulated by studying various factors and trends from both the demand and supply sides. Additionally, the market size was validated using both the top-down and bottom-up approaches.
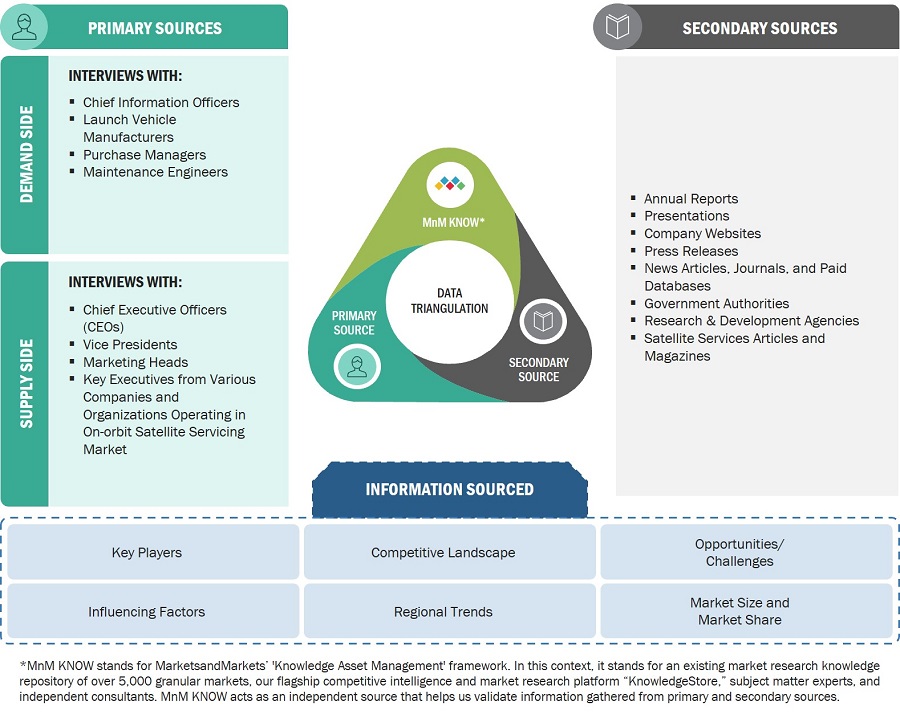
Market Definition
The on-orbit satellite servicing market refers to the industry that provides various maintenance services to satellites that are already in orbit. These services can include satellite refueling, repairing, upgrading, or even decommissioning.
The market for on-orbit satellite servicing has grown in recent years due to the increasing number of satellites in orbit and the need for these satellites to operate for extended periods. Many satellites can be repaired or upgraded in space, which reduces the need to launch replacement satellites, and this is where on-orbit servicing companies come into play.
Key Stakeholders
- Satellite Payload Suppliers
- Meteorological Organizations
- Technology Support Providers
- Government Space Agencies
- Ministry of Defense
- Scientific Research Centers
- Software/Hardware/Service and Solution Providers
- Satellite Component Manufacturers
- Satellite Manufacturers
- Satellite Integrators
Report Objectives
- To analyze the on-orbit satellite servicing market and provide forecasts from 2023 to 2030
- To define, describe, and forecast the market based on service, orbit, end user, type, and region
- To understand the market structure by identifying its various subsegments
- To provide in-depth market intelligence regarding the dynamics (drivers, restraints, opportunities, and challenges) and major factors that influence the growth of the market
- To analyze opportunities in the market for stakeholders by identifying key trends
- To forecast the size of various segments of the market with respect to major regions, such as North America, Europe, Asia Pacific, the Middle East & Africa, and Latin America
- To strategically analyze micro markets with respect to individual growth trends, prospects, and their contribution to the market
- To provide a detailed competitive landscape of the market, along with an analysis of the business and corporate strategies adopted by key market players
- To analyze competitive developments of key players in the market, such as contracts, agreements, and new product developments
- To strategically profile key market players and comprehensively analyze their core competencies
Available Customizations
Along with the market data, MarketsandMarkets offers customizations as per the specific needs of companies. The following customization options are available for the report:
Product Analysis
- Product matrix, which gives a detailed comparison of the product portfolio of each company
Regional Analysis
- Further breakdown of the market segments at country-level
Company Information
- Detailed analysis and profiling of additional market players (up to 5)


 Generating Response ...


Growth opportunities and latent adjacency in On-Orbit Satellite Servicing Market