Opportunity Assessment of Waste Management in US Cities � by Waste Management Outlook (Budget, Programs, Volume, and Disposal Statistics), Key Initiatives, and Cities (Boston, Los Angeles, Philadelphia, Seattle, and San Diego) - Forecast to 2023


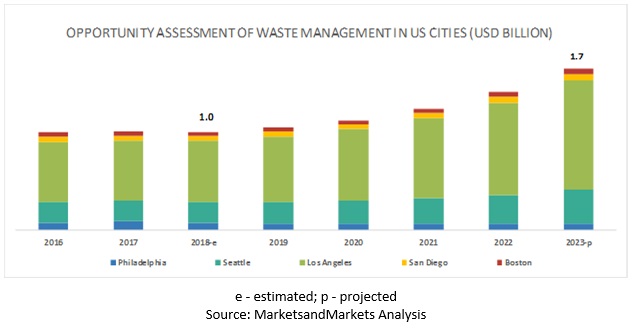
[144 Pages Report] Opportunity Assessment of Waste Management in US Cities are expected to grow from USD 1.0 billion in 2018 to USD 1.7 billion by 2023, at a Compound Annual Growth Rate (CAGR) of 10.4% during the forecast period. Demand for waste management assessment opportunities in US cities is expected to grow over the next 5 years, owing to several factors including an increasing focus on the collection of waste materials and transportation to recycling facilities, sorting material type and selling them to manufacturers to make new products, state governments� focus on waste recycling and energy generation, and increasing adoption of smart waste management systems.
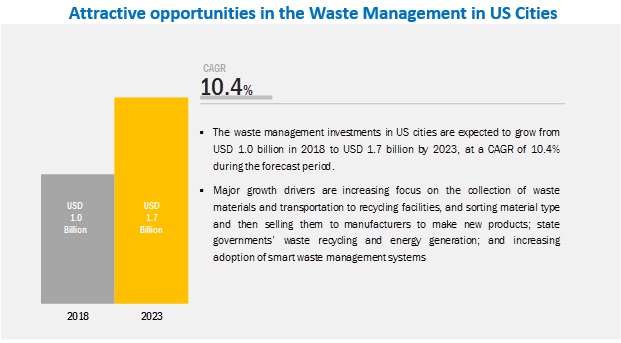
Los Angeles to provide growth opportunities for smart management vendors
Philadelphia, Los Angeles, Boston, and San Diego have adopted Smart Waste Management (SWM) solutions. LA is looking forward to expand the SWM program to other vendors apart from Bigbelly. LA Sanitation (LASAN) handles waste management activities for single-family and multi-family (less than 4 units) establishments. Franchises (haulers) handle waste management activities for multi-family (with 4 or more units) and commercial establishments. Athens Services, Republic Services, Waste Management Inc., Universal Waste Systems, NASA Services, Ware Disposal Company, and CalMet Services are responsible for waste collection, transfer, recycling, processing, and disposal for multi-family and commercial establishments till 2024. City of Los Angeles aims to achieve 97% waste diversion rate by 2030. Since 2015, Los Angeles has rented and installed 66 BigBelly stations in Council District 1. It achieved 94% waste collection efficiency by 2016. Post successful implementation of the pilot program, LASAN plans to release RFPs to get similar services from other vendors. However, changes in the Chinese import policy have led to increased waste processing costs and higher volumes of waste being disposed in landfills. Other waste management challenges include hygiene-related issues due to illegal dumping, increasing complaints about waste pickup services, and unrest around higher service fees charged by haulers.
Sweden to lead waste management and recycling initiatives and achieve zero waste status
Sweden has imported rubbish from other countries to keep its recycling plants going. Recycling waste in Sweden is highly efficient that less than 1% of Swedish household waste has been sent to landfill since 2011. The country has implemented a unified national recycling policy that takes the waste energy into a national heating network to heat homes through the freezing Swedish winter. The country has consistently worked on technological advancements to lower greenhouse gas emissions, improve energy efficiency, and increase public awareness.
Philadelphia records the highest waste management rate by recycling
Philadelphia is the sixth most populous city in the US. The population of Philadelphia witnessed a decline during 1950�2006. However, the population has been increasing from the year of 2006 to 2017 due to organic increase in the population (i.e. number of births has been higher than number of deaths in the area), and increasing influx of immigrants. In 2017, Philadelphia generated 0.41 tons per capita residential waste and 1.46 tons per capita gross waste. Streets Department of Philadelphia provides waste cleaning and collection services to residential and commercial segments. Commercial and multi-family units need to pay USD 300 annually for waste management services. Waste transfer and disposal activities are outsourced to Waste Management Inc. and Covanta. 530,000 residential units are included in the City of Philadelphia. It is estimated that there are approximately 1.06 million residential waste bins, while commercial waste bins are estimated to be 45,000�50,000 (32G capacity).
Key Market Players
Major vendors offering Opportunity Assessment of Waste Management in US Cities include Bigbelly, Inc. (US), Compology (US), OnePlus Systems (US), Ecube Labs (South Korea), Waste Management Inc. (US), Republic Services Inc. (US), Covanta Holding Corporation (US), Recology (US), Athens Services (US), and Bin-e (Poland). The study includes an in-depth competitive analysis of the key players in the waste management market, along with their projects and investments, recent developments, and key market strategies. Market players have embraced various strategies to bring innovative solutions to the expand their global presence and increase their market shares. The vendors have focused on IoT-based sensors to deploy innovative waste recycling and energy generation systems.
Scope of the Report
|
Report Metrics |
Details |
|
Market investments for years |
2018�2023 |
|
Base year considered |
2018 |
|
Forecast units |
Billion (USD) |
|
Cities covered |
Los Angeles, Boston, Philadelphia, San Diego, Seattle, |
|
Geographies covered |
North America |
|
Companies covered |
Bigbelly, Inc. (US), Compology (US), OnePlus Systems (US), Ecube Labs (South Korea), Waste Management Inc. (US), Republic Services Inc. (US), Covanta Holding Corporation (US), Recology (US), Athens Services (US), and Bin-e (Poland) |
The research report categorizes the waste management systems across select major US cities: Los Angeles, Boston, Philadelphia, San Diego, and Seattle.
Based on Cities, the waste management market report covers the following cities in the US:
- Los Angeles
- Boston
- Philadelphia
- San Diego
- Seattle
Waste Management in US Cities
- Waste Management � Current Status
- Key Initiatives
- Waste Management goals
- Market Dynamics
Key Questions addressed by the report:
- What are the opportunities in the waste management opportunities assessment market in the US?
- What is the competitive landscape in the waste management opportunities assessment market in the US?
- What are the key trends in the waste management opportunities assessment market in the US?
- How are mergers and acquisitions influencing the market?
- What are the dynamics of the waste management opportunities assessment market in the US?
Frequently Asked Questions (FAQ):
What is smart waste management?
These containers and bins are connected using sensors and Radio Frequency Identification (RFID) and the information obtained is analyzed and operations are controlled through web portals and dashboards thereby helping in reducing fuel and unnecessary occupancy of workforce.
Who are the top vendors covered for opportunity assessment of waste management in US Cities?
Which cities are covered for opportunity assessment of waste management in US Cities?
What is the market size of opportunity assessment of waste management in US Cities?
To speak to our analyst for a discussion on the above findings, click Speak to Analyst
 Exclusive indicates content/data unique to MarketsandMarkets and not available with any competitors.
Table of Contents
1 Introduction
1.1 Objective of the Study
1.2 Market Definition
1.3 Market Scope
1.4 Stakeholders
1.5 Limitations
1.5.1 City Wise Limitations
2 Research Methodology
2.1 Research Data
2.1.1 Secondary Data
2.1.1 Primary Data
2.2 Market Breakup and Data Triangulation
2.3 Factor Analysis
2.4 Research Assumptions
3 Executive Summary
3.1 Analysis By City
3.2 Waste Management in the US � Key Insights
3.3 Key Takeaways � Philadelphia
3.4 Key Takeaways � Seattle
3.5 Key Takeaways � Los Angeles
3.6 Key Takeaways � San Diego
3.7 Key Takeaways � Boston
3.8 Vendor Analysis
3.8.1 Smart Waste and Recycling System and Vendors
3.8 Promising Technologies in Global Smart Waste and Recycling
4 Waste Management � Current Status
4.1 US Garbage Composition
4.2 Waste Management in US Cities: Statistics
4.3 Zero Waste Management: Key Initiatives and Goals
4.4 Key Policy Insights
4.4.1 Pollution Prevention Act, 1990
5 Opportunity Assessment of Waste Management in US Cities: Sweden and San Francisco
5.1 Sweden
5.1.1 Sweden: Waste Management Statistics
5.1.2 Sweden: Waste Management Methods
5.1.3 Sweden: Waste Treatment Hierarchy
5.1.4 Sweden: Recycling Initiatives
5.2 San Francisco
5.2.1 San Francisco: Recycling Initiatives
5.2.2 San Francisco: Advantages and Disadvantages of Recycling Initiatives
6 Opportunity Analysis By City
6.1 Philadelphia
6.1.1 Philadelphia: Waste Volume Statistics
6.1.2 Stakeholders
6.1.3 Waste Management Journey in Philadelphia
6.1.3.1 Waste Management Inc. and Covanta are the Key Vendors Handling Waste Management Activities in Philadelphia
6.1.3.2 Philadelphia is Paying Nearly USD 34.77 M to Its Waste Management Vendors in 2018
6.1.4 Waste Management Statistics
6.1.5 Waste Management Programs
6.1.6 Market Dynamics
6.1.7 Key Contacts in Philadelphia
6.2 Seattle
6.2.1 Seattle: Waste Volume Statistics
6.2.2 Staheholders
6.2.3 Waste Management Journey in Seattle
6.2.3.1 Waste Management Inc. and Recology are Seattle's Waste Management Partners for Nearly 20 Years Indicating Strong Association
6.2.4 Waste Management Statistics
6.2.5 Waste Management Programs
6.2.6 Market Dynamics
6.2.7 Key Contacts in Seattle
6.3 Los Angeles
6.3.1 Los Angeles: Waste Volume Statistics
6.3.1.1 Waste Diversion to Reach 1.58 M Tons By 2021
6.3.2 Stakeholders
6.3.3 Waste Management Journey in Los Angeles
6.3.4 Waste Management Statistics
6.3.5 Waste Management Programs
6.3.6 Market Dynamics
6.3.7 Key Contacts in Los Angeles
6.4 San Diego
6.4.1 San Diego: Waste Volume Statistics
6.4.1.1 Food and Organics Sectors to Contribute More Than 30% to the Total Waste Collected
6.4.2 Stakeholders
6.4.3 Waste Management Journey in San Diego
6.4.4 Waste Management Statistics
6.4.5 Waste Management Programs
6.4.6 Market Dynamics
6.4.7 Key Contacts: San Diego
6.5 Boston
6.5.1 Boston: Waste Volume Statistics
6.5.1.1 Boston Achieved 21% Residential & 25% Commercial Recycling Rates in Fy17
6.5.2 Stakeholders
6.5.3 Waste Management Journey in Boston
6.5.4 Waste Management Statistics
6.5.5 Waste Management Programs
6.5.6 Market Dynamics
7 Appendix
7.1 Philadelphia Appendix � Major Waste Categories
7.2 Seattle Appendix - Waste Segregation
7.3 Seattle Appendix � Vendor Compensation
7.4 LA Appendix� Citywide Curbside Recycling Program: Household Recyclable Materials Guide
7.5 San Diego Appendix � Franchised Hauler List
List of Tables (15 Tables)
Table 1 US Garbage Composition: By Waste Material Type, 2018
Table 2 Key Vendors Handling Waste Management Activities in Philadelphia Since 2012
Table 3 Bigbelly Program in Philadelphia: Indicating City�s Careful Planning
Table 4 Key Contacts in Philadelphia
Table 5 Seattle: Residential Programs (Single Family & Multifamily)
Table 6 Key Contacts in Seattle
Table 7 Major Disposal Facilities in Los Angeles
Table 8 Accounts Per Hauler
Table 9 Key Contacts in Los Angeles
Table 10 Key Contacts in San Diego
Table 11 Economical Benefits of Recycling
Table 12 Boston has Designed New Services, Rules and Outreach / Awareness Initiatives for Residential and Commercial Segments
Table 13 LA Appendix � Contractual Charges and Rates
Table 14 San Diego Appendix � Franchised Hauler List
Table 15 San Diego Appendix - Proposed Programs for 75% Diversion By 2020
List of Figures (32 Figures)
Figure 1 Breakdown of Primary Interviews: By Company, Designation, and Region
Figure 2 Promising Technologies in Global Smart Waste and Recycling
Figure 3 US Garbage Composition: By Waste Material Type, 2018 (% Share)
Figure 4 Waste Treatment Hierarchy in Sweden
Figure 5 Philadelphia Gross Municipal Waste, 2013-2017 (In Million Tons)
Figure 6 Philadelphia Waste Management Outlook (2014)
Figure 7 Philadelphia Waste Management Statistics (2016-2018)
Figure 8 Seattle Solid Waste Generated By Sector, 2011-2016 (Thousand Tons)
Figure 9 Seattle Waste Management By Method, 2011-2016 (Thousand Tons)
Figure 10 Solid Waste Fund, 2015-2018 (USD Million)
Figure 11 Cost Allocation By Segment (2017)
Figure 12 Cost Allocation By Expenses Head
Figure 13 Spending By Major Category (2017)
Figure 14 Seattle Waste Management Goals 2017-2022
Figure 15 Los Angeles Waste Generation By Segment (2013)
Figure 16 Los Angeles Waste Volume Statistics, 2017-2021 (Million Tons)
Figure 17 Los Angeles Waste Disposed By Locations (2016)
Figure 18 Los Angeles Commercial Waste Generated By Business Group (2014)
Figure 19 Los Angeles Solid Waste Collection and Disposal Budget (USD M), 2016-2019
Figure 20 Accounts (%) By Haulers
Figure 21 San Diego: Waste Disposal By Sector (2013)
Figure 22 San Diego: Waste Volume Statists, 2013
Figure 23 San Diego: Waste Volume Handled By Haulers in Commercial and Multi-Family Segments, 2013 (Thousand Tons)
Figure 24 San Diego Contribution of General Fund for Waste Collection, 2016-2018 (USD Million)
Figure 25 San Diego Automated Refuse Container Fund, 2016-2018 (USD Million)
Figure 26 San Diego Contribution of Enterprise Fund for Waste Management Initiatives, 2016-2018 (USD Million)
Figure 27 San Diego Zero Waste Goals (2020-2040)
Figure 29 Boston Residential Waste Management in Boston, 2013 � 2017 (Thousand Tons)
Figure 29 Boston Residential Disposal Composition By Type (2016)
Figure 30 Boston Commercial Disposal Composition By Type (2016)
Figure 31 Boston Waste Reduction Budget, 2013-2018 (USD Million)
Figure 32 Seattle Proposed Monthly Compensation to Waste Management Inc. for Waste Collection in 2019 (Total Collection Payment: USD 2.5m)
The study involved 4 major activities to estimate the current investments in the select major US cities for waste management systems. An exhaustive secondary research was done to collect information on the market, the peer markets, and the parent market. The next step was to validate these findings, assumptions, and sizing with the industry experts across the value chain through primary research. Both top-down and bottom-up approaches were employed to estimate the complete market size. Thereafter, the market breakdown and data triangulation procedures were used to estimate the market size of the segments and subsegments.
Secondary Research
In the secondary research process, various secondary sources such as D&B Hoovers, Bloomberg BusinessWeek, and Factiva have been referred to for identifying and collecting information for the study. The secondary sources included annual reports, press releases, and investor presentations of companies; whitepapers, certified publications, and articles by recognized authors; gold standard and silver standard websites; Research and Development (R&D) organizations; regulatory bodies; and databases.
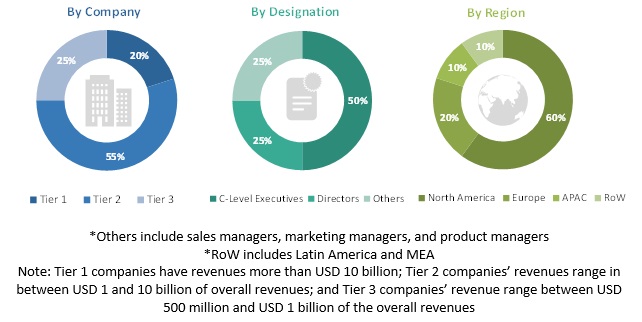
Primary Research
Various primary sources from both supply and demand sides of the waste management ecosystem were interviewed to obtain qualitative and quantitative information for the study. Primary sources from the supply-side included industry experts, such as Chief Executive Officers (CEOs), Vice Presidents (VPs), marketing directors, technology and innovation directors, and related key executives from various vendors that provide smart waste management systems operating in the targeted regions. All possible parameters that affect the market covered in the research study have been accounted for, viewed in extensive detail, verified through primary research, and analyzed to get the final quantitative and qualitative data.
Following is the profile breakup of the primary respondents:
To know about the assumptions considered for the study, download the pdf brochure
Market size Estimation
For making market estimation and forecasting the waste management opportunity assessment in US cities and the other dependent submarkets, top-down and bottom-up approaches were used. The bottom-up procedure was used to arrive at the overall investments in the market. The research methodology used to estimate the market size includes the following:
- Key players in the market were identified through extensive secondary research.
- The market size, in terms of value, was determined with the help of primary and secondary research processes.
- All percentage shares, splits, and breakups were determined using secondary sources and verified through primary sources.
Data Triangulation
With data triangulation and validation of data through primary interviews, the exact value of the overall parent market size was determined and confirmed using the study. The overall market size was then used in the top-down procedure to estimate the size of other individual markets via percentage splits of the market segmentation.
Report Objectives
- To define, describe, and forecast the development of waste management systems and smart waste management across select US cities
- To provide detailed information regarding the major factors, such as drivers, restraints, opportunities, and challenges, influencing the growth of the market
- To analyze the market�s subsegments with respect to individual growth trends, prospects, and contributions to the total market
- To analyze the opportunities in the market for stakeholders and provide the competitive landscape of the market
- To profile key players and comprehensively analyze their recent developments and positioning in the market
- To analyze competitive developments, such as acquisitions; new product launches and upgrades; partnerships, agreements, and collaborations; and business expansions, in the market
Available customizations
With the given market data, MarketsandMarkets offers customizations as per the company�s specific needs. The following customization options are available for the report:
Updated data of the above-mentioned cities along with recent developments around waste management practices


Growth opportunities and latent adjacency in Opportunity Assessment of Waste Management in US Cities