Optical Ceramics Market by Material (Sapphire, Aluminum Oxynitride, Spinel), End-use (Optics & Optoelectronics, Aerospace and Defense & Security, Energy), Region (North America, Europe, APAC, South America, Middle East & Africa) - Global Forecast to 2023


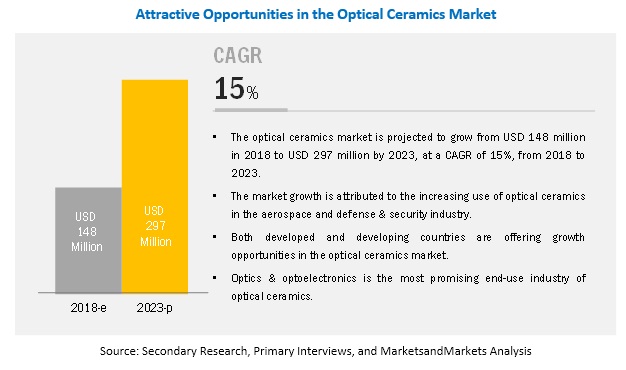
The optical ceramics market is projected to reach USD 297 million by 2023, at a CAGR of 15%. The high growth of niche applications consuming optical ceramics across the world, coupled with efficient and superior properties of optical ceramics, is driving the market.
Sapphire is expected to be the largest and fastest-growing segment of the market, by material, during the forecast period.
On the basis of material, the optical ceramics market has been categorized into sapphire, aluminum oxynitride, spinel, yttrium aluminum garnet (YAg), and others. Sapphire is projected to be the fastest-growing segment of the optical ceramics market during the forecast period, whereas yttrium aluminum garnet (YAG) is the second-fastest growing by material segment. Yttrium aluminum garnet is witnessing increasing demand in emerging applications including gas turbine engines, high intensity lamps, cathode ray tube, and manufacturing of lasers, which is expected to drive its growth in the optical ceramics market.
The optical ceramics market is witnessing significant growth due to the growing demand for optical ceramics in medical applications and the need for reducing the cost of production by deploying optical ceramics in high-temperature applications.
Optics & optoelectronics is expected to be the largest and fastest-growing end-use industry during the forecast period
The end-use industries of optical ceramics include optics & optoelectronics, aerospace and defense & security, energy, and others (medical imaging). The use of optical ceramics is increasing in the optics & optoelectronics segment as glasses & halides, sulfides, and selenides, which are used as an alternative to ceramics materials that have limited scope in this segment. Therefore, the demand for polycrystalline ceramics is increasing owing to their superior mechanical and optical properties.
Although optics & optoelectronics accounted for the largest market share in 2017 and is expected to be the fastest-growing segment during the forecast period; aerospace, the defense & security application segment is likely to hold tremendous opportunities for growth. This growth is attributed to the technological advancements and innovations in the defense & security equipment such as body armors & helmets and vehicle & aircraft.
North America is projected to be the largest market during the forecast period.
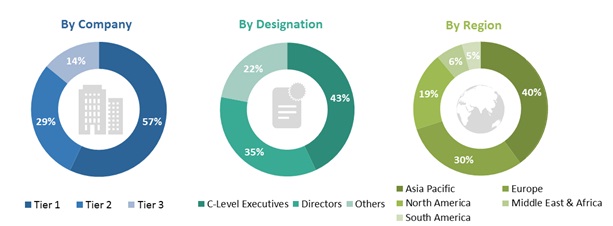
On the basis of region, the optical ceramics market has been segmented into APAC, Europe, North America, the Middle East & Africa, and South America. The growth of the optics & optoelectronics industry in the emerging economies is driving the market. APAC is projected to register the highest CAGR during the forecast period. This is attributed to the high economic growth rate, growing manufacturing sector, low-cost labor, and the global shift of the consumption and production capacities from the developed markets to the emerging markets in APAC.
Key Optical Ceramics Market Players
The key players profiled in this market are II-VI Optical Systems (US), CeraNova (US), CeramTec (Germany), Surmet Corporation (US), Schott AG (Germany), CoorsTek (US), Murata Manufacturing Co. Ltd. (Japan), Konoshima Chemicals Co. Ltd. (Japan), Kyocera (Japan), and Saint- Gobain (France).
These companies adopted various organic as well as inorganic growth strategies between 2013 and 2019 to strengthen their position in the market. Expansion was among the key growth strategies adopted by these leading players to enhance their regional presence and meet the growing demand for optical ceramics from emerging economies.
Optical Ceramics Market Report Scope
|
Report Metric |
Details |
|
Years considered for the study |
2016-2023 |
|
Base year |
2017 |
|
Forecast period |
2018-2023 |
|
Units considered |
Value (USD million) |
|
Segments |
Material, End-use industry, and Region |
|
Regions |
North America, APAC, Europe, Middle East & Africa, and South America |
|
Companies |
Total 10 major players covered: |
This research report categorizes the optical ceramics market based on material, end-use industry, and region.
On the basis of material, the optical ceramics market has been segmented as follows:
- Sapphire
- Aluminum Oxynitride
- Spinel
- Yttrium Aluminum Garnet
- Others
On the basis of end-use industry, the optical ceramics market has been segmented as follows:
- Optics & optoelectronics
- Aerospace and defense & Security
- Energy
- Others
On the basis of region, the optical ceramics market has been segmented as follows:
- Europe
- North America
- APAC
- Middle East & Africa
- South America
Recent Developments in Optical Ceramics Market
- In March 2019, Murata expanded its production facility in Okayama, Japan. The expansion helped in increasing the production capacity of ceramics to meet the increased demand for electronic components used in smartphones and other devices. This will play a significant role in strengthening the product portfolio of the company and emerge as a key manufacturer of optoelectronic components in the near future.
- In February 2019, Kyocera announced the acquisition of H.C. Starck Ceramics GmbH, a Germany-based manufacturer of advanced ceramics. The newly acquired company is expected to bring highly efficient production equipment using cutting-edge technologies, including Artificial Intelligence (AI).
- In June 2018, Kyocera set up a new manufacturing plant for ceramic microelectronic packages in Kagoshima, Japan. This new facility, which Kyocera plans to make operational in August 2019, will bring a 25% increase in the company's total production capacity for ceramic packages and allow the company to expand production for other items depending on future needs.
Critical Questions the Optical Ceramics Market Report Answers
- Are there any upcoming hot bets for the optical ceramics market?
- How are the market dynamics for different materials of optical ceramics?
- What are the upcoming opportunities for different materials of optical ceramics in emerging economies?
- What are the significant trends in end-use industries influencing the optical ceramics market?
- Who are the major manufacturers of optical ceramics?
- What are the factors governing the optical ceramics market in each region?
Frequently Asked Questions (FAQ):
How big is the optical ceramics market industry?
The optical ceramics market is projected to grow from USD 148 million in 2018 to USD 297 million by 2023, at a CAGR of 15%, between 2018 and 2023.
Who leading market players in optical ceramics industry?
The key players in the optical ceramics market include CeramTec (Germany), Schott AG (Germany), Surmet Corporation (US), II-VI Optical Systems (US), CeraNova (US), Kyocera (Japan), CoorsTek (US), Konoshima Chemicals (Japan), Saint- Gobain (France), and Murata Manufacturing (Japan). These players have established a strong foothold in the market by adopting strategies such as expansion, new product launch, and merger & acquisition.
To speak to our analyst for a discussion on the above findings, click Speak to Analyst
 Exclusive indicates content/data unique to MarketsandMarkets and not available with any competitors.
Table of Contents
1 Introduction (Page No. - 14)
1.1 Objectives of the Study
1.2 Market Definition
1.3 Market Scope
1.3.1 Optical Ceramics Market Segmentation
1.3.2 Regions Covered
1.3.3 Years Considered for the Study
1.4 Currency
1.5 Stakeholders
2 Research Methodology (Page No. - 17)
2.1 Research Data
2.1.1 Secondary Data
2.1.1.1 Key Data From Secondary Sources
2.1.2 Primary Data
2.1.2.1 Key Data From Primary Sources
2.1.2.2 Key Industry Insights
2.1.2.3 Breakdown of Primary Interviews
2.2 Market Size Estimation
2.2.1 Bottom-Up Approach
2.2.2 Top-Down Approach
2.3 Data Triangulation
2.4 Assumptions
2.5 Limitations
3 Executive Summary (Page No. - 25)
4 Premium Insights (Page No. - 28)
4.1 Attractive Opportunities in the Optical Ceramics Market
4.2 Optical Ceramics Market, By Material
4.3 Optical Ceramics Market, By Country
4.4 North America: Optical Ceramics Market, By End-Use Industry and Country
5 Market Overview (Page No. - 30)
5.1 Introduction
5.2 Market Dynamics
5.2.1 Drivers
5.2.1.1 Substitute to Glass, Metals, and Plastics
5.2.1.2 Increasing Defense Expenditure on Advanced Materials and Technologies
5.2.2 Restraints
5.2.2.1 High Cost of Optical Ceramics
5.2.3 Opportunities
5.2.3.1 Increasing Demand in Niche Applications
5.2.4 Challenges
5.2.4.1 Optical Ceramics Cannot Be Recycled and Repaired
5.3 Porter’s Five Forces Analysis
5.3.1 Bargaining Power of Suppliers
5.3.2 Bargaining Power of Buyers
5.3.3 Threat of New Entrants
5.3.4 Threat of Substitutes
5.3.5 Intensity of Competitive Rivalry
6 Optical Ceramics Market, By Type (Page No. - 35)
6.1 Introduction
6.2 Monocrystalline Optical Ceramics
6.3 Polycrystalline Optical Ceramics
7 Optical Ceramics Market, By Material (Page No. - 36)
7.1 Introduction
7.2 Sapphire
7.2.1 Innumerable Properties of Sapphire Contribute to Its Wide Use in Ceramics
7.3 Aluminum Oxynitride
7.3.1 Aluminum Oxynitride is Widely Used in Aerospace and Defense & Security End-Use Industries
7.4 Spinel
7.4.1 Presence of High Optical and Mechanical Properties in Spinel is Increasing Its Demand in Next-Generation Infrared Imaging Systems
7.5 Yttrium Aluminum Garnet (YAG)
7.5.1 Demand for YAG is Growing Because of Its Unique Homogeneous Optical Properties
7.6 Others
8 Optical Ceramics Market, By End-Use Industry (Page No. - 42)
8.1 Introduction
8.2 Optics & Optoelectronics
8.2.1 Increasing Use in Niche Applications is Driving the Market in This Segment
8.3 Aerospace and Defense & Security
8.3.1 Growing Technological Advancements in the Defense & Security Industry is A Major Market Driver
8.4 Energy
8.4.1 Low Thermal Expansion and Excellent Retention of Mechanical Properties at Elevated Temperatures Under High Pressures are the Factors Driving the Market in This Segment
8.5 Others
9 Optical Ceramics Market, By Region (Page No. - 46)
9.1 Introduction
9.2 North America
9.2.1 US
9.2.1.1 There is A High Demand for Optical Ceramics in the US Due to Expanding Niche Application Segments
9.2.2 Canada
9.2.2.1 Rising Demand for Optical Ceramics in Various Industries is Driving the Market
9.2.3 Mexico
9.2.3.1 Rapid Economic Expansion in Mexico is Expected to Drive the Market
9.3 Europe
9.3.1 Germany
9.3.1.1 Strong Manufacturing Base and Cost Efficiency are Driving the Market
9.3.2 Russia
9.3.2.1 Optics & Optoelectronics is the Fastest Growing End-Use Industry of Optical Ceramics in the Country
9.3.3 France
9.3.3.1 Economic Growth of the Country is Expected to Boost the Market in the Future
9.3.4 UK
9.3.4.1 UK’s Huge Aerospace Industry is Contributing to the Market Growth
9.3.5 Italy
9.3.5.1 Increasing Demand for Electronic Products is Boosting the Demand for Optical Ceramics
9.3.6 Spain
9.3.6.1 Innovations in the Optics & Optoelectronics Industry are Leading to an Increase in the Use of Optical Ceramics
9.3.7 Rest of Europe
9.4 APAC
9.4.1 China
9.4.1.1 Availability of Necessary Minerals for Manufacturing Optical Ceramics is Fueling the Market
9.4.2 Japan
9.4.2.1 Increasing Demand in Aerospace and Defense & Security Industry in the Country is Resulting in High Growth of the Optical Ceramics Market
9.4.3 South Korea
9.4.3.1 Strong Manufacturing Base for Electronic Devices and Components in the Country is Driving the Market
9.4.4 India
9.4.4.1 Rapid Growth in the Electrical & Electronics Industry is Boosting the Demand for Optical Ceramics
9.4.5 Taiwan
9.4.5.1 Fast Growing Electronics Industry and Large Consumer Base for Optical Ceramics is Driving the Demand
9.4.6 Rest of APAC
9.5 South America
9.5.1 Brazil
9.5.1.1 Growing Population, Improving Per Capita Income, and Stable Economic Growth are Likely to Drive the Market
9.5.2 Argentina
9.5.2.1 Increasing Demand for Optics & Optoelectronics Products is Expected to Drive the Optical Ceramics Market
9.5.3 Rest of South America
9.6 Middle East & Africa
9.6.1 Saudi Arabia
9.6.1.1 Current Economic Growth and the Growing Use of Electronic Devices Have Increased the Demand for Optical Ceramics
9.6.2 South Africa
9.6.2.1 Urbanization is the Major Market Driver in This Country
9.6.3 Rest of Middle East & Africa
10 Competitive Landscape (Page No. - 74)
10.1 Overview
10.2 Competitive Leadership Mapping, 2018
10.2.1 Terminology/Nomenclature
10.2.1.1 Visionary Leaders
10.2.1.2 Innovators
10.2.1.3 Dynamic Differentiators
10.2.1.4 Emerging Companies
10.2.2 Strength of Product Portfolio
10.2.3 Business Strategy Excellence
10.3 Market Ranking of Key Players, 2017
10.4 Competitive Scenario
10.4.1 New Product & New Technology Launch, 2013–2019
10.4.2 Expansion, 2013–2019
10.4.3 Merger & Acquisition, 2013–2019
11 Company Profiles (Page No. - 83)
(Business Overview, Products Offered, Recent Developments, SWOT Analysis, MnM View)*
11.1 II-VI Optical Systems
11.2 Ceranova
11.3 Ceramtec
11.4 Surmet Corporation
11.5 Schott AG
11.6 Coorstek
11.7 Murata
11.8 Konoshima Chemicals
11.9 Kyocera
11.10 Saint-Gobain
*Details on Business Overview, Products Offered, Recent Developments, SWOT Analysis, MnM View Might Not Be Captured in Case of Unlisted Companies.
11.11 Other Players
11.11.1 Advanced Ceramic Manufacturing
11.11.2 Blasch Precision Ceramics
11.11.3 Ceradyne, Inc.
11.11.4 Mcdanel Advanced Ceramic Technologies
11.11.5 Rauschert GmbH
11.11.6 Siccas
11.11.7 Ird Glass
11.11.8 Cilas
11.11.9 Applied Ceramics
11.11.10 Rayotek Scientific Inc.
12 Appendix (Page No. - 107)
12.1 Discussion Guide
12.2 Knowledge Store: Marketsandmarkets Subscription Portal
12.3 Available Customizations
12.4 Related Reports
12.5 Author Details
List of Tables (61 Figures)
Table 1 Optical Ceramics Market Size, By Material, 2016-2023 (USD Thousand)
Table 2 Sapphire Market Size for Optical Ceramics, By Region, 2016-2023 (USD Thousand)
Table 3 Aluminum Oxynitride Market Size for Optical Ceramics, By Region, 2016-2023 (USD Thousand)
Table 4 Spinel Market Size for Optical Ceramics, By Region, 2016-2023 (USD Thousand)
Table 5 Yttrium Aluminum Garnet Market Size for Optical Ceramics, By Region, 2016-2023 (USD Thousand)
Table 6 Others Market Size for Optical Ceramics, By Region, 2016-2023 (USD Thousand)
Table 7 Optical Ceramics Market Size, By End-Use Industry, 2016–2023 (USD Thousand)
Table 8 Optical Ceramics Market Size in Optics & Optoelectronics End-Use Industry, By Region, 2016–2023 (USD Thousand)
Table 9 Optical Ceramics Market Size in Aerospace and Defense & Security End-Use Industry, By Region, 2016–2023 (USD Thousand)
Table 10 Optical Ceramics Market Size in Energy End-Use Industry, By Region, 2016–2023 (USD Thousand)
Table 11 Optical Ceramics Market Size in Other End-Use Industries, By Region, 2016–2023 (USD Thousand)
Table 12 Optical Ceramics Market Size, By Region, 2016–2023 (USD Thousand)
Table 13 North America: Optical Ceramics Market Size, By Country, 2016–2023 (USD Thousand)
Table 14 North America: Glass Ceramics Market Size, By Material, 2016–2023 (USD Thousand)
Table 15 North America: Optical Ceramics Market Size, By End-Use Industry, 2016–2023 (USD Thousand)
Table 16 North America: Glass Ceramics Market Size in Optics & Optoelectronics Industry, By Country, 2016–2023 (USD Thousand)
Table 17 North America: Optical Ceramics Market Size in Aerospace and Defense & Security Industry, By Country, 2016–2023 (USD Thousand)
Table 18 North America: Glass Ceramics Market Size Energy in Industry, By Country, 2016–2023 (USD Thousand)
Table 19 North America: Optical Ceramics Market Size in Others Industry, By Country, 2016–2023 (USD Thousand)
Table 20 US: Optical Ceramics Market Size, By End-Use Industry, 2016–2023 (USD Thousand)
Table 21 Canada: Optical Ceramics Market Size, By End-Use Industry, 2016–2023 (USD Thousand)
Table 22 Mexico: Glass Ceramics Market Size, By End-Use Industry, 2016–2023 (USD Thousand)
Table 23 Europe: Optical Ceramics Market Size, By Country, 2016–2023 (USD Thousand)
Table 24 Europe: Glass Ceramics Market Size, By Material, 2016–2023 (USD Thousand)
Table 25 Europe: Glass Ceramics Market Size, By End-Use Industry, 2016–2023 (USD Thousand)
Table 26 Europe: Optical Ceramics Market Size in Optics & Optoelectronics Industry, By Country, 2016–2023 (USD Thousand)
Table 27 Europe: Glass Ceramics Market Size in Aerospace and Defense & Security Industry, By Country, 2016–2023 (USD Thousand)
Table 28 Europe: Optical Ceramics Market Size in Energy Industry, By Country, 2016–2023 (USD Thousand)
Table 29 Europe: Glass Ceramics Market Size in Others Industry, By Country, 2016–2023 (USD Thousand)
Table 30 Germany: Optical Ceramics Market Size, By End-Use Industry, 2016–2023 (USD Thousand)
Table 31 Russia: Glass Ceramics Market Size, By End-Use Industry, 2016–2023 (USD Thousand)
Table 32 France: Optical Ceramics Market Size, By End-Use Industry, 2016–2023 (USD Thousand)
Table 33 UK: Glass Ceramics Market Size, By End-Use Industry, 2016–2023 (USD Thousand)
Table 34 Italy: Optical Ceramics Market Size, By End-Use Industry, 2016–2023 (USD Thousand)
Table 35 Spain: Glass Ceramics Market Size, By End-Use Industry, 2016–2023 (USD Thousand)
Table 36 Rest of Europe: Optical Ceramics Market Size, By End-Use Industry, 2016–2023 (USD Thousand)
Table 37 APAC: Optical Ceramics Market Size, By Country, 2016–2023 (USD Thousand)
Table 38 APAC: Glass Ceramics Market Size, By Material, 2016–2023 (USD Thousand)
Table 39 APAC: Glass Ceramics Market Size, By End-Use Industry, 2016–2023 (USD Thousand)
Table 40 APAC: Optical Ceramics Market Size in Optics & Optoelectronics Industry, By Country, 2016–2023 (USD Thousand)
Table 41 APAC: Glass Ceramics Market Size in Aerospace and Defense & Security, Industry, By Country, 2016–2023 (USD Thousand)
Table 42 APAC: Optical Ceramics Market Size in Energy Industry, By Country, 2016–2023 (USD Thousand)
Table 43 APAC: Glass Ceramics Market Size in Others Industry, By Country, 2016–2023 (USD Thousand)
Table 44 China: Optical Ceramics Market Size, By End-Use Industry, 2016–2023 (USD Thousand)
Table 45 Japan: Optical Ceramics Market Size, By End-Use Industry, 2016–2023 (USD Thousand)
Table 46 South Korea: Glass Ceramics Market Size, By End-Use Industry, 2016–2023 (USD Thousand)
Table 47 India: Optical Ceramics Market Size, By End-Use Industry, 2016–2023 (USD Thousand)
Table 48 Taiwan: Optical Ceramics Market Size, By End-Use Industry, 2016–2023 (USD Thousand)
Table 49 Rest of APAC: Glass Ceramics Market Size, By End-Use Industry, 2016–2023 (USD Thousand)
Table 50 South America: Optical Ceramics Market Size, By Country, 2016–2023 (USD Thousand)
Table 51 South America: Glass Ceramics Market Size, By Material, 2016–2023 (USD Thousand)
Table 52 South America: Optical Ceramics Market Size, By End-Use Industry, 2016–2023 (USD Thousand)
Table 53 Brazil: Glass Ceramics Market Size, By End-Use Industry, 2016–2023 (USD Thousand)
Table 54 Argentina: Optical Ceramics Market Size, By End-Use Industry, 2016–2023 (USD Thousand)
Table 55 Rest of South America: Optical Ceramics Market Size, By End-Use Industry, 2016–2023 (USD Thousand)
Table 56 Middle East & Africa: Glass Ceramics Market Size, By Country, 2016–2023 (USD Thousand)
Table 57 Middle East & Africa: Optical Ceramics Market Size, By Material, 2016–2023 (USD Thousand)
Table 58 Middle East & Africa: Glass Ceramics Market Size, By End-Use Industry, 2016–2023 (USD Thousand)
Table 59 Saudi Arabia: Optical Ceramics Market Size, By End-Use Industry, 2016–2023 (USD Thousand)
Table 60 South Africa: Optical Ceramics Market Size, By End-Use Industry, 2016–2023 (USD Thousand)
Table 61 Rest of Middle East & Africa: Optical Ceramics Market Size, By End-Use Industry, 2016–2023 (USD Thousand)
List of Figures (33 Figures)
Figure 1 Optical Ceramics Market: Research Design
Figure 2 Optical Ceramics Market: Bottom-Up Approach
Figure 3 Optical Ceramics Market: Top-Down Approach
Figure 4 Optical Ceramics Market: Data Triangulation
Figure 5 Sapphire Led the Optical Ceramics Market in 2017
Figure 6 Optics & Optoelectronics to Be the Fastest-Growing End-Use Industry of Optical Ceramics
Figure 7 APAC to Be the Fastest-Growing Optical Ceramics Market
Figure 8 Increasing Use of Optical Ceramics in Optics & Optoelectronics Industry to Boost the Market
Figure 9 Sapphire to Be the Largest Material for Optical Ceramics
Figure 10 China to Register the Highest CAGR
Figure 11 Optics & Optoelectronics Segment and US Accounted for the Largest Market Share
Figure 12 Drivers, Restraints, Opportunities, and Challenges in the Optical Ceramics Market
Figure 13 Optical Ceramics Market: Porter’s Five Forces Analysis
Figure 14 Sapphire Segment to Lead the Optical Ceramics Market
Figure 15 Optics & Optoelectronics to Lead the Optical Ceramics Market
Figure 16 APAC to Lead the Optical Ceramics Market
Figure 17 Optical Ceramics Market in China to Register the Highest CAGR (2018-2023)
Figure 18 North America: Optical Ceramics Market Snapshot
Figure 19 Europe: Optical Ceramics Market Snapshot
Figure 20 APAC: Optical Ceramics Market Snapshot
Figure 21 Companies Adopted Expansion and Merger & Acquisition as the Key Strategies Between 2013 and 2019
Figure 22 Optical Ceramics Market: Competitive Leadership Mapping, 2018
Figure 23 Market Ranking, 2017
Figure 24 II-VI Optical Systems: SWOT Analysis
Figure 25 Ceranova: SWOT Analysis
Figure 26 Ceramtec: Company Snapshot
Figure 27 Ceramtec: SWOT Analysis
Figure 28 Surmet Corporation: SWOT Analysis
Figure 29 Schott AG: Company Snapshot
Figure 30 Schott AG: SWOT Analysis
Figure 31 Murata: Company Snapshot
Figure 32 Kyocera: Company Snapshot
Figure 33 Saint-Gobain: Company Snapshot
The study involves four major activities in estimating the current market size of optical ceramics. Exhaustive secondary research was carried out to collect information on the market, the peer market, and the parent market. The next step was to validate these findings, assumptions, and sizing with industry experts across the value chain through primary research. Both top-down and bottom-up approaches were employed to estimate the complete market size. After that, the market breakdown and data triangulation methodologies were used to estimate the market size of segments and subsegments.
Optical Ceramics Market Secondary Research
In the secondary research process, various secondary sources, such as Hoovers and Bloomberg BusinessWeek, were referred to, to identify and collect information for this study. Secondary sources such as annual reports, press releases & investor presentations of companies, white papers, certified publications, articles by recognized authors, gold standard & silver standard websites, optical ceramics organizations, regulatory bodies, and databases were also referred.
Optical Ceramics Market Primary Research
The optical ceramics market comprises several stakeholders such as raw material suppliers, distributors of optical ceramics, optical ceramics associations, end-product manufacturers, and regulatory organizations in the supply chain. The demand side of this market consists of optoelectronics and aerospace and defense & security industries. Various primary sources from both the supply and demand sides of the market were interviewed to obtain qualitative and quantitative information. Following is the breakdown of primary interviews
To know about the assumptions considered for the study, download the pdf brochure
Optical Ceramics Market Size Estimation
Both top-down and bottom-up approaches were used to estimate and validate the total size of the optical ceramics market. These methods were also used extensively to estimate the size of various subsegments in the market. The research methodology used to estimate the market size included the following:
- The key players in the industry and markets were identified through extensive secondary research.
- The industry’s supply chain and market size, in terms of value, were determined through primary and secondary research processes.
- All percentage shares, splits, and breakdowns were determined using secondary sources and verified through primary sources.
Optical Ceramics Market Data Triangulation
After arriving at the overall market size-using the market size estimation processes as explained above-the market was split into several segments and subsegments. In order to complete the overall market engineering process and arrive at the exact statistics of each market segment and subsegment, the data triangulation and market breakdown procedures were employed, wherever applicable. The data was triangulated by studying various factors and trends from both the demand and supply sides, in the optics & optoelectronics, aerospace and defense & security, and energy end-use industries.
Optical Ceramics Market Objectives of the Study
- To define, describe, and forecast the optical ceramics market on the basis of material, end-use industry, and region
- To forecast the market size, in terms of value, of segments with respect to five key regions (along with their countries) namely, North America, Europe, Asia Pacific (APAC), the Middle East & Africa, and South America
- To strategically analyze the market segments with respect to material and end-use industry
- To provide detailed information regarding the key factors (drivers, restraints, opportunities, and challenges) influencing the growth of the market
- To analyze the opportunities in the market for stakeholders and draw a competitive landscape for market leaders
- To track and analyze competitive developments, such as joint venture, merger & acquisition, and new product launch in the optical ceramics market
- To strategically profile key players and their core competencies in the market
Note: Core competencies of companies are determined in terms of the key developments, SWOT analysis, and key strategies adopted by them to sustain in the market.
Optical Ceramics Market Report Available Customizations
MarketsandMarkets offers customizations according to the specific needs of the companies along with the market data. The following customization options are available for this report:
Optical Ceramics Market Product Analysis
- A product matrix that provides a detailed comparison of the product portfolio of each company
Optical Ceramics Market Regional Analysis
- Further breakdown of the Rest of APAC and Rest of Europe optical ceramics markets
Optical Ceramics Market Company Information
- Detailed analysis and profiles of additional market players


Growth opportunities and latent adjacency in Optical Ceramics Market