The study involved four major activities in estimating the current size of the organic fertilizers market. Exhaustive secondary research was done to collect information on the market, peer, and parent markets. The next step was to validate these findings, assumptions, and sizing with industry experts across the value chain through primary research. Both top-down and bottom-up approaches were employed to estimate the complete market size. After that, market breakdown and data triangulation were used to estimate the market size of segments and subsegments.
Secondary Research
This research study involved the extensive use of secondary sources—directories and databases such as Bloomberg Businessweek and Factiva—to identify and collect information useful for a technical, market-oriented, and commercial study of the organic fertilizer market.
In the secondary research process, various sources such as annual reports, press releases & investor presentations of companies, white papers, certified publications, articles from recognized authors, gold & silver standard websites, directories, and databases were referred to identify and collect information. This research study involved the extensive use of secondary sources—directories and databases such as Bloomberg Businessweek and Factiva—to identify and collect information useful for a technical, market-oriented, and commercial study of the organic fertilizers market.
Secondary research was mainly used to obtain key information about the industry’s supply chain, the total pool of key players, and market classification and segmentation as per the industry trends to the bottom-most level, regional markets, and key developments from both market- and technology-oriented perspectives.
Primary Research
Extensive primary research was conducted after obtaining information regarding the organic fertilizers market scenario through secondary research. Several primary interviews were conducted with market experts from both the demand and supply sides across major countries of North America, Europe, Asia Pacific, the Middle East & Africa, and South America. Primary data was collected through questionnaires, emails, and telephonic interviews. The primary sources from the supply side included various industry experts, such as Chief X Officers (CXOs), Vice Presidents (VPs), Directors from business development, marketing, research, and development teams, and related key executives from distributors and key opinion leaders. Primary interviews were conducted to gather insights such as market statistics, data on revenue collected from the products and services, market breakdowns, market size estimations, market forecasting, and data triangulation. Primary research also helped in understanding the various trends related to crop type, source, form, and region.

To know about the assumptions considered for the study, download the pdf brochure
Organic Fertilizers Market Size Estimation
Both the top-down and bottom-up approaches were used to estimate and validate the total size of the Organic Fertilizer Market. These approaches were also used extensively to estimate the size of various dependent submarkets. The research methodology used to estimate the market size includes the following:
-
Key players were identified through extensive secondary research.
-
Primary and secondary research determined the industry’s value chain and market size.
-
All percentage share splits and breakdowns were determined using secondary sources and verified through primary sources.
-
All the possible parameters that affect the markets covered in this research study were accounted for, viewed in extensive detail, verified through primary research, and analyzed to obtain the final quantitative and qualitative data.
-
The following figure provides an illustrative representation of the complete market size estimation process implemented in this research study for an overall estimation of the market in a consolidated format.
The following sections (bottom-up & top-down) depict the overall market size estimation process employed for the purpose of this study.
Global Organic Fertilizers Market: Bottom-Up Approach

To know about the assumptions considered for the study, Request for Free Sample Report
Global Organic Fertilizers Market: Top-Down Approach

Data Triangulation
After arriving at the overall market size from the estimation process explained above, the total market was split into several segments and subsegments. Data triangulation and market breakdown procedures were employed, wherever applicable, to estimate the overall organic fertilizers market and arrive at the exact statistics for all segments and subsegments. The data was triangulated by studying various factors and trends from the demand and supply sides. The market size was also validated using both the top-down and bottom-up approaches.
Market Definition
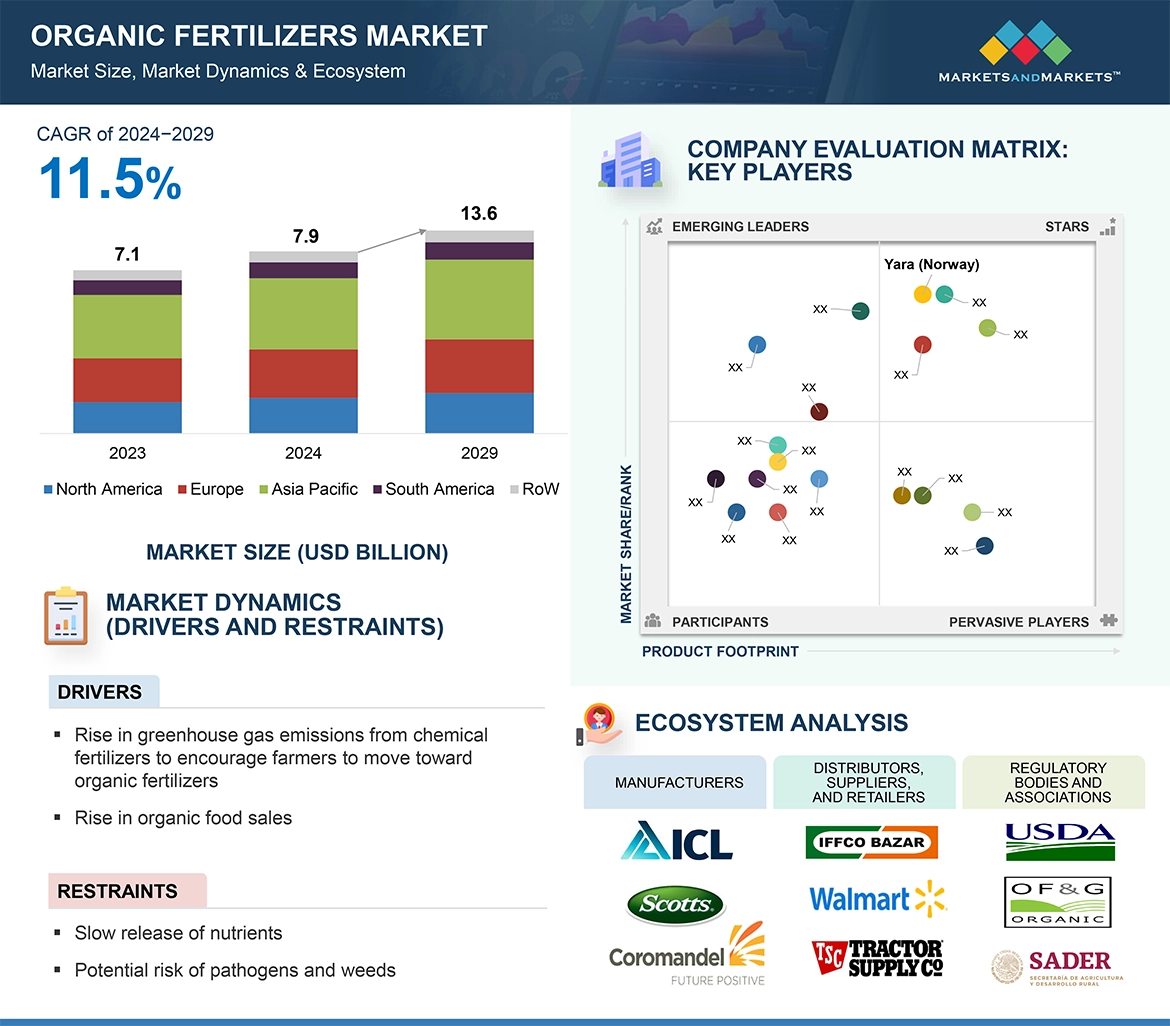
According to the definition given by the International Fertilizer Industry Association (IFA), “fertilizers are any solid, liquid or gaseous substances containing one or more plant nutrients, which are either applied to the soil, directly on the plant (foliage) or added to aqueous solutions (fertigation), in order to maintain soil fertility, improve crop development, yield and crop quality.” Organic fertilizers refer to categories of fertilizers that are produced from naturally derived components and do not include synthetic chemicals or materials in their preparation.
For this study, the global organic fertilizers market is defined as the market for commercially produced, naturally derived fertilizers that are certified “organic” by credible, relevant, and respective regulatory authorities pertaining to their jurisdiction, across the globe.
Key Stakeholders
-
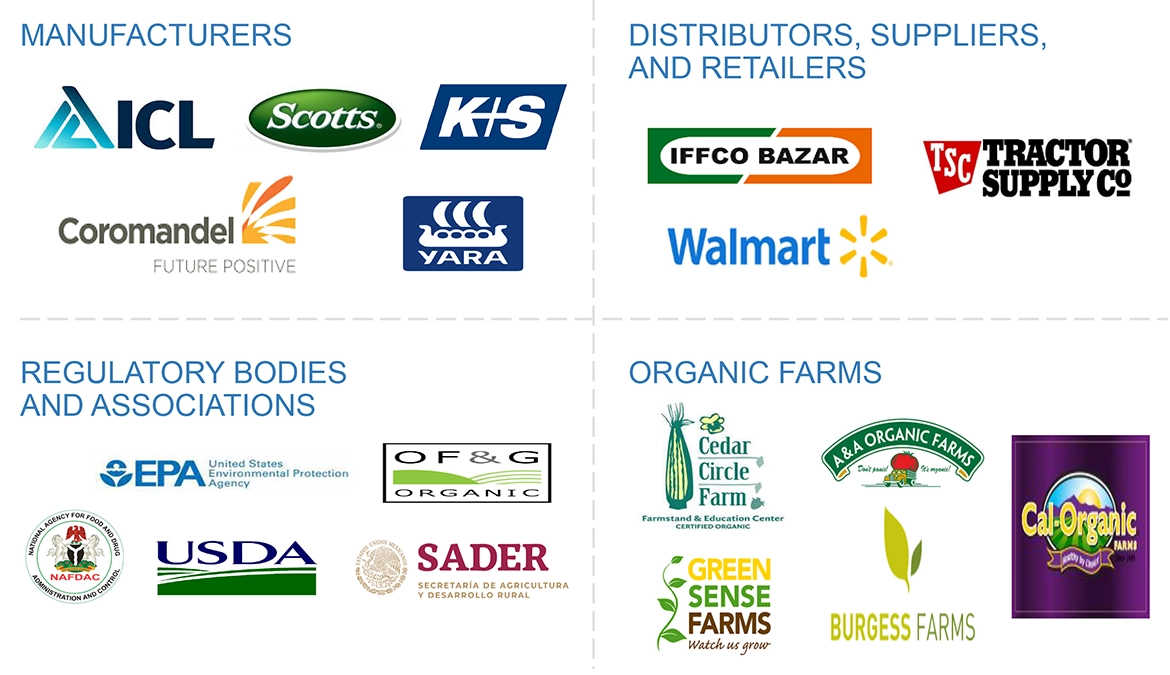
Manufacturers, dealers, and suppliers of organic fertilizers
-
Government bodies
-
Farmers (Growers)
-
Intermediate suppliers, such as retailers, wholesalers, and distributors
-
Raw material suppliers
-
Technology providers
-
Industry associations
-
Regulatory bodies and institutions
-
World Health Organization (WHO)
-
US Food and Drug Administration (FDA)
-
Codex Alimentarius Commission (CAC)
-
EUROPA
-
United States Department of Agriculture (USDA)
-
International Fertilizer Society (IFS)
-
Research Institute of Organic Agriculture (FiBL)
-
Logistic providers & transporters
-
Research institutes and organizations
-
Consulting companies/consultants in the agricultural and animal farming technology sectors
Organic Fertilizers Market Report Objectives
Market Intelligence
-
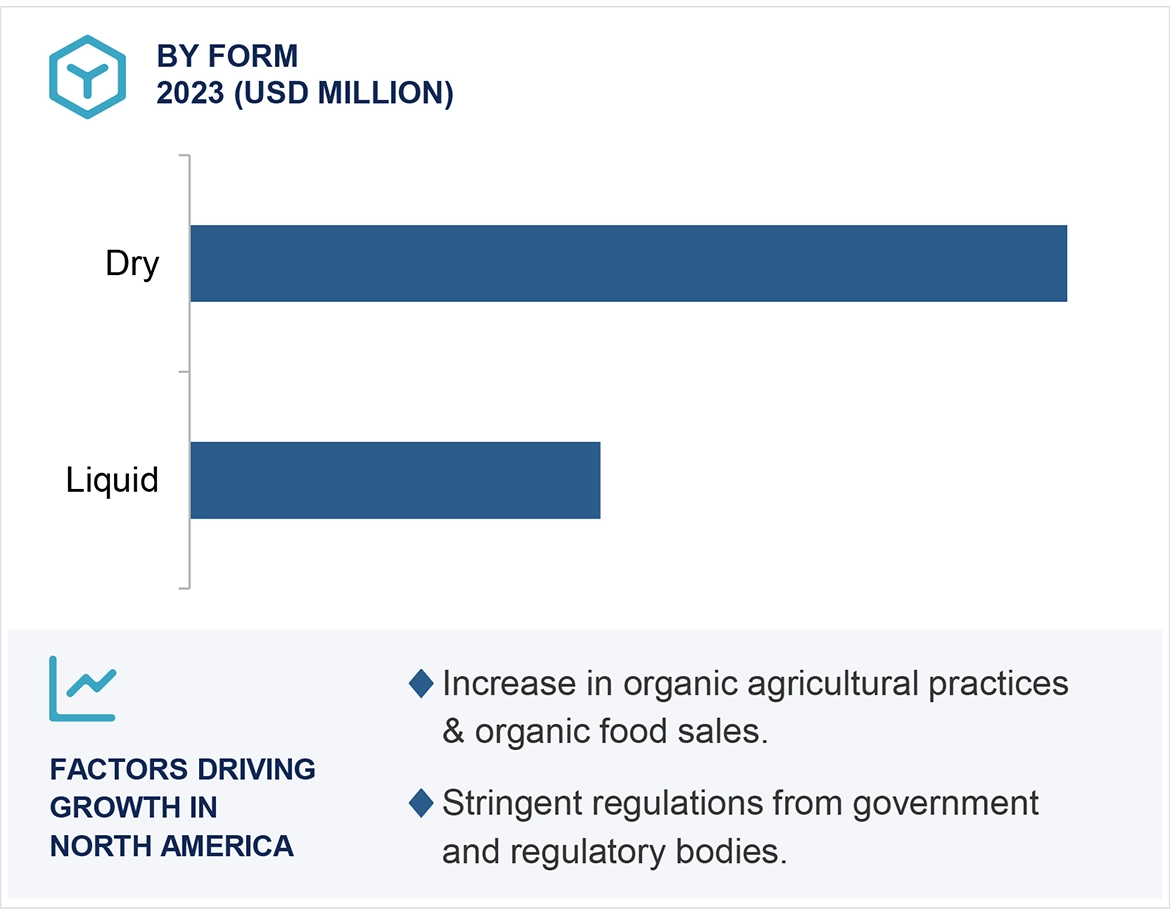
Determining and projecting the size of the organic fertilizer market with respect to crop type, source, form, and region.
-
Identifying the attractive opportunities in the market by determining the largest and fastest-growing segments
-
Providing detailed information about the key factors influencing the market growth (drivers, restraints, opportunities, and industry-specific challenges)
-
Providing the regulatory framework and market entry process related to the market.
-
Analyzing the micro markets with respect to individual growth trends, prospects, and their contribution to the total market.
Competitive Intelligence
-
Identifying and profiling the key players in the organic fertilizers market
-
Providing a comparative analysis of market leaders based on the following:
-
Product offerings
-
Business strategies
-
Strengths and weaknesses
-
Key financials
-
Understanding the competitive landscape and identifying the major growth strategies players across the country adopt.
-
Providing insights on key product innovations and investments in the organic fertilizer market.
Available Customizations:
With the given market data, MarketsandMarkets offers customizations according to company-specific scientific needs.
The following customization options are available for the report:
Product Analysis
-
Product Matrix, which gives a detailed comparison of the product portfolio of each company.
Organic Fertilizers Market: Geographic Analysis
With the given market data, MarketsandMarkets offers customizations according to company-specific scientific needs.
-
Further breakdown of the Rest of Europe into Austria, Sweden, Switzerland, Greece, Romania, Luxembourg, Poland, and other EU & non-EU countries.
-
Further breakdown of the Rest of Asia Pacific into Kazakhstan, Vietnam, and Republic of Korea.
-
Further breakdown of the Rest of South America into Uruguay, Peru, Ecuador, Paraguay, Colombia, and other South American countries.
Company Information
-
Detailed analyses and profiling of additional market players (up to five)


Growth opportunities and latent adjacency in Organic Fertilizers Market