Paper Chemicals Market by Type (Process Chemicals, Pulp Chemicals, and Functional Chemicals), Type (Specialty and Commodity), Application (Papermaking, Pulp Manufacturing, and Water & Process Treatment), and by Region - Global Forecast to 2031

icon1
USD 51.51 Billion
MARKET SIZE, 2031
icon2
CAGR 1.3%
(2026-2031)
icon3
250
REPORT PAGES
icon4
220
MARKET TABLES

OVERVIEW

paper-chemical-market Overview

Source: Secondary Research, Interviews with Experts, MarketsandMarkets Analysis

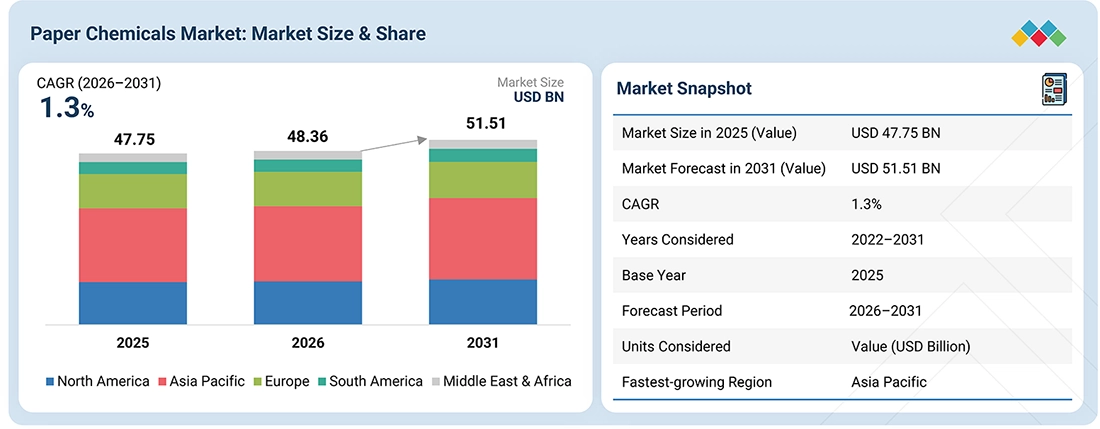
The paper chemicals market is projected to grow from USD 48.36 billion in 2026 to USD 51.51 billion by 2031, at a CAGR of 1.3% during the forecast period. The paper chemicals market is anticipated to experience substantial growth during the forecast period, as the surge in the demand for paper-based packaging products, as businesses and consumers make a move towards recyclable and fiber-based packaging products over plastic, is expected to drive the market for paper chemicals. Strength, softness, absorbency, retention, and process chemicals are also being utilized to meet rising demand for tissue and hygiene papers. Increasing use of recycled fiber is generating new requirements for chemicals for deinking, retention, drainage, removal of contaminants and enhancement of strength. Other developing economies such as Asia Pacific are anticipated to further drive the expansion of pulp and paper production, thereby leading to more consumption of chemicals. ;

KEY TAKEAWAYS

  • By Region
    Asia Pacific dominated the paper chemicals market, with a share of 43.0% in 2025.
  • By Type
    By type, functional chemicals segment is expected to be the leading segment, in terms of value.
  • By Form
    By form, the specialty segment is expected to be the leading segment in terms of value.
  • By Application
    By application, the papermaking segment is expected to dominate the market, in terms of value.
  • Competitive Landscape - Key Players
    Solenis, Kemira, Ecolab Inc., Buckman, and Nouryon were identified as star players in the paper chemicals market. These companies maintain strong market positions through broad product portfolios covering pulp manufacturing, papermaking, and water & process treatment, extensive manufacturing and distribution networks, technological expertise, and established relationships with major pulp and paper manufacturers.
  • Competitive Landscape- Startups
    Aahan Chemiex LLP, NNOWETA Performance Chemicals Pvt. Ltd, Papertex Speciality Chemicals Pvt. Ltd., among others, have distinguished themselves among startups and SMEs. These companies are expanding their presence through specialized paper chemicals, customized formulations, regional manufacturing capabilities, and solutions focused on improving paper quality, process efficiency, and sustainability.

High performance papers are also motivating the use of specialty chemicals for increased strength, ease of printing and surface characteristics, and barrier properties. Sustainability laws and plastic reduction programs are also fueling the growth of water-based, bio-based and recyclable chemical solutions. Additionally, paper mills are continuing to develop new chemicals for use in the process to achieve greater efficiency, lower water and energy use, and lower production costs, which will contribute to continued market growth.

TRENDS & DISRUPTIONS IMPACTING CUSTOMERS' CUSTOMERS

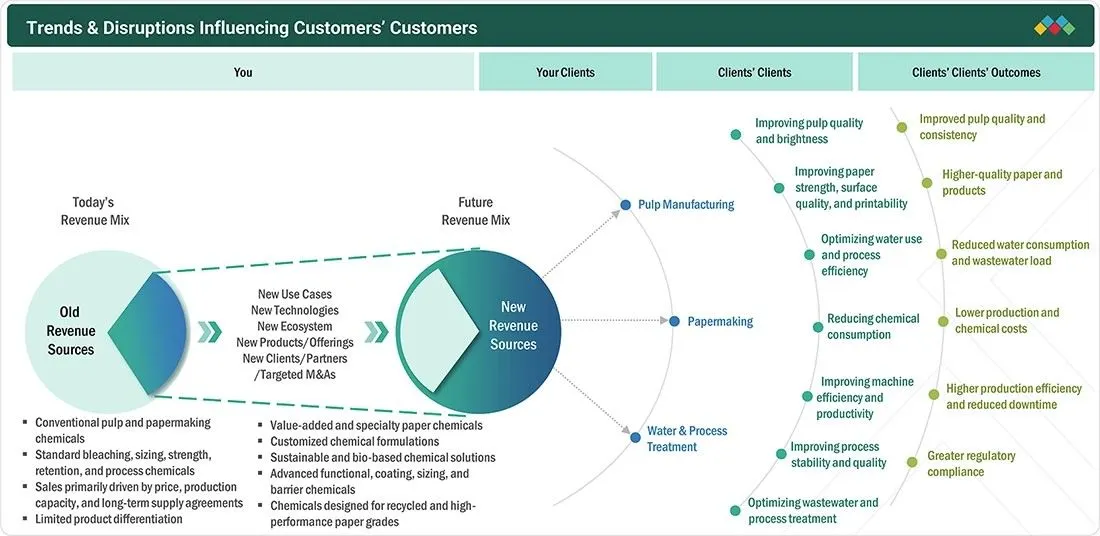
The market is changing and moving toward sustainable chemicals to meet environmental regulations and demand from the paper industry to produce sustainable packaging. Increased usage of recycled fibers and fiber-based packaging is driving more demand for more advanced chemical solutions to retain, strengthen, barrier, coat, and remove contaminants from recycled fibers. Inefficient and unreliable supplies of raw materials, chemicals, energy, and global supply chains can cause production costs to rise and cause supply uncertainty for manufacturers and paper mills. New opportunities are emerging in the field of functional coatings, digital process optimization and repulpable barrier technologies, which are demanding chemical suppliers to continually develop their product portfolios.

paper-chemical-market Disruptions

Source: Secondary Research, Interviews with Experts, MarketsandMarkets Analysis

MARKET DYNAMICS

Drivers
Impact
Level
  • Expansion of paper, pulp and paperboard production
  • Expansion of tissue and hygiene paper applications
RESTRAINTS
Impact
Level
  • Volatility in raw-material prices
  • Environmental and regulatory restrictions
OPPORTUNITIES
Impact
Level
  • Growth in emerging markets
  • Development of sustainable paper chemicals
CHALLENGES
Impact
Level
  • Supply-chain disruptions and geopolitical risks
  • Strong competition among global and regional companies

Source: Secondary Research, Interviews with Experts, MarketsandMarkets Analysis

Driver: Expansion of tissue and hygiene paper applications

With the new uses of tissue and hygiene paper, there is a greater need for new and improved strength, softness, absorbency, bulk, formation, and machine-efficiency paper chemicals. Tissue products like toilet paper, facial tissue, kitchen towels and hand towels, napkins, and industrial wipers are very common products in households, healthcare, foodservice, and industrial applications. Optimization of product performance and production efficiency is achieved with chemical additives such as strength agents, debonders, retention and drainage aids, creping chemicals, and defoamers. Tissue paper production grew by 8.149 million tonnes in 2024 to 8.163 million tonnes in 2025, and apparent consumption rose by 1.1%, to 8.427 million tonnes. The use of tissue in various applications, such as hygiene, is increasing, which is opening new opportunities for chemical suppliers to offer solutions that combine softness, strength, absorbency, and resource efficiency.

Restraint: Volatility in raw-material prices

The price and availability of petrochemical feedstocks, inorganic chemicals, natural and synthetic polymers, energy, and other chemical intermediates are subject to fluctuation for paper chemical manufacturers, which can impact the price of products like retention aids, strength additives, coatings, and sizing chemicals. The volatility of crude oil, natural gas, energy, and freight prices will add to manufacturing and transportation expenses, and geopolitical tensions and supply disturbances will drive additional volatility. The ups and downs may lead to margin pressure if manufacturers are not able to fully pass on higher input costs. Paper mills can also turn down rises in prices due to variations in the cost of their pulp, energy, transportation and operating expenses. Limited suppliers and supply shortages for critical raw materials can also pose risks to procurement and production.

Opportunity: Growth in emerging markets

Emerging economies such as Asia Pacific and Latin America are rapidly growing and seeing a rise in packaging, tissue, and hygiene paper consumption due to rapid industrialization, urbanization, increasing consumer spending, and increasing hygiene awareness. China and India are significant growth markets with extensive paper production, growing packaging markets and investments in production capacity. Increased modernization of paper mills is driving up the requirement for chemicals employed in the size, strength, retention and drainage, coating, deinking, contaminant control, defoaming, microbiological control, and bleaching. Paper chemicals will continue to grow as manufacturers expand production and begin using higher-value packaging and specialty grades, which will result in higher demand not just in quantity, but also in the amount of chemicals used per tonne of paper produced.

Challenge: Supply-chain disruptions and geopolitical risks

The paper chemical segment has a global and interdependent supply chain, which makes the market prone to the geopolitical conflicts, trade restrictions, logistics disruption, natural disasters, and supplier shutdown. Relying upon a particular raw material or a single source of raw materials can also add to supply availability and procurement risks, which can impact production continuity and customer deliveries. When energy markets and/or shipping routes are disrupted, manufacturing, freight, and operating costs are likely to rise, which can lead to higher chemical prices. The challenges may be especially severe for paper mills that run 24 hours a day, as shortages of critical chemicals can impact production schedules, product quality, wastewater treatment systems, and machine efficiencies.

PAPER CHEMICALS MARKET: COMMERCIAL USE CASES ACROSS INDUSTRIES

COMPANY USE CASE DESCRIPTION BENEFITS
company logo
Solenis helped a North American fine paper mill replace its existing, less-efficient sizing agent with Hercon 620 sizing agent to improve control of sizing performance, reduce chemical loading, and address deposition and foam issues. The solution reduced chemical loading and deposition potential, improved sizing consistency, reduced foam and defoamer requirements, and lowered the number of truck deliveries due to higher product solids. The mill achieved 15% annual cost savings and reduced its transportation-related carbon footprint.

Logos and trademarks shown above are the property of their respective owners. Their use here is for informational and illustrative purposes only.

MARKET ECOSYSTEM

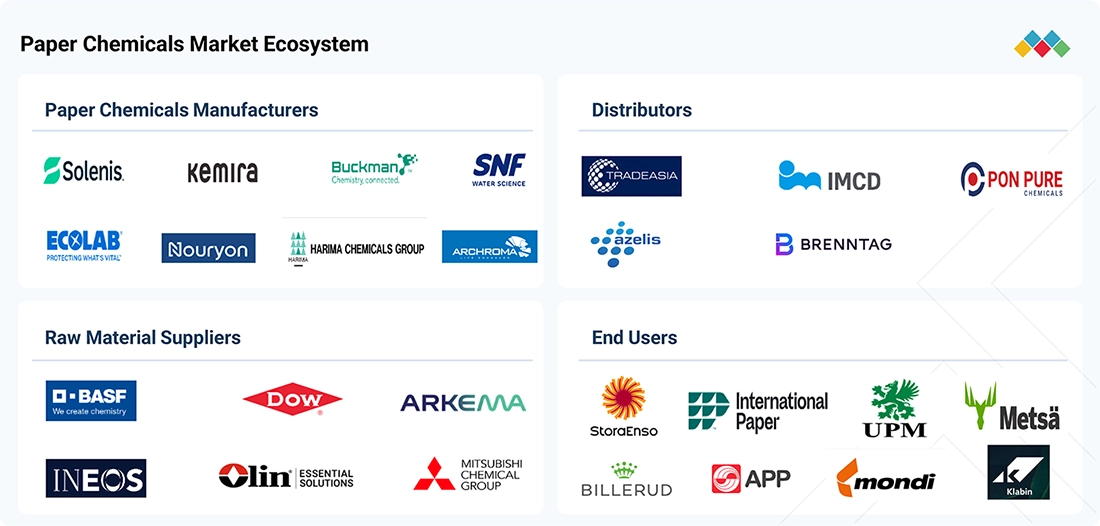
Paper chemicals involve raw material suppliers, chemical producers, pulp and paper producers, distributors and end users. The raw material suppliers supply chemicals and feedstocks, and the manufacturers create various chemicals such as bleaching, sizing, strength, retention, coating and process chemicals. The main consumption pattern is within pulp and paper mills, where the different chemicals are used in the pulp process, papermaking and water & process treatment.

paper-chemical-market Ecosystem

Logos and trademarks shown above are the property of their respective owners. Their use here is for informational and illustrative purposes only.

MARKET SEGMENTS

paper-chemical-market Segments

Source: Secondary Research, Interviews with Experts, MarketsandMarkets Analysis

Paper Chemicals Market, By Type

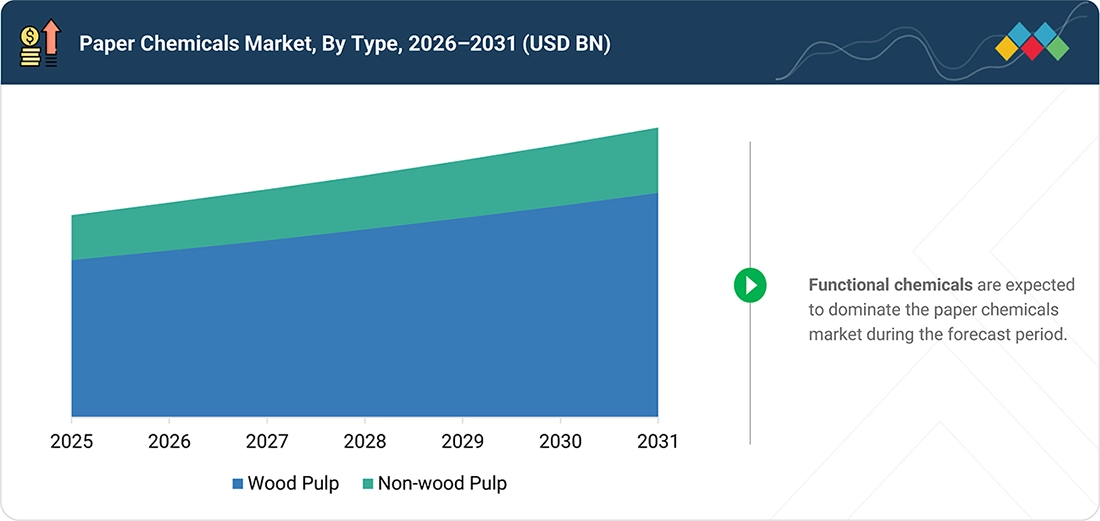
Functional chemicals accounted for the largest share of the paper chemicals market in 2025, as they are used across the finished paper industry to enhance the paper's performance and quality. These chemicals offer water resistance, strength, printability, smoothness, brightness and barrier properties. Functional chemicals are being used to an increasing extent due to increased demand for high-performance packaging papers. Demand for functional treatments and coatings is also being helped by the trend toward lightweight, recyclable packaging and fibre based packaging. Furthermore, their use in packaging, tissue, specialty and graphic papers helps them achieve a high market share.

Paper Chemicals Market, By Form

In 2025, specialty accounted for the largest segment of the paper chemicals market as they offered specific properties and met certain specialized needs throughout the paper industry. Such chemicals are used in specialty coating, surface treatment, strength, retention, drainage and contaminant control applications. Adoption has been aided by growth in demand for high-quality packaging, tissue, hygiene and specialty paper products. Paper manufacturers are also looking for more chemicals that can help production to be efficient and reduce water, energy and raw-material consumption. The increasing demand for specialty chemicals is driven by growing demand for sustainable and high-performance paper products.

Paper Chemicals Market, By Application

In 2025, papermaking accounted for the largest share of the paper chemicals market, due to the extensive consumption of chemicals in paper production and finishing. Papermaking chemicals are used to enhance qualities like retention, strength, drainage, sizing, coating, printability, surface quality, etc. The growth in tissue, hygiene, specialty and printing papers is also fueling demand. Additionally, as more recycled fibers and sustainable manufacturing processes are being adopted, there is a growing demand for process and functional chemicals in papermaking.

REGION

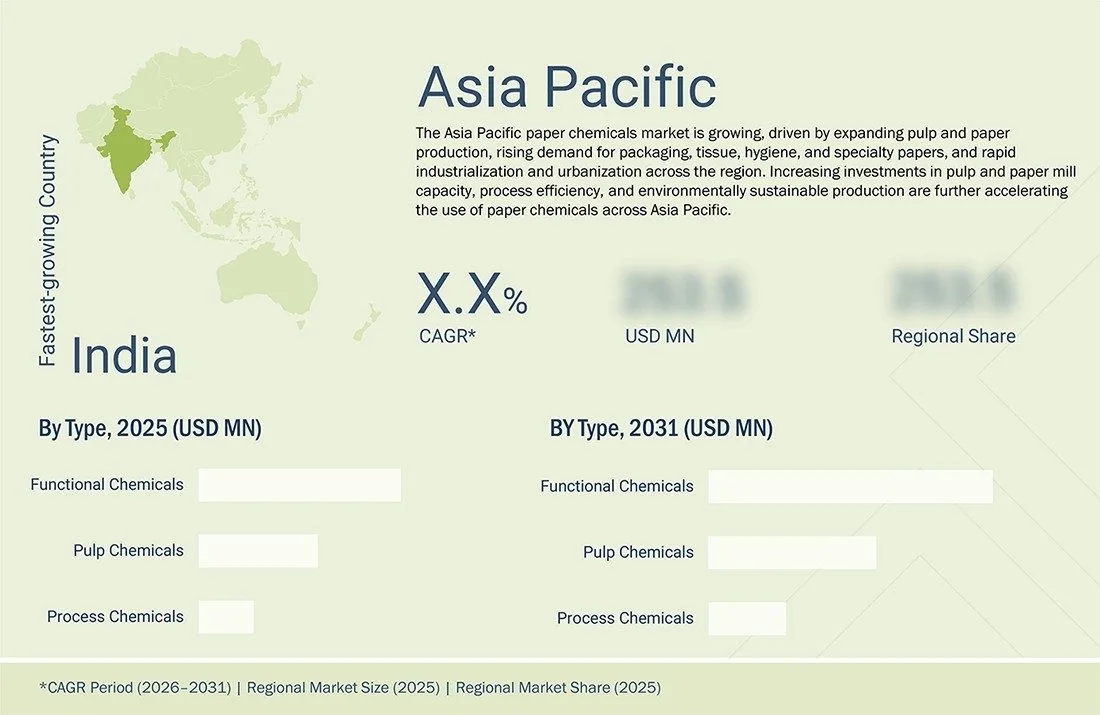
Asia Pacific is leading region in the global paper chemicals market

By region, Asia Pacific is the leading region in the paper chemicals market, driven by a huge and growing production base of pulp and paper in countries such as China, India, Japan, Indonesia, and South Korea. The demand for paper is rising at an accelerated pace in the packaging, tissue, printing and specialty paper segments due to rapid urbanisation, industrialisation and economic growth. Increased recycled-paper production is helping to boost demand for retention, deinking, drainage, and contaminant-control chemicals. Apart from that, investments in new and expanded pulp and paper mills, growing awareness of hygiene and paper products which are sustainable and recyclable are fueling the chemical demand.

paper-chemical-market Region

PAPER CHEMICALS MARKET: COMPANY EVALUATION MATRIX

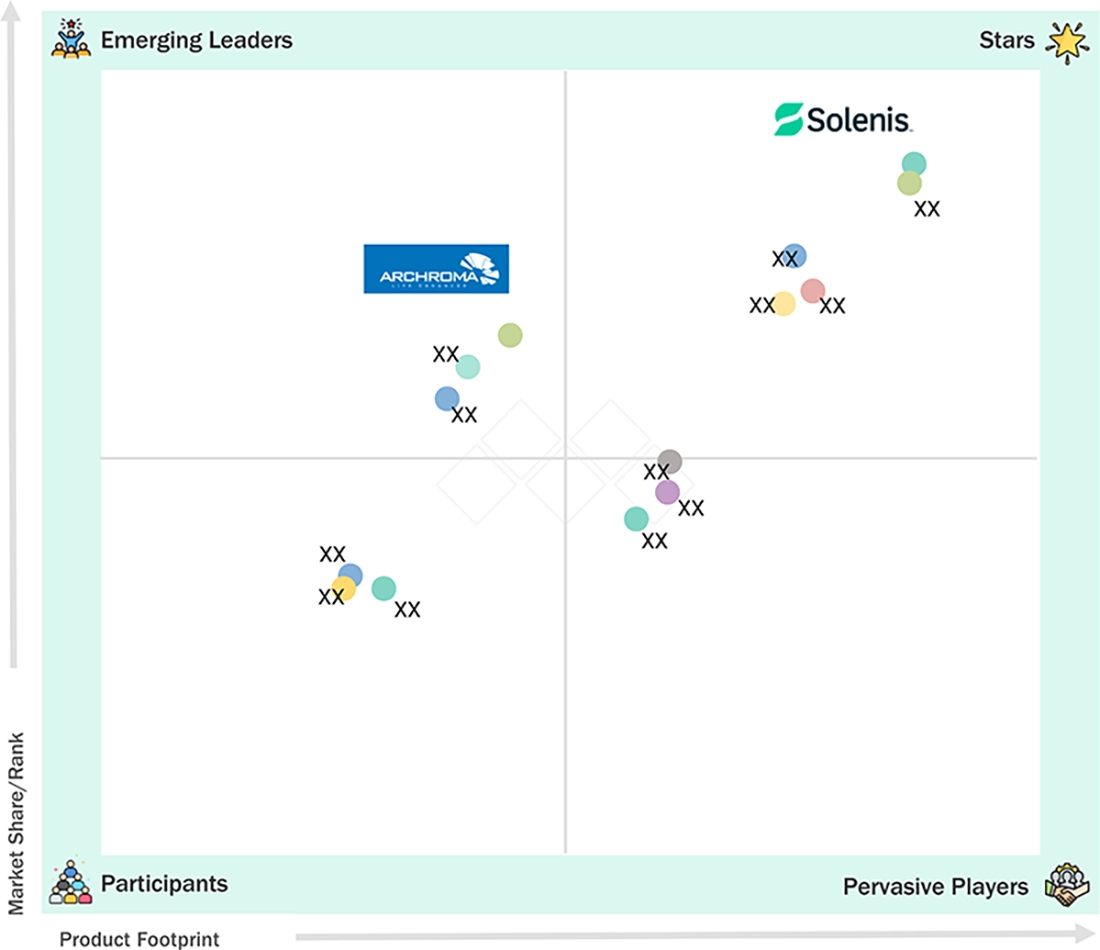
Solenis (Star) is a leader in the paper chemicals market because its broad product line of pulp and papermaking chemicals, applications expertise, manufacturing and service capabilities around the world, and focus on enhancing paper quality, process efficiency and sustainability. Archroma (Emerging Leader) is reinforcing its presence in the paper chemicals sector with its growing portfolio of pulp additives, process chemicals, and specialty solutions for paper.

paper-chemical-market Evaluation Metrics

Source: Secondary Research, Interviews with Experts, MarketsandMarkets Analysis

KEY MARKET PLAYERS

MARKET SCOPE

REPORT METRIC DETAILS
Market Size in 2025 (Value) USD 47.75 Billion
Market Size in 2026 (Value) USD 48.36 Billion
Market Forecast in 2031 (Value) USD 51.51 Billion
CAGR 1.3%
Years Considered 2022–2031
Base Year 2025
Forecast Period 2026–2031
Units Considered Value (USD Billion)
Report Coverage Revenue forecast, company ranking, competitive landscape, growth factors, and trends
Segments Covered
  • By type:
    • process chemicals
    • pulp chemicals and functional chemicals
  • By Form:
    • specialty
    • and commodity
  • By application:
    • pulp manufacturing
    • paper making
    • and water & process treatment
Regions Covered North America, Europe, Asia Pacific, South America, and Middle East & Africa

WHAT IS IN IT FOR YOU: PAPER CHEMICALS MARKET REPORT CONTENT GUIDE

paper-chemical-market Content Guide

DELIVERED CUSTOMIZATIONS

We have successfully delivered the following deep-dive customizations:

CLIENT REQUEST CUSTOMIZATION DELIVERED VALUE ADDS
Asia Pacific-based Paper Chemicals Market Detailed company profiles of paper chemicals market competitors (financials, product portfolio), type (process chemicals, pulp chemicals and functional chemicals), form (specialty, and commodity), and application (pulp manufacturing, paper making, and water & process treatment) Identified & profiled 20+ paper chemical producers across Asia Pacific Mapped demand trends across high-growth segments (Pulp manufacturing, Paper making, and water & process treatment)
Europe-based Paper Chemicals Market Detailed company profiles of paper chemicals market competitors (financials, product portfolio), type (process chemicals, pulp chemicals and functional chemicals), form (specialty, and commodity), and application (pulp manufacturing, paper making, and water & process treatment) Identified & profiled 20+ paper chemical producers across Europe Mapped demand trends across high-growth segments (Pulp manufacturing, Paper making, and water & process treatment)

RECENT DEVELOPMENTS

  • April 26: Solenis announced the groundbreaking of a new 60,000-tonne-per-year production facility in Beihai, Guangxi Province, China. The RMB 250 million (approximately USD 35 million) investment is aimed at expanding Solenis' manufacturing footprint in the Asia Pacific region and strengthening its ability to serve the growing pulp and paper markets in Western China and Southeast Asia. The facility is expected to commence operations in Q2 2027 and will manufacture key papermaking materials, including polymers, defoamers, silica, and functional and process chemistries.
  • March 25: Kemira announced a multi-million-euro investment to expand multiple production lines for strength chemical agents used in paper, board, and tissue production at its Wellgrow site in Thailand. The expansion project is scheduled to commence in 2026, with the additional capacity expected to become operational in August 2026. As a leading producer and supplier of pulp, paper, and board chemicals in the Asia Pacific (APAC) region, the investment is aimed at meeting the growing demand in Southeast Asian and Indian markets.
  • Jully 25: Pritzker Private Capital (PPC), a leading family-direct investment firm, completed the previously announced acquisition of Buckman, a family-owned provider of specialty solutions for water treatment and industrial processes. The partnership is expected to provide Buckman with additional financial resources and operational expertise to support its growth, expand its market presence, and accelerate product innovation. With operations spanning more than 90 countries, Buckman plans to continue expanding its global footprint while strengthening its integrated, customer-centric service model, which differentiates the company within the specialty chemicals industry.


Table of Contents

checkmarkExclusive indicates content/data unique to MarketsandMarkets and not available with any competitors.

TITLE
PAGE NO
1
INTRODUCTION


23
2
EXECUTIVE SUMMARY


27
3
PREMIUM INSIGHTS


32
4
MARKET OVERVIEW
Leverage sustainable innovations and emerging markets to capitalize on the global shift from plastics.


35
 
4.1
INTRODUCTION


4.2
MARKET DYNAMICS


4.2.1
DRIVERS


4.2.1.1
EXPANSION OF PAPER, PULP, AND PAPERBOARD PRODUCTION


4.2.1.2
EXPANSION OF TISSUE AND HYGIENE PAPER APPLICATIONS


4.2.1.3
GLOBAL PUSH AGAINST PLASTIC POLLUTION AND REGULATORY REQUIREMENTS


4.2.1.4
INCREASING USE AND HIGH UTILIZATION OF RECYCLED PAPER


4.2.2
RESTRAINTS


4.2.2.1
VOLATILITY IN RAW-MATERIAL PRICES


4.2.2.2
ENVIRONMENTAL AND REGULATORY RESTRICTIONS


4.2.3
OPPORTUNITIES


4.2.3.1
DEVELOPMENT OF SUSTAINABLE PAPER CHEMICALS


4.2.3.2
GROWTH IN EMERGING ECONOMIES


4.2.3.3
EXPANSION OF E-COMMERCE AND FOOD-SERVICE ACTIVITIES


4.2.4
CHALLENGES


4.2.4.1
SUPPLY-CHAIN DISRUPTIONS AND GEOPOLITICAL RISKS


4.2.4.2
STRONG COMPETITION AMONG GLOBAL AND REGIONAL COMPANIES


4.3
UNMET NEEDS AND WHITE SPACES


4.3.1
UNMET NEEDS IN PAPER CHEMICALS MARKET


4.3.1.1
GROWING NEED FOR HIGH-PERFORMANCE PAPER CHEMICALS


4.3.1.2
NEED FOR COST-EFFECTIVE AND SUSTAINABLE PAPER CHEMICAL SOLUTIONS


4.3.1.3
INCREASING NEED FOR SPECIALIZED AND APPLICATION-SPECIFIC PAPER CHEMICALS


4.3.2
WHITE SPACE OPPORTUNITIES


4.3.2.1
EXPANSION INTO HIGH-GROWTH EMERGING ECONOMIES


4.3.2.2
GROWTH OPPORTUNITIES IN SUSTAINABLE AND RECYCLED-FIBER PAPER PRODUCTION


4.3.2.3
INCREASING DEMAND FOR FUNCTIONAL AND BARRIER CHEMICALS FOR PAPER PACKAGING


4.4
INTERCONNECTED MARKETS AND CROSS-SECTOR OPPORTUNITIES


4.4.1
INTERCONNECTED MARKETS


4.4.2
CROSS-SECTOR OPPORTUNITIES


4.5
STRATEGIC MOVES BY TIER 1/2/3 PLAYERS


4.5.1
TIER 1 PLAYERS: GLOBAL LEADERS DRIVING EXPANSION AND PAPER CHEMICAL INNOVATION


4.5.1.1
BUCKMAN ACQUIRED BY PRITZKER PRIVATE CAPITAL TO SUPPORT GLOBAL EXPANSION AND PRODUCT INNOVATION


4.5.1.2
NOURYON ENTERS LONG-TERM SUPPLY AGREEMENT WITH ARAUCO FOR SODIUM CHLORATE AND CHLORINE DIOXIDE


4.5.1.3
SOLENIS ANNOUNCES NEW PRODUCTION FACILITY IN CHINA TO EXPAND PAPER CHEMICALS CAPACITY


5
INDUSTRY TRENDS
Navigate industry dynamics with insights on competitive forces, economic trends, and regional pricing strategies.


50
 
5.1
PORTER’S FIVE FORCES ANALYSIS


5.1.1
THREAT OF NEW ENTRANTS


5.1.2
THREAT OF SUBSTITUTES


5.1.3
BARGAINING POWER OF SUPPLIERS


5.1.4
BARGAINING POWER OF BUYERS


5.1.5
INTENSITY OF COMPETITIVE RIVALRY


5.2
MACROECONOMIC OUTLOOK


5.2.1
INTRODUCTION


5.2.2
GDP TRENDS AND FORECASTS


5.3
VALUE CHAIN ANALYSIS


5.4
ECOSYSTEM ANALYSIS


5.5
PRICING ANALYSIS


5.5.1
PRICING ANALYSIS BASED ON REGION


5.6
TRADE ANALYSIS


5.6.1
EXPORT SCENARIO (HS CODE 482370)


5.6.2
IMPORT SCENARIO (HS CODE 380992)


5.7
KEY CONFERENCES AND EVENTS, 2026–2027


5.8
TRENDS/DISRUPTIONS IMPACTING CUSTOMER BUSINESS


5.9
INVESTMENT AND FUNDING SCENARIO


5.10
CASE STUDY ANALYSIS


5.10.1
SOLENIS: IMPROVING FINE PAPER MILL PERFORMANCE THROUGH SIZING AGENT OPTIMIZATION


5.11
IMPACT OF US TARIFFS – PAPER CHEMICALS MARKET


5.11.1
INTRODUCTION


5.11.2
KEY TARIFF RATES


5.11.3
PRICE IMPACT ANALYSIS


5.11.4
IMPACT ON COUNTRY/REGION


5.11.4.1
US


5.11.4.2
ASIA PACIFIC


5.11.4.3
EUROPE


5.11.5
IMPACT ON APPLICATIONS


6
TECHNOLOGICAL ADVANCEMENTS, AI-DRIVEN IMPACT, PATENTS, INNOVATIONS, AND FUTURE APPLICATIONS
AI-driven innovations revolutionize paper chemistry, enhancing sustainability, efficiency, and future market integration.


70
 
6.1
KEY EMERGING TECHNOLOGIES


6.1.1
ENZYMATIC PAPERMAKING AND FIBER MODIFICATION


6.1.2
RECYCLABILITY-ENHANCING CHEMISTRY


6.1.3
GREEN CHEMISTRY


6.2
COMPLEMENTARY TECHNOLOGIES


6.2.1
REAL-TIME SENSORS AND ONLINE PROCESS MONITORING


6.2.2
AUTOMATED CHEMICAL DOSING AND CLOSED-LOOP CONTROL


6.2.3
ADVANCED WATER AND PROCESS TREATMENT


6.3
ADJACENT TECHNOLOGIES


6.3.1
NANOCELLULOSE AND ADVANCED CELLULOSE-BASED MATERIALS


6.3.2
DIGITAL PRINTING AND FUNCTIONAL PAPER TECHNOLOGY


6.4
TECHNOLOGY/PRODUCT ROADMAP


6.4.1
SHORT-TERM (2025–2027) | FOUNDATION & EARLY COMMERCIALIZATION


6.4.2
MID-TERM (2027–2030) | EXPANSION & INTEGRATION


6.4.3
LONG-TERM (2030–2035+) | MATURITY, CIRCULARITY & ADVANCED PAPER CHEMISTRY


6.5
PATENT ANALYSIS


6.5.1
INTRODUCTION


6.5.2
METHODOLOGY


6.5.3
PATENT ANALYSIS, 2016–2025


6.6
FUTURE APPLICATIONS


6.6.1
INTEGRATION OF PAPER CHEMICALS IN ADVANCED AND HIGH-PERFORMANCE APPLICATIONS


6.7
IMPACT OF AI/GEN AI ON PAPER CHEMICALS MARKET


6.7.1
TOP USE CASES AND MARKET POTENTIAL


6.7.2
BEST PRACTICES IN PAPER CHEMICALS


6.7.3
INTERCONNECTED ECOSYSTEM AND IMPACT ON MARKET PLAYERS


6.7.4
CLIENTS’ READINESS TO ADOPT GENERATIVE AI IN PAPER CHEMICALS MARKET


6.7.5
SOLENIS DRY-STRENGTH ADDITIVE IMPROVES TISSUE STRENGTH AND MACHINE PRODUCTIVITY


7
REGULATORY LANDSCAPE AND SUSTAINABILITY INITIATIVES
Navigate complex regulations and sustainability efforts to minimize carbon impact in paper chemicals.


84
 
7.1
REGIONAL REGULATIONS AND COMPLIANCE


7.1.1
REGULATORY BODIES, GOVERNMENT AGENCIES, AND OTHER ORGANIZATIONS


7.1.2
INDUSTRY STANDARDS


7.2
SUSTAINABILITY INITIATIVES


7.2.1
CARBON IMPACT AND ECO-APPLICATIONS OF PAPER CHEMICALS


7.2.1.1
CARBON IMPACT REDUCTION


7.2.1.2
ECO-APPLICATIONS


7.3
SUSTAINABILITY IMPACT AND REGULATORY POLICY INITIATIVES


7.4
CERTIFICATIONS, LABELING, & ECO-STANDARDS


8
CUSTOMER LANDSCAPE & BUYER BEHAVIOR
Unlock revenue by aligning with key stakeholders' criteria and addressing unmet application needs.


94
 
8.1
DECISION-MAKING PROCESS


8.2
KEY STAKEHOLDERS INVOLVED IN BUYING PROCESS AND THEIR EVALUATION CRITERIA


8.2.1
KEY STAKEHOLDERS IN BUYING PROCESS


8.2.2
BUYING CRITERIA


8.3
ADOPTION BARRIERS & INTERNAL CHALLENGES


8.4
UNMET NEEDS OF VARIOUS APPLICATIONS


8.5
MARKET PROFITABILITY


8.5.1
REVENUE POTENTIAL


8.5.2
COST DYNAMICS


8.6
MARGIN OPPORTUNITIES, BY APPLICATION


9
PAPER CHEMICALS MARKET, BY TYPE
Market Size & Growth Rate Forecast Analysis to 2031 in USD Million and Kilotons | 7 Data Tables


102
 
9.1
INTRODUCTION


9.2
PULP CHEMICALS


9.2.1
GROWING PAPER RECYCLING AND RECOVERED-FIBER PROCESSING TO DRIVE MARKET


9.3
PROCESS CHEMICALS


9.3.1
GROWING FOCUS ON PAPER MACHINE EFFICIENCY AND PROCESS-WATER MANAGEMENT TO PROPEL MARKET


9.4
FUNCTIONAL CHEMICALS


9.4.1
GROWING DEMAND FOR HIGH-PERFORMANCE PAPER TO FUEL GROWTH


10
PAPER CHEMICALS MARKET, BY FORM
Market Size & Growth Rate Forecast Analysis to 2031 in USD Million and Kilotons | 4 Data Tables


111
 
10.1
INTRODUCTION


10.2
SPECIALTY


10.2.1
GROWING USE OF RECOVERED PAPER TO DRIVE MARKET


10.3
COMMODITY


10.3.1
HIGH-VOLUME PULP AND PAPERMAKING TO PROPEL MARKET


11
PAPER CHEMICALS MARKET, BY APPLICATION
Market Size & Growth Rate Forecast Analysis to 2031 in USD Million and Kilotons | 4 Data Tables


115
 
11.1
INTRODUCTION


11.2
PAPERMAKING


11.2.1
GROWING GLOBAL PAPER PRODUCTION TO DRIVE MARKET


11.3
PULP PRODUCTION


11.3.1
GROWING PULP PRODUCTION TO PROPEL MARKET


11.4
WATER & PROCESS TREATMENT


11.4.1
INCREASING WATER SCARCITY AND STRINGENT ENVIRONMENTAL REGULATIONS TO PROPEL MARKET


12
PAPER CHEMICALS MARKET, BY REGION
Comprehensive coverage of 8 Regions with country-level deep-dive of 17 Countries | 156 Data Tables.


120
 
12.1
INTRODUCTION


12.2
ASIA PACIFIC


12.2.1
CHINA


12.2.1.1
GROWING PACKAGING INDUSTRY TO FUEL DEMAND


12.2.2
INDIA


12.2.2.1
RAPID CONSUMPTION GROWTH AND PACKAGING EXPANSION ARE ACCELERATING DEMAND FOR PAPER-CHEMICAL SOLUTIONS


12.2.3
JAPAN


12.2.3.1
PACKAGING PREMIUMIZATION AND SUSTAINABILITY ARE DRIVING DEMAND FOR HIGHER-PERFORMANCE PAPER CHEMICALS


12.2.4
SOUTH KOREA


12.2.4.1
CONVENIENCE-LED CONSUMPTION AND E-COMMERCE ACCELERATING DEMAND FOR FUNCTIONAL PAPER CHEMICALS


12.2.5
REST OF ASIA PACIFIC


12.3
NORTH AMERICA


12.3.1
US


12.3.1.1
EXPANSION OF TISSUE AND HYGIENE PAPER PRODUCTION TO PROPEL MARKET


12.3.2
CANADA


12.3.2.1
GROWING DEMAND FOR SUSTAINABLE PAPER-BASED PACKAGING TO DRIVE MARKET


12.3.3
MEXICO


12.3.3.1
INCREASING DOMESTIC PAPER PRODUCTION TO SUPPORT MARKET GROWTH


12.4
EUROPE


12.4.1
SWEDEN


12.4.1.1
EXPANSION OF TISSUE AND HYGIENE PAPER PRODUCTION TO PROPEL MARKET


12.4.2
FINLAND


12.4.2.1
EXPANSION OF SUSTAINABLE PACKAGING TO DRIVE MARKET


12.4.3
RUSSIA


12.4.3.1
EXPANSION OF PACKAGING AND E-COMMERCE APPLICATIONS TO SUPPORT MARKET GROWTH


12.4.4
FRANCE


12.4.4.1
INCREASING ADOPTION OF SUSTAINABLE AND RECYCLABLE PAPER-BASED PACKAGING TO SUPPORT MARKET GROWTH


12.4.5
GERMANY


12.4.5.1
EXPANSION OF FOODSERVICE AND PAPER-BASED FOOD PACKAGING TO SUPPORT MARKET GROWTH


12.4.6
REST OF EUROPE


12.5
MIDDLE EAST & AFRICA


12.5.1
GCC COUNTRIES


12.5.1.1
SAUDI ARABIA


12.5.1.1.1
PAPER, TISSUE AND PACKAGING INVESTMENTS EXPAND DEMAND FOR HIGH-PERFORMANCE CHEMICAL SOLUTIONS


12.5.1.2
UAE


12.5.1.2.1
REGIONAL TRADE, PACKAGING EXPANSION AND CIRCULARITY ACCELERATE DEMAND FOR HIGH-PERFORMANCE PAPER CHEMICALS


12.5.1.3
REST OF GCC COUNTRIES


12.5.2
SOUTH AFRICA


12.5.2.1
PACKAGING INVESTMENTS INITIATIVE STRENGTHEN DEMAND FOR HIGH-PERFORMANCE PAPER CHEMICALS


12.5.3
REST OF MIDDLE EAST & AFRICA


12.6
SOUTH AMERICA


12.6.1
BRAZIL


12.6.1.1
ACCELERATING PAPER CHEMICALS DEMAND THROUGH PULP & PAPER INVESTMENTS AND SUSTAINABLE PACKAGING INITIATIVES


12.6.2
ARGENTINA


12.6.2.1
GOVERNMENT INVESTMENT PLANS TO BOOST MARKET


12.6.3
REST OF SOUTH AMERICA


13
COMPETITIVE LANDSCAPE
Discover strategic insights and market positions of leading companies and emerging players by 2025.


180
 
13.1
OVERVIEW


13.1.1
KEY PLAYERS’ STRATEGIES/RIGHT TO WIN, JANUARY 2021–AUGUST 2026


13.2
REVENUE ANALYSIS, 2021–2025


13.3
MARKET RANKING, 2025


13.4
COMPANY VALUATION AND FINANCIAL METRICS


13.5
BRAND/PRODUCT COMPARISON


13.6
COMPANY EVALUATION MATRIX: KEY PLAYERS, 2025


13.6.1
STARS


13.6.2
EMERGING LEADERS


13.6.3
PERVASIVE PLAYERS


13.6.4
PARTICIPANTS


13.6.5
COMPANY FOOTPRINT: KEY PLAYERS, 2025


13.6.5.1
COMPANY FOOTPRINT


13.6.5.2
REGION FOOTPRINT


13.6.5.3
FORM FOOTPRINT


13.6.5.4
TYPE FOOTPRINT


13.6.5.5
APPLICATION FOOTPRINT


13.7
COMPANY EVALUATION MATRIX: STARTUPS/SMES, 2025


13.7.1
PROGRESSIVE COMPANIES


13.7.2
RESPONSIVE COMPANIES


13.7.3
DYNAMIC COMPANIES


13.7.4
STARTING BLOCKS


13.7.5
COMPETITIVE BENCHMARKING: STARTUPS/SMES, 2025


13.7.5.1
DETAILED LIST OF KEY STARTUPS/SMES


13.7.6
COMPETITIVE BENCHMARKING OF KEY STARTUPS/SMES


13.8
COMPETITIVE SCENARIO


13.8.1
PRODUCT LAUNCHES


13.8.2
DEALS


13.8.3
EXPANSIONS


13.8.4
OTHER DEVELOPMENTS


14
COMPANY PROFILES
In-depth Company Profiles of Leading Market Players with detailed Business Overview, Product and Service Portfolio, Recent Developments, and Unique Analyst Perspective (MnM View)


204
 
14.1
KEY PLAYERS


14.1.1
SOLENIS


14.1.1.1
BUSINESS OVERVIEW


14.1.1.2
PRODUCTS/SOLUTIONS/SERVICES OFFERED


14.1.1.3
RECENT DEVELOPMENTS


14.1.1.3.1
DEALS


14.1.1.3.2
EXPANSIONS


14.1.1.3.3
OTHER DEVELOPMENTS


14.1.1.4
MNM VIEW


14.1.1.4.1
KEY STRENGTHS


14.1.1.4.2
STRATEGIC CHOICES


14.1.1.4.3
WEAKNESSES AND COMPETITIVE THREATS


14.1.2
KEMIRA


14.1.3
ECOLAB INC.


14.1.4
BUCKMAN


14.1.5
NOURYON


14.1.6
HARIMA CHEMICALS GROUP, INC.


14.1.7
SNF


14.1.8
KURITA WATER INDUSTRIES LTD.


14.1.9
ARCHROMA


14.1.10
IVAX PAPER CHEMICALS LIMITED


14.2
OTHER PLAYERS


14.2.1
PROTEX INTERNATIONAL


14.2.2
WÖLLNER GMBH


14.2.3
ARAKAWA CHEMICAL INDUSTRIES, LTD.


14.2.4
MARE S.P.A


14.2.5
INDULOR CHEMIE GMBH


14.2.6
SHANDONG BLUESUN CHEMICALS CO., LTD.


14.2.7
ERCO WORLDWIDE


14.2.8
SOLVAY


14.2.9
EVONIK


14.2.10
AAHAN CHEMIEX LLP


14.2.11
NNOWETA PERFORMANCE CHEMICALS PVT LTD


14.2.12
ACURO ORGANICS LIMITED


14.2.13
FPCL


14.2.14
PAPERTEX SPECIALITY CHEMICALS PVT. LTD.


14.2.15
SHREE CHLORATES


15
RESEARCH METHODOLOGY


254
 
15.1
RESEARCH DATA


15.1.1
SECONDARY DATA


15.1.1.1
KEY DATA FROM SECONDARY SOURCES


15.1.2
PRIMARY DATA


15.1.2.1
KEY DATA FROM PRIMARY SOURCES


15.1.2.2
KEY INDUSTRY INSIGHTS


15.2
MARKET SIZE ESTIMATION


15.3
BASE NUMBER CALCULATION


15.3.1
SUPPLY-SIDE APPROACH


15.3.2
DEMAND-SIDE APPROACH


15.4
MARKET FORECAST APPROACH


15.4.1
SUPPLY SIDE


15.4.2
DEMAND SIDE


15.5
DATA TRIANGULATION


15.6
FACTOR ANALYSIS


15.7
RESEARCH ASSUMPTIONS


15.8
RESEARCH LIMITATIONS AND RISK ASSESSMENT


16
APPENDIX


263
 
16.1
DISCUSSION GUIDE


16.2
KNOWLEDGESTORE: MARKETSANDMARKETS’ SUBSCRIPTION PORTAL


16.3
CUSTOMIZATION OPTIONS


16.4
RELATED REPORTS


16.5
AUTHOR DETAILS


LIST OF TABLES


TABLE 1
EUROPEAN TISSUE PAPER PRODUCTION AND CONSUMPTION, 2024–2025 (MILLION TONNES)


TABLE 2
KEY REGULATIONS


TABLE 3
INTERCONNECTED MARKETS


TABLE 4
PORTER’S FIVE FORCES ANALYSIS


TABLE 5
GLOBAL GDP PROJECTION, BY REGION, 2021–2028 (USD TRILLION)


TABLE 6
ROLES OF COMPANIES IN PAPER CHEMICALS ECOSYSTEM


TABLE 7
AVERAGE SELLING PRICE OF KEY PLAYERS, BY KEY PRODUCT (USD/KG)


TABLE 8
AVERAGE SELLING PRICE OF KEY PLAYERS, BY REGION, 2022-2026 (USD/KG)


TABLE 9
EXPORT DATA RELATED TO HS CODE 380992 -COMPLIANT PRODUCTS, BY COUNTRY, 2021–2025 (USD MILLION)


TABLE 10
IMPORT DATA RELATED TO HS CODE 380992 -COMPLIANT PRODUCTS, BY COUNTRY, 2021–2025 (USD MILLION)


TABLE 11
PAPER CHEMICALS MARKET: DETAILED LIST OF CONFERENCES AND EVENTS, 2026–2027


TABLE 12
PAPER CHEMICALS MARKET: LIST OF KEY PATENTS, 2024–2025


TABLE 13
TOP USE CASES AND MARKET POTENTIAL


TABLE 14
BEST PRACTICES: COMPANIES IMPLEMENTING USE CASES


TABLE 15
NORTH AMERICA: REGULATORY BODIES, GOVERNMENT AGENCIES, AND OTHER ORGANIZATIONS


TABLE 16
EUROPE: REGULATORY BODIES, GOVERNMENT AGENCIES, AND OTHER ORGANIZATIONS


TABLE 17
ASIA PACIFIC: REGULATORY BODIES, GOVERNMENT AGENCIES, AND OTHER ORGANIZATIONS


TABLE 18
ROW: REGULATORY BODIES, GOVERNMENT AGENCIES, AND OTHER ORGANIZATIONS


TABLE 19
GLOBAL INDUSTRY STANDARDS IN PAPER CHEMICALS MARKET


TABLE 20
CERTIFICATIONS, LABELING, & ECO-STANDARDS IN PAPER CHEMICALS MARKET


TABLE 21
INFLUENCE OF STAKEHOLDERS IN BUYING PROCESS, BY APPLICATION (%)


TABLE 22
KEY BUYING CRITERIA, BY APPLICATION


TABLE 23
UNMET NEEDS IN PAPER CHEMICALS MARKET, BY APPLICATION


TABLE 24
PAPER CHEMICALS MARKET, BY TYPE, 2022–2024 (USD MILLION)


TABLE 25
PAPER CHEMICALS MARKET, BY TYPE, 2025–2031 (USD MILLION)


TABLE 26
PAPER CHEMICALS MARKET, BY TYPE, 2022–2024 (KILOTON)


TABLE 27
PAPER CHEMICALS MARKET, BY TYPE, 2025–2031 (KILOTON)


TABLE 28
KEY PULP CHEMICALS BY TYPE


TABLE 29
KEY PROCESS CHEMICALS


TABLE 30
KEY FUNCTIONAL CHEMICALS


TABLE 31
PAPER CHEMICALS MARKET, BY FORM, 2022–2024 (USD MILLION)


TABLE 32
PAPER CHEMICALS MARKET, BY FORM, 2025–2031 (USD MILLION)


TABLE 33
PAPER CHEMICALS MARKET, BY FORM, 2022–2024 (KILOTON)


TABLE 34
PAPER CHEMICALS MARKET, BY FORM, 2025–2031 (KILOTON)


TABLE 35
PAPER CHEMICALS MARKET, BY APPLICATION, 2022–2024 (USD MILLION)


TABLE 36
PAPER CHEMICALS MARKET, BY APPLICATION, 2025–2031 (USD MILLION)


TABLE 37
PAPER CHEMICALS MARKET, BY APPLICATION, 2022–2024 (KILOTON)


TABLE 38
PAPER CHEMICALS MARKET, BY APPLICATION, 2025–2031 (KILOTON)


TABLE 39
PAPER CHEMICALS MARKET, BY REGION, 2022–2024 (USD MILLION)


TABLE 40
PAPER CHEMICALS MARKET, BY REGION, 2025–2031 (USD MILLION)


TABLE 41
PAPER CHEMICALS MARKET, BY REGION, 2022–2024 (KILOTON)


TABLE 42
PAPER CHEMICALS MARKET, BY REGION, 2025–2031 (KILOTON)


TABLE 43
ASIA PACIFIC: PAPER CHEMICALS MARKET, BY COUNTRY, 2022–2024 (USD MILLION)


TABLE 44
ASIA PACIFIC: PAPER CHEMICALS MARKET, BY COUNTRY, 2025–2031 (USD MILLION)


TABLE 45
ASIA PACIFIC: PAPER CHEMICALS MARKET, BY COUNTRY, 2022–2024 (KILOTON)


TABLE 46
ASIA PACIFIC: PAPER CHEMICALS MARKET, BY COUNTRY, 2025–2031 (KILOTON)


TABLE 47
ASIA PACIFIC: PAPER CHEMICALS MARKET, BY TYPE, 2022–2024 (USD MILLION)


TABLE 48
ASIA PACIFIC: PAPER CHEMICALS MARKET, BY TYPE, 2025–2031 (USD MILLION)


TABLE 49
ASIA PACIFIC: PAPER CHEMICALS MARKET, BY TYPE, 2022–2024 (KILOTON)


TABLE 50
ASIA PACIFIC: PAPER CHEMICALS MARKET, BY TYPE, 2025–2031 (KILOTON)


TABLE 51
ASIA PACIFIC: PAPER CHEMICALS MARKET, BY FORM, 2022–2024 (USD MILLION)


TABLE 52
ASIA PACIFIC: PAPER CHEMICALS MARKET, BY FORM, 2025–2031 (USD MILLION)


TABLE 53
ASIA PACIFIC: PAPER CHEMICALS MARKET, BY FORM, 2022–2024 (KILOTON)


TABLE 54
ASIA PACIFIC: PAPER CHEMICALS MARKET, BY FORM, 2025–2031 (KILOTON)


TABLE 55
CHINA: PAPER CHEMICALS MARKET, BY TYPE, 2022–2024 (USD MILLION)


TABLE 56
CHINA: PAPER CHEMICALS MARKET, BY TYPE, 2025–2031 (USD MILLION)


TABLE 57
CHINA: PAPER CHEMICALS MARKET, BY TYPE, 2022–2024 (KILOTON)


TABLE 58
CHINA: PAPER CHEMICALS MARKET, BY TYPE, 2025–2031 (KILOTON)


TABLE 59
INDIA: PAPER CHEMICALS MARKET, BY TYPE, 2022–2024 (USD MILLION)


TABLE 60
INDIA: PAPER CHEMICALS MARKET, BY TYPE, 2025–2031 (USD MILLION)


TABLE 61
INDIA: PAPER CHEMICALS MARKET, BY TYPE, 2022–2024 (KILOTON)


TABLE 62
INDIA: PAPER CHEMICALS MARKET, BY TYPE, 2025–2031 (KILOTON)


TABLE 63
JAPAN: PAPER CHEMICALS MARKET, BY TYPE, 2022–2024 (USD MILLION)


TABLE 64
JAPAN: PAPER CHEMICALS MARKET, BY TYPE, 2025–2031 (USD MILLION)


TABLE 65
JAPAN: PAPER CHEMICALS MARKET, BY TYPE, 2022–2024 (KILOTON)


TABLE 66
JAPAN: PAPER CHEMICALS MARKET, BY TYPE, 2025–2031 (KILOTON)


TABLE 67
SOUTH KOREA: PAPER CHEMICALS MARKET, BY TYPE, 2022–2024 (USD MILLION)


TABLE 68
SOUTH KOREA: PAPER CHEMICALS MARKET, BY TYPE, 2025–2031 (USD MILLION)


TABLE 69
SOUTH KOREA: PAPER CHEMICALS MARKET, BY TYPE, 2022–2024 (KILOTON)


TABLE 70
SOUTH KOREA: PAPER CHEMICALS MARKET, BY TYPE, 2025–2031 (KILOTON)


TABLE 71
REST OF ASIA PACIFIC: PAPER CHEMICALS MARKET, BY TYPE, 2022–2024 (USD MILLION)


TABLE 72
REST OF ASIA PACIFIC: PAPER CHEMICALS MARKET, BY TYPE, 2025–2031 (USD MILLION)


TABLE 73
REST OF ASIA PACIFIC: PAPER CHEMICALS MARKET, BY TYPE, 2022–2024 (KILOTON)


TABLE 74
REST OF ASIA PACIFIC: PAPER CHEMICALS MARKET, BY TYPE, 2025–2031 (KILOTON)


TABLE 75
NORTH AMERICA: PAPER CHEMICALS MARKET, BY COUNTRY, 2022–2024 (USD MILLION)


TABLE 76
NORTH AMERICA: PAPER CHEMICALS MARKET, BY COUNTRY, 2025–2031 (USD MILLION)


TABLE 77
NORTH AMERICA: PAPER CHEMICALS MARKET, BY COUNTRY, 2022–2024 (KILOTON)


TABLE 78
NORTH AMERICA: PAPER CHEMICALS MARKET, BY COUNTRY, 2025–2031 (KILOTON)


TABLE 79
NORTH AMERICA: PAPER CHEMICALS MARKET, BY TYPE, 2022–2024 (USD MILLION)


TABLE 80
NORTH AMERICA: PAPER CHEMICALS MARKET, BY TYPE, 2025–2031 (USD MILLION)


TABLE 81
NORTH AMERICA: PAPER CHEMICALS MARKET, BY TYPE, 2022–2024 (KILOTON)


TABLE 82
NORTH AMERICA: PAPER CHEMICALS MARKET, BY TYPE, 2025–2031 (KILOTON)


TABLE 83
NORTH AMERICA: PAPER CHEMICALS MARKET, BY FORM, 2022–2024 (USD MILLION)


TABLE 84
NORTH AMERICA: PAPER CHEMICALS MARKET, BY FORM, 2025–2031 (USD MILLION)


TABLE 85
NORTH AMERICA: PAPER CHEMICALS MARKET, BY FORM, 2022–2024 (KILOTON)


TABLE 86
NORTH AMERICA: PAPER CHEMICALS MARKET, BY FORM, 2025–2031 (KILOTON)


TABLE 87
US: PAPER CHEMICALS MARKET, BY TYPE, 2022–2024 (USD MILLION)


TABLE 88
US: PAPER CHEMICALS MARKET, BY TYPE, 2025–2031 (USD MILLION)


TABLE 89
US: PAPER CHEMICALS MARKET, BY TYPE, 2022–2024 (KILOTON)


TABLE 90
US: PAPER CHEMICALS MARKET, BY TYPE, 2025–2031 (KILOTON)


TABLE 91
CANADA: PAPER CHEMICALS MARKET, BY TYPE, 2022–2024 (USD MILLION)


TABLE 92
CANADA: PAPER CHEMICALS MARKET, BY TYPE, 2025–2031 (USD MILLION)


TABLE 93
CANADA: PAPER CHEMICALS MARKET, BY TYPE, 2022–2024 (KILOTON)


TABLE 94
CANADA: PAPER CHEMICALS MARKET, BY TYPE, 2025–2031 (KILOTON)


TABLE 95
MEXICO: PAPER CHEMICALS MARKET, BY TYPE, 2022–2024 (USD MILLION)


TABLE 96
MEXICO: PAPER CHEMICALS MARKET, BY TYPE, 2025–2031 (USD MILLION)


TABLE 97
MEXICO: PAPER CHEMICALS MARKET, BY TYPE, 2022–2024 (KILOTON)


TABLE 98
MEXICO: PAPER CHEMICALS MARKET, BY TYPE, 2025–2031 (KILOTON)


TABLE 99
EUROPE: PAPER CHEMICALS MARKET, BY COUNTRY, 2022–2024 (USD MILLION)


TABLE 100
EUROPE: PAPER CHEMICALS MARKET, BY COUNTRY, 2025–2031 (USD MILLION)


TABLE 101
EUROPE: PAPER CHEMICALS MARKET, BY COUNTRY, 2022–2024 (KILOTON)


TABLE 102
EUROPE: PAPER CHEMICALS MARKET, BY COUNTRY, 2025–2031 (KILOTON)


TABLE 103
EUROPE: PAPER CHEMICALS MARKET, BY TYPE, 2022–2024 (USD MILLION)


TABLE 104
EUROPE: PAPER CHEMICALS MARKET, BY TYPE, 2025–2031 (USD MILLION)


TABLE 105
EUROPE: PAPER CHEMICALS MARKET, BY TYPE, 2022–2024 (KILOTON)


TABLE 106
EUROPE: PAPER CHEMICALS MARKET, BY TYPE, 2025–2031 (KILOTON)


TABLE 107
EUROPE: PAPER CHEMICALS MARKET, BY FORM, 2022–2024 (USD MILLION)


TABLE 108
EUROPE: PAPER CHEMICALS MARKET, BY FORM, 2025–2031 (USD MILLION)


TABLE 109
EUROPE: PAPER CHEMICALS MARKET, BY FORM, 2022–2024 (KILOTON)


TABLE 110
EUROPE: PAPER CHEMICALS MARKET, BY FORM, 2025–2031 (KILOTON)


TABLE 111
SWEDEN: PAPER CHEMICALS MARKET, BY TYPE, 2022–2024 (USD MILLION)


TABLE 112
SWEDEN: PAPER CHEMICALS MARKET, BY TYPE, 2025–2031 (USD MILLION)


TABLE 113
SWEDEN: PAPER CHEMICALS MARKET, BY TYPE, 2022–2024 (KILOTON)


TABLE 114
SWEDEN: PAPER CHEMICALS MARKET, BY TYPE, 2025–2031 (KILOTON)


TABLE 115
FINLAND: PAPER CHEMICALS MARKET, BY TYPE, 2022–2024 (USD MILLION)


TABLE 116
FINLAND: PAPER CHEMICALS MARKET, BY TYPE, 2025–2031 (USD MILLION)


TABLE 117
FINLAND: PAPER CHEMICALS MARKET, BY TYPE, 2022–2024 (KILOTON)


TABLE 118
FINLAND: PAPER CHEMICALS MARKET, BY TYPE, 2025–2031 (KILOTON)


TABLE 119
RUSSIA: PAPER CHEMICALS MARKET, BY TYPE, 2022–2024 (USD MILLION)


TABLE 120
RUSSIA: PAPER CHEMICALS MARKET, BY TYPE, 2025–2031 (USD MILLION)


TABLE 121
RUSSIA: PAPER CHEMICALS MARKET, BY TYPE, 2022–2024 (KILOTON)


TABLE 122
RUSSIA: PAPER CHEMICALS MARKET, BY TYPE, 2025–2031 (KILOTON)


TABLE 123
FRANCE: PAPER CHEMICALS MARKET, BY TYPE, 2022–2024 (USD MILLION)


TABLE 124
FRANCE: PAPER CHEMICALS MARKET, BY TYPE, 2025–2031 (USD MILLION)


TABLE 125
FRANCE: PAPER CHEMICALS MARKET, BY TYPE, 2022–2024 (KILOTON)


TABLE 126
FRANCE: PAPER CHEMICALS MARKET, BY TYPE, 2025–2031 (KILOTON)


TABLE 127
GERMANY: PAPER CHEMICALS MARKET, BY TYPE, 2022–2024 (USD MILLION)


TABLE 128
GERMANY: PAPER CHEMICALS MARKET, BY TYPE, 2025–2031 (USD MILLION)


TABLE 129
GERMANY: PAPER CHEMICALS MARKET, BY TYPE, 2022–2024 (KILOTON)


TABLE 130
GERMANY: PAPER CHEMICALS MARKET, BY TYPE, 2025–2031 (KILOTON)


TABLE 131
REST OF EUROPE: PAPER CHEMICALS MARKET, BY TYPE, 2022–2024 (USD MILLION)


TABLE 132
REST OF EUROPE: PAPER CHEMICALS MARKET, BY TYPE, 2025–2031 (USD MILLION)


TABLE 133
REST OF EUROPE: PAPER CHEMICALS MARKET, BY TYPE, 2022–2024 (KILOTON)


TABLE 134
REST OF EUROPE: PAPER CHEMICALS MARKET, BY TYPE, 2025–2031 (KILOTON)


TABLE 135
MIDDLE EAST & AFRICA: PAPER CHEMICALS MARKET, BY COUNTRY, 2022–2024 (USD MILLION)


TABLE 136
MIDDLE EAST & AFRICA: PAPER CHEMICALS MARKET, BY COUNTRY, 2025–2031 (USD MILLION)


TABLE 137
MIDDLE EAST & AFRICA: PAPER CHEMICALS MARKET, BY COUNTRY, 2022–2024 (KILOTON)


TABLE 138
MIDDLE EAST & AFRICA: PAPER CHEMICALS MARKET, BY COUNTRY, 2025–2031 (KILOTON)


TABLE 139
MIDDLE EAST & AFRICA: PAPER CHEMICALS MARKET, BY TYPE, 2022–2024 (USD MILLION)


TABLE 140
MIDDLE EAST & AFRICA: PAPER CHEMICALS MARKET, BY TYPE, 2025–2031 (USD MILLION)


TABLE 141
MIDDLE EAST & AFRICA: PAPER CHEMICALS MARKET, BY TYPE, 2022–2024 (KILOTON)


TABLE 142
MIDDLE EAST & AFRICA: PAPER CHEMICALS MARKET, BY TYPE, 2025–2031 (KILOTON)


TABLE 143
MIDDLE EAST & AFRICA: PAPER CHEMICALS MARKET, BY FORM, 2022–2024 (USD MILLION)


TABLE 144
MIDDLE EAST & AFRICA: PAPER CHEMICALS MARKET, BY FORM, 2025–2031 (USD MILLION)


TABLE 145
MIDDLE EAST & AFRICA: PAPER CHEMICALS MARKET, BY FORM, 2022–2024 (KILOTON)


TABLE 146
MIDDLE EAST & AFRICA: PAPER CHEMICALS MARKET, BY FORM, 2025–2031 (KILOTON)


TABLE 147
GCC COUNTRIES: PAPER CHEMICALS MARKET, BY TYPE, 2022–2024 (USD MILLION)


TABLE 148
GCC COUNTRIES: PAPER CHEMICALS MARKET, BY TYPE, 2025–2031 (USD MILLION)


TABLE 149
GCC COUNTRIES: PAPER CHEMICALS MARKET, BY TYPE, 2022–2024 (KILOTON)


TABLE 150
GCC COUNTRIES: PAPER CHEMICALS MARKET, BY TYPE, 2025–2031 (KILOTON)


TABLE 151
SAUDI ARABIA: PAPER CHEMICALS MARKET, BY TYPE, 2022–2024 (USD MILLION)


TABLE 152
SAUDI ARABIA: PAPER CHEMICALS MARKET, BY TYPE, 2025–2031 (USD MILLION)


TABLE 153
SAUDI ARABIA: PAPER CHEMICALS MARKET, BY TYPE, 2022–2024 (KILOTON)


TABLE 154
SAUDI ARABIA: PAPER CHEMICALS MARKET, BY TYPE, 2025–2031 (KILOTON)


TABLE 155
UAE: PAPER CHEMICALS MARKET, BY TYPE, 2022–2024 (USD MILLION)


TABLE 156
UAE: PAPER CHEMICALS MARKET, BY TYPE, 2025–2031 (USD MILLION)


TABLE 157
UAE: PAPER CHEMICALS MARKET, BY TYPE, 2022–2024 (KILOTON)


TABLE 158
UAE: PAPER CHEMICALS MARKET, BY TYPE, 2025–2031 (KILOTON)


TABLE 159
REST OF GCC: PAPER CHEMICALS MARKET, BY TYPE, 2022–2024 (USD MILLION)


TABLE 160
REST OF GCC: PAPER CHEMICALS MARKET, BY TYPE, 2025–2031 (USD MILLION)


TABLE 161
REST OF GCC: PAPER CHEMICALS MARKET, BY TYPE, 2022–2024 (KILOTON)


TABLE 162
REST OF GCC: PAPER CHEMICALS MARKET, BY TYPE, 2025–2031 (KILOTON)


TABLE 163
SOUTH AFRICA: PAPER CHEMICALS MARKET, BY TYPE, 2022–2024 (USD MILLION)


TABLE 164
SOUTH AFRICA: PAPER CHEMICALS MARKET, BY TYPE, 2025–2031 (USD MILLION)


TABLE 165
SOUTH AFRICA: PAPER CHEMICALS MARKET, BY TYPE, 2022–2024 (KILOTON)


TABLE 166
SOUTH AFRICA: PAPER CHEMICALS MARKET, BY TYPE, 2025–2031 (KILOTON)


TABLE 167
REST OF MIDDLE EAST & AFRICA: PAPER CHEMICALS MARKET, BY TYPE, 2022–2024 (USD MILLION)


TABLE 168
REST OF MIDDLE EAST & AFRICA: PAPER CHEMICALS MARKET, BY TYPE, 2025–2031 (USD MILLION)


TABLE 169
REST OF MIDDLE EAST & AFRICA: PAPER CHEMICALS MARKET, BY TYPE, 2022–2024 (KILOTON)


TABLE 170
REST OF MIDDLE EAST & AFRICA: PAPER CHEMICALS MARKET, BY TYPE, 2025–2031 (KILOTON)


TABLE 171
SOUTH AMERICA: PAPER CHEMICALS MARKET, BY COUNTRY, 2022–2024 (USD MILLION)


TABLE 172
SOUTH AMERICA: PAPER CHEMICALS MARKET, BY COUNTRY, 2025–2031 (USD MILLION)


TABLE 173
SOUTH AMERICA: PAPER CHEMICALS MARKET, BY COUNTRY, 2022–2024 (KILOTON)


TABLE 174
SOUTH AMERICA: PAPER CHEMICALS MARKET, BY COUNTRY, 2025–2031 (KILOTON)


TABLE 175
SOUTH AMERICA: PAPER CHEMICALS MARKET, BY TYPE, 2022–2024 (USD MILLION)


TABLE 176
SOUTH AMERICA: PAPER CHEMICALS MARKET, BY TYPE, 2025–2031 (USD MILLION)


TABLE 177
SOUTH AMERICA: PAPER CHEMICALS MARKET, BY TYPE, 2022–2024 (KILOTON)


TABLE 178
SOUTH AMERICA: PAPER CHEMICALS MARKET, BY TYPE, 2025–2031 (KILOTON)


TABLE 179
SOUTH AMERICA: PAPER CHEMICALS MARKET, BY FORM, 2022–2024 (USD MILLION)


TABLE 180
SOUTH AMERICA: PAPER CHEMICALS MARKET, BY FORM, 2025–2031 (USD MILLION)


TABLE 181
SOUTH AMERICA: PAPER CHEMICALS MARKET, BY FORM, 2022–2024 (KILOTON)


TABLE 182
SOUTH AMERICA: PAPER CHEMICALS MARKET, BY FORM, 2025–2031 (KILOTON)


TABLE 183
BRAZIL: PAPER CHEMICALS MARKET, BY TYPE, 2022–2024 (USD MILLION)


TABLE 184
BRAZIL: PAPER CHEMICALS MARKET, BY TYPE, 2025–2031 (USD MILLION)


TABLE 185
BRAZIL: PAPER CHEMICALS MARKET, BY TYPE, 2022–2024 (KILOTON)


TABLE 186
BRAZIL: PAPER CHEMICALS MARKET, BY TYPE, 2025–2031 (KILOTON)


TABLE 187
ARGENTINA: PAPER CHEMICALS MARKET, BY TYPE, 2022–2024 (USD MILLION)


TABLE 188
ARGENTINA: PAPER CHEMICALS MARKET, BY TYPE, 2025–2031 (USD MILLION)


TABLE 189
ARGENTINA: PAPER CHEMICALS MARKET, BY TYPE, 2022–2024 (KILOTON)


TABLE 190
ARGENTINA: PAPER CHEMICALS MARKET, BY TYPE, 2025–2031 (KILOTON)


TABLE 191
REST OF SOUTH AMERICA: PAPER CHEMICALS MARKET, BY TYPE, 2022–2024 (USD MILLION)


TABLE 192
REST OF SOUTH AMERICA: PAPER CHEMICALS MARKET, BY TYPE, 2025–2031 (USD MILLION)


TABLE 193
REST OF SOUTH AMERICA: PAPER CHEMICALS MARKET, BY TYPE, 2022–2024 (KILOTON)


TABLE 194
REST OF SOUTH AMERICA: PAPER CHEMICALS MARKET, BY TYPE, 2025–2031 (KILOTON)


TABLE 195
KEY PLAYERS’ STRATEGIES/RIGHT TO WIN, JANUARY 2021–AUGUST 2026


TABLE 196
PAPER CHEMICALS MARKET: REGION FOOTPRINT


TABLE 197
PAPER CHEMICALS MARKET: FORM FOOTPRINT


TABLE 198
PAPER CHEMICALS MARKET: TYPE FOOTPRINT


TABLE 199
PAPER CHEMICALS MARKET: APPLICATION FOOTPRINT


TABLE 200
PAPER CHEMICALS MARKET: DETAILED LIST OF KEY STARTUPS/SMES


TABLE 201
PAPER CHEMICALS MARKET: COMPETITIVE BENCHMARKING OF KEY STARTUPS/SMES


TABLE 202
PAPER CHEMICALS MARKET: PRODUCT LAUNCHES, JANUARY 2021–AUGUST 2026


TABLE 203
PAPER CHEMICALS MARKET: DEALS, JANUARY 2021–AUGUST 2026


TABLE 204
PAPER CHEMICALS MARKET: EXPANSIONS, JANUARY 2021–AUGUST 2026


TABLE 205
PAPER CHEMICALS MARKET: OTHER DEVELOPMENTS, JANUARY 2021–AUGUST 2026


TABLE 206
SOLENIS: COMPANY OVERVIEW


TABLE 207
SOLENIS: PRODUCTS/SOLUTIONS/SERVICES OFFERED


TABLE 208
SOLENIS: DEALS


TABLE 209
SOLENIS: EXPANSIONS


TABLE 210
SOLENIS: OTHER DEVELOPMENTS


TABLE 211
KEMIRA: COMPANY OVERVIEW


TABLE 212
KEMIRA: PRODUCTS/SOLUTIONS/SERVICES OFFERED


TABLE 213
KEMIRA: DEALS


TABLE 214
KEMIRA: EXPANSIONS


TABLE 215
ECOLAB INC.: COMPANY OVERVIEW


TABLE 216
ECOLAB INC.: PRODUCTS/SOLUTIONS/SERVICES OFFERED


TABLE 217
BUCKMAN: COMPANY OVERVIEW


TABLE 218
BUCKMAN: PRODUCTS/SOLUTIONS/SERVICES OFFERED


TABLE 219
BUCKMAN: DEALS


TABLE 220
BUCKMAN: OTHER DEVELOPMENTS


TABLE 221
NOURYON: COMPANY OVERVIEW


TABLE 222
NOURYON: PRODUCTS/SOLUTIONS/SERVICES OFFERED


TABLE 223
NOURYON: DEALS


TABLE 224
NOURYON: EXPANSIONS


TABLE 225
HARIMA CHEMICALS GROUP, INC.: COMPANY OVERVIEW


TABLE 226
HARIMA CHEMICALS GROUP, INC.: PRODUCTS/SOLUTIONS/SERVICES OFFERED


TABLE 227
HARIMA CHEMICALS GROUP, INC.: PRODUCT LAUNCHES


TABLE 228
HARIMA CHEMICALS GROUP, INC.: DEALS


TABLE 229
HARIMA CHEMICALS GROUP, INC.: OTHER DEVELOPMENTS


TABLE 230
SNF: COMPANY OVERVIEW


TABLE 231
SNF: PRODUCTS/SOLUTIONS/SERVICES OFFERED


TABLE 232
KURITA WATER INDUSTRIES LTD.: COMPANY OVERVIEW


TABLE 233
KURITA WATER INDUSTRIES LTD.: PRODUCTS/SOLUTIONS/SERVICES OFFERED


TABLE 234
ARCHROMA: COMPANY OVERVIEW


TABLE 235
ARCHROMA: PRODUCTS/SOLUTIONS/SERVICES OFFERED


TABLE 236
IVAX PAPER CHEMICALS LIMITED: COMPANY OVERVIEW


TABLE 237
IVAX PAPER CHEMICALS LIMITED: PRODUCTS/SOLUTIONS/SERVICES OFFERED


TABLE 238
PROTEX INTERNATIONAL: COMPANY OVERVIEW


TABLE 239
WÖLLNER GMBH: COMPANY OVERVIEW


TABLE 240
ARAKAWA CHEMICAL INDUSTRIES, LTD.: COMPANY OVERVIEW


TABLE 241
MARE S.P.A: COMPANY OVERVIEW


TABLE 242
INDULOR CHEMIE GMBH: COMPANY OVERVIEW


TABLE 243
SHANDONG BLUESUN CHEMICALS CO., LTD.: COMPANY OVERVIEW


TABLE 244
ERCO WORLDWIDE: COMPANY OVERVIEW


TABLE 245
SOLVAY: COMPANY OVERVIEW


TABLE 246
EVONIK: COMPANY OVERVIEW


TABLE 247
AAHAN CHEMIEX LLP: COMPANY OVERVIEW


TABLE 248
NNOWETA PERFORMANCE CHEMICALS PVT LTD: COMPANY OVERVIEW


TABLE 249
ACURO ORGANICS LIMITED: COMPANY OVERVIEW


TABLE 250
FPCL: COMPANY OVERVIEW


TABLE 251
PAPERTEX SPECIALITY CHEMICALS PVT. LTD.: COMPANY OVERVIEW


TABLE 252
SHREE CHLORATES: COMPANY OVERVIEW


LIST OF FIGURES


FIGURE 1
PAPER CHEMICALS MARKET SEGMENTATION AND REGIONAL SCOPE


FIGURE 2
MARKET SCENARIO


FIGURE 3
GLOBAL PAPER CHEMICALS MARKET, 2022–2031


FIGURE 4
MAJOR STRATEGIES ADOPTED BY KEY PLAYERS IN PAPER CHEMICALS MARKET (JANUARY 2021–SEPTEMBER 2026)


FIGURE 5
DISRUPTIVE TRENDS IMPACTING GROWTH OF PAPER CHEMICALS MARKET


FIGURE 6
HIGH-GROWTH SEGMENTS IN PAPER CHEMICALS MARKET, 2026–2031


FIGURE 7
ASIA PACIFIC TO BE LARGEST MARKET DURING FORECAST PERIOD


FIGURE 8
RISING PAPER AND PAPERBOARD PRODUCTION, INCREASING DEMAND FOR TISSUE AND HYGIENE PRODUCTS, AND GROWTH IN SUSTAINABLE PAPER-BASED PACKAGING TO DRIVE MARKET


FIGURE 9
ASIA PACIFIC ACCOUNTED FOR LARGEST MARKET SHARE IN 2025


FIGURE 10
PULP CHEMICALS SEGMENT ACCOUNTED FOR LARGEST MARKET SHARE IN 2025


FIGURE 11
PULP PRODUCTION ACCOUNTED FOR LARGEST SHARE OF PAPER CHEMICALS MARKET IN 2025


FIGURE 12
INDIA TO REGISTER HIGHEST CAGR DURING FORECAST PERIOD


FIGURE 13
PAPER CHEMICALS MARKET: DRIVERS, RESTRAINTS, OPPORTUNITIES, AND CHALLENGES


FIGURE 14
GLOBAL B2B E-COMMERCE GMV, 2019–2026 (USD BILLION)


FIGURE 15
GLOBAL RETAIL E-COMMERCE SALES, CAGR, BY COUNTRY, 2023–2027


FIGURE 16
PAPER CHEMICALS MARKET: PORTER’S FIVE FORCES ANALYSIS


FIGURE 17
PAPER CHEMICALS MARKET: VALUE CHAIN ANALYSIS


FIGURE 18
PAPER CHEMICALS MARKET: ECOSYSTEM ANALYSIS


FIGURE 19
AVERAGE SELLING PRICE TREND OF TYPE, BY KEY PLAYERS, 2025 (USD/KG)


FIGURE 20
PAPER CHEMICALS MARKET: AVERAGE SELLING PRICE, BY REGION, 2022-2026, (USD/KG)


FIGURE 21
EXPORT DATA FOR HS CODE 380992 -COMPLIANT PRODUCTS, BY COUNTRY, 2021–2025 (USD MILLION)


FIGURE 22
IMPORT DATA FOR HS CODE 380992 -COMPLIANT PRODUCTS, BY COUNTRY, 2021–2025 (USD MILLION)


FIGURE 23
TRENDS/DISRUPTIONS IMPACTING CUSTOMER BUSINESS


FIGURE 24
INVESTMENT AND FUNDING SCENARIO, 2021–2025


FIGURE 25
LIST OF MAJOR PATENTS FOR PAPER CHEMICALS, 2016–2025


FIGURE 26
MAJOR PATENTS APPLIED AND GRANTED RELATED TO PAPER CHEMICALS, BY COUNTRY/REGION, 2016–2025


FIGURE 27
PAPER CHEMICALS MARKET: DECISION-MAKING FACTORS


FIGURE 28
INFLUENCE OF STAKEHOLDERS IN BUYING PROCESS, BY APPLICATION


FIGURE 29
KEY BUYING CRITERIA, BY APPLICATION


FIGURE 30
ADOPTION BARRIERS & INTERNAL CHALLENGES


FIGURE 31
FUNCTIONAL CHEMICALS SEGMENT TO DOMINATE MARKET DURING FORECAST PERIOD


FIGURE 32
SPECIALTY SEGMENT TO LEAD MARKET DURING FORECAST PERIOD


FIGURE 33
PAPERMAKING SEGMENT TO DOMINATE MARKET DURING FORECAST PERIOD


FIGURE 34
ASIA PACIFIC TO BE LEADING MARKET FOR PAPER CHEMICALS DURING FORECAST PERIOD


FIGURE 35
ASIA PACIFIC: PAPER CHEMICALS MARKET SNAPSHOT


FIGURE 36
NORTH AMERICA: PAPER CHEMICALS MARKET SNAPSHOT


FIGURE 37
REVENUE ANALYSIS OF KEY PLAYERS, 2021–2025


FIGURE 38
MARKET RANKING, 2025


FIGURE 39
COMPANY VALUATION


FIGURE 40
FINANCIAL MATRIX (EV/EBITDA)


FIGURE 41
YEAR-TO-DATE PRICE AND FIVE-YEAR STOCK BETA


FIGURE 42
BRAND/PRODUCT COMPARISON


FIGURE 43
PAPER CHEMICALS MARKET: COMPANY EVALUATION MATRIX (KEY PLAYERS), 2025


FIGURE 44
PAPER CHEMICALS MARKET: COMPANY FOOTPRINT


FIGURE 45
PAPER CHEMICALS MARKET: COMPANY EVALUATION MATRIX (STARTUPS/SMES), 2025


FIGURE 46
KEMIRA: COMPANY SNAPSHOT


FIGURE 47
ECOLAB: COMPANY SNAPSHOT


FIGURE 48
HARIMA CHEMICALS GROUP, INC.: COMPANY SNAPSHOT


FIGURE 49
KURITA WATER INDUSTRIES LTD.: COMPANY SNAPSHOT


FIGURE 50
PAPER CHEMICALS MARKET: RESEARCH DESIGN


FIGURE 51
BREAKDOWN OF INTERVIEWS WITH EXPERTS


FIGURE 52
MARKET SIZE ESTIMATION: BOTTOM-UP APPROACH


FIGURE 53
MARKET SIZE ESTIMATION: TOP-DOWN APPROACH


FIGURE 54
PAPER CHEMICALS MARKET: APPROACH 1


FIGURE 55
PAPER CHEMICALS MARKET: APPROACH 1


FIGURE 56
PAPER CHEMICALS MARKET: DATA TRIANGULATION


Methodology

The study involved four major activities to estimate the current size of the global paper chemicals market. Exhaustive secondary research was carried out to collect information on the market, the peer product market, and the parent product group market. The next step was to validate these findings, assumptions, and sizes with industry experts across the value chain of paper chemicals through primary research. The top-down and bottom-up approaches were employed to estimate the overall size of the paper chemicals market. After that, market breakdown and data triangulation procedures were used to determine the size of different segments of the market.

Secondary Research

The market for companies offering paper chemicals was determined using secondary data available through paid and unpaid sources, analyzing the product portfolios of the major companies in the ecosystem, and rating the companies by their performance and quality. For this study, various secondary sources, such as Business Standard, Bloomberg, the World Bank, and Factiva, were referred to identify and collect information on the paper chemicals market. In the secondary research process, various secondary sources were referred to identify and collect information related to the study. Secondary sources included annual reports, press releases, and investor presentations of paper chemicals vendors, forums, certified publications, and whitepapers. The secondary research was used to obtain critical information on the industry’s value chain, the total pool of key players, market classification, and segmentation from the market and technology-oriented perspectives.

Primary Research

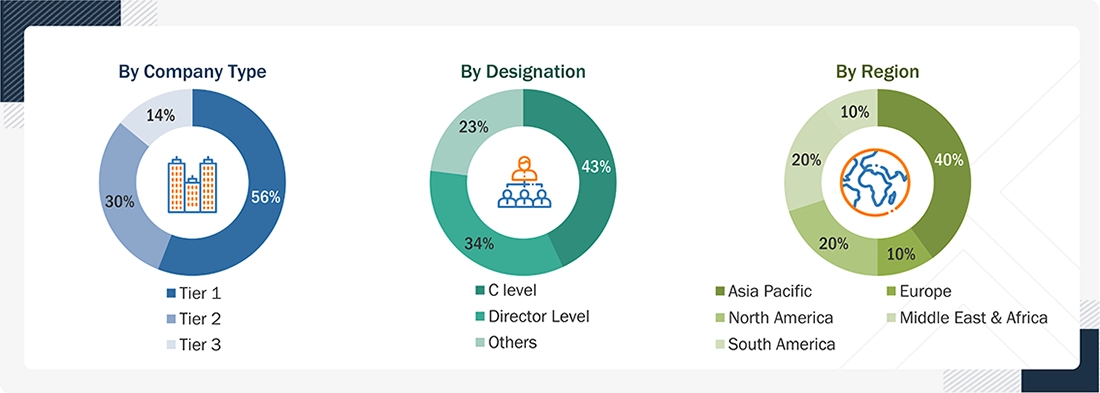
In the primary research process, various primary sources from the supply and demand sides were interviewed to obtain qualitative and quantitative information for this report. The primary sources from the supply side included industry experts, such as chief executive officers (CEOs), vice presidents (VPs), marketing directors, technology and innovation directors, and related key executives from several key companies and organizations operating in the paper chemicals market. After the complete market engineering (calculations for market statistics, market breakdown, market size estimations, market forecasting, and data triangulation), extensive primary research was conducted to gather information and verify and validate the critical numbers arrived at.

Primary research was also conducted to identify the segmentation types, industry trends, competitive landscape of paper chemicals offered by various market players, and key market dynamics, such as drivers, restraints, opportunities, challenges, trends, and key player strategies. In the complete market engineering process, the top-down and bottom-up approaches and several data triangulation methods were extensively used to perform the market estimation and market forecasting for the overall market segments and subsegments listed in this report. Extensive qualitative and quantitative analysis was performed on the complete market engineering process to list the key information/insights throughout the report.

The following is the breakdown of primary respondents:

Paper Chemicals Market
 Size, and Share

To know about the assumptions considered for the study, download the pdf brochure

Market Size Estimation

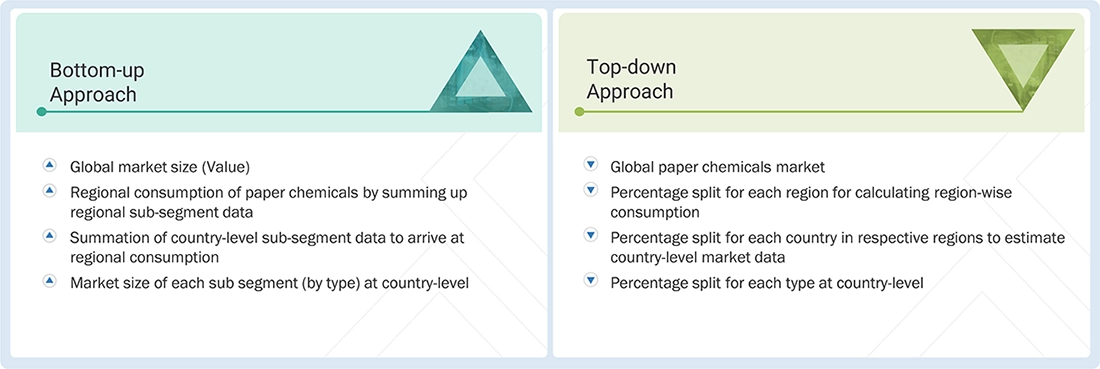
The top-down and bottom-up approaches were used to estimate and validate the size of the global paper chemicals market. These approaches were also used extensively to estimate the size of various dependent market segments. The research methodology used to estimate the market size included the following:

Paper Chemicals Market : Top-Down and Bottom-Up Approach

Paper Chemicals Market Top Down and Bottom Up Approach

Data Triangulation

After arriving at the overall market size using the market size estimation processes, the market was split into several segments and subsegments. The data triangulation and market breakup procedures were employed, wherever applicable, to complete the overall market engineering process and arrive at the exact statistics of each market segment and subsegment. The data was triangulated by studying various factors and trends from the demand and supply sides.

Market Definition

Paper chemicals are a diverse group of chemicals used throughout the pulp and paper manufacturing process to convert wood, recycled fiber, or other raw materials into finished paper products. They are applied at various stages, including pulping, bleaching, deinking, papermaking, coating, and machine cleaning, to improve production efficiency and the quality and performance of paper products. Based on their functions, paper chemicals are broadly classified into pulp chemicals, process chemicals, and functional chemicals. Pulp chemicals include pulping, bleaching, and deinking chemicals, while process chemicals include biocides, coagulants and flocculants, defoamers, deposit-control agents, and retention and drainage aids. Functional chemicals are used to impart specific properties to paper and typically include dyes, pigments, colorants, fillers, surface coatings, sizing agents, softeners, and binders. Paper chemicals help manufacturers improve properties such as strength, brightness, printability, water resistance, and appearance while optimizing papermaking operations. They also support process control by managing foam, microbial growth, deposits, and wastewater quality, thereby reducing waste, improving resource efficiency, and supporting the environmental performance of pulp and paper mills.

Key Stakeholders

  • Chemical raw material suppliers
  • Chemical distributors & suppliers
  • Specialty chemical solution providers
  • Paper chemical manufacturers
  • End-users
  • Paper converters
  • Equipment & technology providers
  • Water & wastewater treatment providers
  • Government and research organizations
  • Associations and industrial bodies
  • R&D institutions
  • Certification organizations

Report Objectives

  • To define, describe, and forecast the size of the global paper chemicals market, by type, form, and application in terms of value
  • To forecast the market size of segments for North America, Europe, Asia Pacific, South America, and the Middle East & Africa, along with their respective countries, in terms of value and volume
  • To provide detailed information on the significant drivers, restraints, opportunities, and challenges influencing the market
  • To strategically analyze micromarkets concerning individual growth trends, prospects, and their contribution to the market
  • To assess the growth opportunities in the market for stakeholders and provide details on the competitive landscape for market leaders
  • To strategically profile key players and comprehensively analyze their market shares and core competencies
  • To analyze competitive developments, such as partnerships, agreements, acquisitions, and expansions in the paper chemicals market
  • To provide the impact of AI/Gen AI on the market
  • To provide the macroeconomic outlook for each region covered under the study, and the impact of the 2025 US tariff on the market

Available customizations:

With the given market data, MarketsandMarkets offers customizations according to client-specific needs.

The following customization options are available for the paper chemicals report:

Product Analysis

  • A product matrix that gives a detailed comparison of the product portfolio of each company

Regional Analysis

  • A further breakdown of the paper chemicals market for additional countriesy

Company Information

  • Detailed analysis and profiling of additional market players (up to five)

Key Questions Addressed by the Report

What primary factor is propelling the growth of the paper chemicals market?

The key factor driving the growth of the paper chemicals market is the expansion of tissue and hygiene paper application.

How is the paper chemicals market segmented in terms of the application?

The paper chemicals market based on the application segmented into papermaking, pulp production, and water process treatment.

What are the major challenges in the paper chemicals market?

Supply-chain disruptions and geopolitical risks are the major challenge in the paper chemicals market.

What are the major opportunities in the paper chemicals market?

Growth in emerging markets is a key opportunity area in the paper chemicals market.

Which region has the most significant demand?

The Asia Pacific region stands out as having the highest demand for paper chemicals.

Who are the major manufacturers of paper chemicals?

Major players in the paper chemicals market are Solenis (US), Kemira (Finland), Ecolab Inc. (US), and Buckman (US).

Personalize This Research

  • Triangulate with your Own Data
  • Get Data as per your Format and Definition
  • Gain a Deeper Dive on a Specific Application, Geography, Customer or Competitor
  • Any level of Personalization
Request A Free Customisation

Let Us Help You

  • What are the Known and Unknown Adjacencies Impacting the Paper Chemicals Market
  • What will your New Revenue Sources be?
  • Who will be your Top Customer; what will make them switch?
  • Defend your Market Share or Win Competitors
  • Get a Scorecard for Target Partners
Customized Workshop Request

Custom Market Research Services

We Will Customise The Research For You, In Case The Report Listed Above Does Not Meet With Your Requirements

Get 10% Free Customisation

TESTIMONIALS

Growth opportunities and latent adjacency in Paper Chemicals Market

DMCA.com Protection Status
popup img