Pneumatic Tube System Market by System Type, System Configuration (Multiline, Single-Line, & Point-to-Point), Function (Fully Automatic & Semi-Automatic), End User (Medical and Healthcare, Commercial, & Industrial), and Region - Global Forecast to 2025-2036


The global pneumatic tube system market was valued at USD 2.50 billion in 2024 and is estimated to reach USD 5.50 billion by 2036, at a CAGR of 6.7% between 2025 and 2036.
The global pneumatic tube system market is driven by increasing demand for automation and operational efficiency across the healthcare sector. Hospitals, laboratories, and clinics worldwide are adopting pneumatic tube systems to ensure rapid, safe, and contactless transportation of blood samples, medications, and medical reports. With rising patient volumes and the growing emphasis on timely diagnostics and treatment, healthcare facilities are under pressure to enhance internal logistics and reduce manual handling errors. Pneumatic tube systems address these challenges by offering high-speed, reliable delivery solutions that minimize human involvement and optimize hospital workflows.

A pneumatic tube system (PTS), often called an air tube system or capsule pipeline, also known as pneumatic tube transport (PTT), is a means of transporting small payloads, typically up to a maximum of 5 kg, within a cylindrical carrier through a network of tubes between different locations by air or by partial vacuum.
Market by End-User
Medical and Healthcare
In the pneumatic tube system market, the medical and healthcare end-user segment is expected to hold the largest market share due to the critical need for fast and secure internal transport of materials within hospitals and laboratories. PTS enables rapid delivery of blood samples, medications, laboratory specimens, and medical documents, reducing delays and improving patient care. With increasing patient volumes and the rising demand for efficient hospital operations, healthcare facilities are investing heavily in automated logistics solutions. The system minimizes manual handling, lowers the risk of errors, and ensures timely and reliable transport, which is crucial for emergency care and diagnostic processes. Moreover, hospitals are integrating smart technologies such as RFID tracking and digital monitoring for better control and accountability. The growth of modern healthcare infrastructure, especially in emerging regions, further drives adoption.
Commercial
In the pneumatic tube system market, the commercial end-user segment is expected to witness the highest CAGR over the forecast period. This growth is primarily driven by the rising adoption of PTS in retail, banking, and corporate facilities to streamline internal logistics and improve operational efficiency. Commercial establishments are increasingly investing in automation to handle cash, documents, and small parcels securely and quickly, reducing manual labor and human error. The demand is further boosted by the need for faster transaction processing in banks and enhanced material flow in large office complexes and warehouses.
Market by System Type
Three-Phase
In the pneumatic tube system market, the three-phase system type is expected to hold the largest market size during the forecast period. Three-phase systems are widely preferred because they provide higher power efficiency, greater load handling capacity, and stable operation compared to single-phase systems, making them ideal for large-scale commercial and healthcare facilities. These systems can operate multiple carriers simultaneously, ensuring faster and more reliable transportation of materials such as medications, laboratory samples, documents, and cash.
Single-Phase
In the pneumatic tube system market, the single-phase system type is expected to witness the highest CAGR during the forecast period. Single-phase systems are typically more cost-effective, compact, and easier to install, making them attractive for small- and medium-sized commercial facilities, clinics, and retail establishments. These systems are suitable for shorter distances and lower-volume operations, where full three-phase capacity is not required. The rising demand for automation in small-scale hospitals, pharmacies, and offices is driving the adoption of single-phase PTS.
Market by Geography
Geographically, the pneumatic tube system market is experiencing widespread adoption across North America, Europe, Asia Pacific, and the Middle East & Africa. Asia Pacific is expected to witness the highest CAGR, driven by the rapid expansion of healthcare infrastructure, including new hospitals, diagnostic labs, and clinics, particularly in countries such as China, India, and Japan. Rising patient volumes, increasing healthcare spending, and the adoption of advanced automation technologies in medical facilities are boosting demand for efficient internal logistics solutions like PTS. Additionally, the growth of the retail and commercial sectors, coupled with rising awareness of operational efficiency, is further accelerating adoption in non-healthcare applications. Governments in the region are also supporting digitalization and smart infrastructure initiatives, which encourage the integration of automated systems for improved workflow and reduced manual handling. Cost advantages, technological advancements in PTS, and increasing urbanization collectively position Asia Pacific as the fastest-growing market geographically.
Market Dynamics
Driver: Growing Adoption in Healthcare Sector
The increasing need for automation and operational efficiency in hospitals and laboratories is a key driver for the PTS market. Hospitals are adopting pneumatic tube systems to ensure rapid and secure transportation of medications, blood samples, and lab reports, reducing human errors and delays. Rising patient volumes and the demand for faster diagnostics have further accelerated adoption. Additionally, integration with smart sensors and tracking systems enhances reliability and operational monitoring. The automation trend also helps hospitals optimize labor costs while improving workflow efficiency. Emerging economies in Asia Pacific and the Middle East are expanding healthcare infrastructure, which boosts PTS installations. The combination of speed, accuracy, and safety makes healthcare a major driver for market growth.
Restraint: High Initial Installation Cost
The pneumatic tube system market faces a major restraint due to its high initial installation cost. Setting up these systems involves substantial expenses for infrastructure modifications, tube network installation, and integration with existing building layouts, especially in large facilities like hospitals or industrial plants. Additionally, the requirement for customized routing, compressor units, and control systems adds to the capital expenditure. The installation process is labor-intensive, requiring skilled technicians to ensure system reliability and safety compliance. Moreover, the cost of maintenance access points and airtight materials further increases setup expenses. As a result, smaller organizations often find it difficult to justify the investment despite the long-term efficiency benefits.
Opportunity: Expansion in Emerging Markets
Emerging economies present a significant opportunity for PTS market growth. Countries in Asia-Pacific, Latin America, and the Middle East are investing heavily in modern healthcare infrastructure, smart commercial buildings, and automated logistics solutions. These regions have a rising middle class, increasing healthcare awareness, and growing adoption of technology, which fuels demand for efficient material transport systems. Additionally, as labor costs rise, facilities seek automation to reduce reliance on manual transport. Companies entering these markets can leverage government initiatives and incentives to provide cost-effective PTS solutions, making this a lucrative growth opportunity.
Challenge: Integration with Existing Infrastructure
One of the major challenges in the PTS market is the difficulty of integrating new systems into existing buildings. Older hospitals, commercial centers, and industrial facilities often have structural constraints, requiring customized tube layouts, additional construction, or retrofitting, which can be complex and costly. Integration also involves compatibility with current IT systems, workflow processes, and staff training. Delays or technical issues during implementation can disrupt operations temporarily. Moreover, maintenance and upgrades in older infrastructures may be challenging, which can hinder widespread adoption despite the benefits of PTS.
Future Outlook
Between 2025 and 2036, the pneumatic tube system market is expected to expand significantly as organizations across multiple sectors increasingly prioritize automation, efficiency, and secure material handling. The growing demand for rapid, contactless, and reliable intra-facility transport of materials, especially in healthcare, commercial, and industrial environments will be a key catalyst. Hospitals will continue to adopt PTS for fast delivery of laboratory samples, blood units, and medications, improving workflow efficiency and patient care. Meanwhile, the commercial sector including banks, retail stores, and logistics centers is expected to embrace pneumatic tube systems for secure cash handling, document transfer, and small parcel movement.
Key Market Players
Top pneumatic tube system companies Swisslog Holding AG (Switzerland), Aerocom GmbH & Co. (Germany), PEVCO (US), Quirepace Limited (UK), Eagle Pneumatic, Inc. (US).
Key Questions addressed in this report:
- What are the global trends in demand for the market?
- What are the upcoming technologies/product areas that will have a significant impact on the market in the future?
- What will be the revenue pockets for the market players in the next 11 years?
- What are the prime strategies followed by key players in the market?
 Exclusive indicates content/data unique to MarketsandMarkets and not available with any competitors.
Table of Contents
1 Introduction (Page No. - 15)
1.1 Objectives of the Study of Pneumatic Tube System
1.2 Market Definition
1.3 Study Scope
1.3.1 Markets Covered
1.3.2 Geographic Scope
1.3.3 Years Considered for the Study
1.4 Currency
1.5 Limitations
1.6 Market Stakeholders
2 Research Methodology (Page No. - 19)
2.1 Research Data
2.1.1 Secondary Data
2.1.1.1 List of Major Secondary Sources
2.1.1.2 Key Data From Secondary Sources
2.1.2 Primary Data
2.1.2.1 Primary Interviews With Experts
2.1.2.2 Key Data From Primary Sources
2.1.2.3 Key Industry Insights
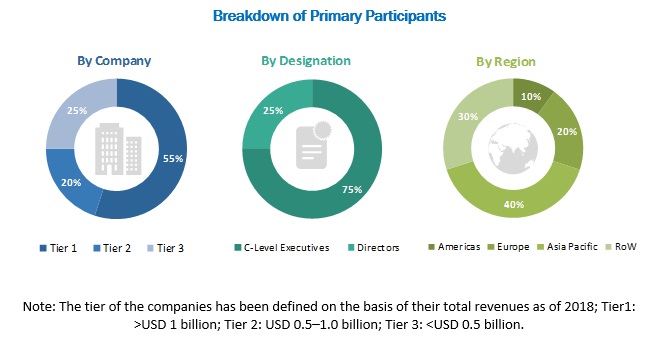
2.1.2.4 Breakdown of Primaries
2.1.3 Secondary and Primary Research
2.2 Market Size Estimation
2.2.1 Bottom-Up Approach
2.2.1.1 Approach for Capturing the Market Share By Bottom-Up Analysis (Demand Side)
2.2.2 Top-Down Approach
2.2.2.1 Approach for Capturing the Market Share By Top-Down Analysis (Supply Side)
2.3 Market Ranking Estimation
2.4 Market Breakdown and Data Triangulation
2.5 Research Assumptions
3 Executive Summary (Page No. - 29)
4 Premium Insights (Page No. - 33)
4.1 Attractive Opportunities in Market
4.2 Market, By System Configuration
4.3 Market in Europe, By Application and Country
4.4 Market, By End User
4.5 Market, By Region
4.6 Country-Wise Analysis of Market
5 Market Overview (Page No. - 36)
5.1 Introduction
5.2 Market Dynamics
5.2.1 Drivers
5.2.1.1 Demand for Automation in Material Handling Across Industries
5.2.1.2 Growing Medical Automation for Reproducibility and Accuracy
5.2.1.3 Emerging E-Commerce Industry
5.2.1.4 Enhanced Productivity Enabled By Improved Supply Chain Processes
5.2.2 Restraints
5.2.2.1 High Installation and Switching Cost
5.2.3 Opportunities
5.2.3.1 Thriving Recycling and Waste Treatment Worldwide
5.2.3.2 Technological Innovation With Improved Capabilities
5.2.4 Challenges
5.2.4.1 Survival of Small Players and New Entrants
5.3 Value Chain Analysis
6 Pneumatic Tube System Market, By System Type (Page No. - 42)
6.1 Introduction
6.2 Single Phase
6.2.1 Medical and Healthcare End-User Segments to Drive the Market Growth
6.3 Three-Phase
6.3.1 Americas to Hold the Largest Market Share for Three-Phase Systems
7 Market, By System Configuration (Page No. - 47)
7.1 Introduction
7.2 Multiline System
7.2.1 Growing Awareness Among Other End Users to Boost Demand
7.3 Single-Line System
7.3.1 Adoption By Commercial End Users to Drive the Market Growth
7.4 Point-To-Point System
7.4.1 Long-Distance Carrier Transfer Capability to Drive Demand
8 Market, By Function (Page No. - 54)
8.1 Introduction
8.2 Fully Automatic
8.2.1 Fully Automatic System to Dominate Market
8.3 Semi-Automatic
8.3.1 Growing Use By Other End Users to Generate Demand
9 Market, By End User (Page No. - 59)
9.1 Introduction
9.2 Medical and Healthcare
9.2.1 Hospitals
9.2.1.1 Hospital Automation Mainly Drives the Market
9.2.2 Laboratories
9.2.2.1 Safe Transfer of Lab Specimen Drives the Market
9.2.3 Pharmacies
9.2.3.1 Systems are Widely Used for Enhancement in Operational Efficiency of Pharmacies
9.3 Commercial
9.3.1 Banks
9.3.1.1 Secure and Safe Cash Transactions Drives the Market
9.3.2 Retails
9.3.2.1 Ability of Faster Transport Than Standard Human Pace Boosts the Demand
9.3.3 Logistics and Warehouses
9.3.3.1 Growing Cost-Effective Departmental Logistics to Drive Market Growth
9.4 Industrial
9.4.1 Manufacturing Plants
9.4.1.1 Reduction in Costs Related to Labor and Operations Increased Deployment
9.4.2 Foundries
9.4.2.1 System for Departmental Logistics Highly Used in Foundries
9.4.3 Recycling Facilities
9.4.3.1 Growing Automated Waste Handling to Boost the Demand
9.5 Others
10 Market, By Region (Page No. - 70)
10.1 Introduction
10.2 Americas
10.2.1 US
10.2.1.1 US to Account for the Largest Share of Market in the Americas
10.2.2 Canada
10.2.2.1 Canada Likely to Grow at A Significant Growth Rate in Market in the Americas
10.2.3 Latin America
10.2.3.1 Inclination Towards Adoption of Automated Systems to Boost Market
10.3 Europe
10.3.1 UK
10.3.1.1 Growing Logistics Automation to Increase Demand
10.3.2 Germany
10.3.2.1 Growing Adoption Rate in Commercial, Government, and Entertainment to Boost the Demand
10.3.3 France
10.3.3.1 Tremendous Growth of E-Commerce to Drive the Market Growth
10.3.4 Rest of Europe
10.4 Asia Pacific
10.4.1 China
10.4.1.1 China Holds Largest Share of APAC Market
10.4.2 Japan
10.4.2.1 Well Established Medical and Healthcare Industry Augments the Market Growth
10.4.3 India
10.4.3.1 Indian Market Likely to Grow at A Significant Rate
10.4.4 Rest of APAC
10.5 Rest of the World
10.5.1 Middle East
10.5.1.1 Growing Material Handling Equipment Deployment Driving Demand for System
10.5.2 Africa
10.5.2.1 Grow Installment in Medical and Healthcare Fields in Africa to Boost the Demand
11 Competitive Landscape (Page No. - 89)
11.1 Overview
11.2 Market Ranking Analysis
11.3 Competitive Leadership Mapping
11.3.1 Visionary Leaders
11.3.2 Dynamic Differentiators
11.3.3 Innovators
11.3.4 Emerging Companies
11.4 Strength of Product Portfolio (For 25 Players)
11.5 Business Strategy Excellence (For 25 Players)
11.6 Competitive Scenario
11.6.1 Product Launches, Acquisitions, and Expansions
12 Company Profile (Page No. - 97)
12.1 Introduction
(Business Overview, Products Offered, Recent Developments, MnM View, SWOT Analysis)*
12.2 Key Players
12.2.1 Swisslog Holding
12.2.2 Aerocom
12.2.3 Pevco
12.2.4 Quirepace
12.2.5 Eagle Pneumatic
12.2.6 Telecom Bedrijfscommunicatie
12.2.7 Kelly Systems
12.2.8 Hamilton Security
12.2.9 Air Link International
12.2.10 Siebtechnik
12.3 Other Key Players
12.3.1 Sumetzberger
12.3.2 Colombo
12.3.3 Hanter Ingenjorsteknik
12.3.4 Air-Log
12.3.5 Zip Pneumatics
12.4 Key Innovators
12.4.1 Hanazeher Electronics
12.4.2 Oppent
12.4.3 Thalmayr
12.4.4 Lamson Group
12.4.5 S&S Engineering
*Business Overview, Products Offered, Recent Developments, MnM View, SWOT Analysis Might Not Be Captured in Case of Unlisted Companies.
13 Appendix (Page No. - 120)
13.1 Discussion Guide
13.2 Knowledge Store: Marketsandmarkets’ Subscription Portal
13.3 Available Customizations
13.4 Related Reports
13.5 Author Details
List of Tables (61 Tables)
Table 1 Market, By System Type, 2016–2024 (USD Million)
Table 2 Market for Single Phase, By End User, 2016–2024 (USD Million)
Table 3 Market for Single Phase, By Region, 2016–2024 (USD Million)
Table 4 Market for Three Phase, By End User, 2016–2024 (USD Million)
Table 5 Market for Three Phase, By Region, 2016–2024 (USD Million)
Table 6 Market, By System Configuration, 2016–2024 (USD Million)
Table 7 Market for Multiline System, By Function, 2016–2024 (USD Million)
Table 8 Market for Multiline System, By End User, 2016–2024 (USD Million)
Table 9 Market for Multiline System, By Region, 2016–2024 (USD Million)
Table 10 Market for Single-Line System, By Function, 2016–2024 (USD Million)
Table 11 Market for Single-Line System, By End User, 2016–2024 (USD Million)
Table 12 Market for Single-Line System, By Region, 2016–2024 (USD Million)
Table 13 Market for Point-To-Point System, By Function, 2015–2024 (USD Million)
Table 14 Market for Point-To-Point System, By End User, 2016–2024 (USD Million)
Table 15 Market for Point-To-Point System, By Region, 2016–2024 (USD Million)
Table 16 Market, By Function, 2016–2024 (USD Million)
Table 17 Market for Fully Automatic, By System Configuration, 2016–2024 (USD Million)
Table 18 Market for Fully Automatic, By End User, 2016–2024 (USD Million)
Table 19 Market for Fully Automatic, By Region, 2016–2024 (USD Million)
Table 20 Market for Semi-Automatic, By System Configuration, 2016–2024 (USD Million)
Table 21 Market for Semi-Automatic, By End User, 2016–2024 (USD Million)
Table 22 Market for Semi-Automatic, By Region, 2016–2024 (USD Million)
Table 23 Market, By End User, 2016–2024 (USD Million)
Table 24 Market for Medical and Healthcare, By System Configuration, 2016–2024 (USD Million)
Table 25 Market for Medical and Healthcare, By System Type, 2016–2024 (USD Million)
Table 26 Market for Medical and Healthcare, By Function, 2016–2024 (USD Million)
Table 27 Market for Medical & Healthcare, By Region, 2016–2024 (USD Million)
Table 28 Market for Commercial, By System Configuration, 2016–2024 (USD Million)
Table 29 Market for Commercial, By System Type, 2016–2024 (USD Million)
Table 30 Market for Commercial, By Function, 2016–2024 (USD Million)
Table 31 Market for Commercial, By Region, 2016–2024 (USD Million)
Table 32 Market for Industrial, By System Configuration, 2016–2024 (USD Million)
Table 33 Market for Industrial, By System Type, 2016–2024 (USD Million)
Table 34 Market for Industrial, By Function, 2016–2024 (USD Million)
Table 35 Market for Industrial, By Region, 2016–2024 (USD Million)
Table 36 Market for Other End Users, By System Configuration, 2016–2024 (USD Million)
Table 37 Market for Other End Users, By System Type, 2016–2024 (USD Million)
Table 38 Market for Other End Users, By Function, 2016–2024 (USD Million)
Table 39 Market for Other End Users, By Region, 2016–2024 (USD Million)
Table 40 Market, By Region, 2016–2024 (USD Million)
Table 41 Market in the Americas, By System Configuration, 2016–2024 (USD Million)
Table 42 Market in the Americas, By System Type, 2016–2024 (USD Million)
Table 43 Market in the Americas, By Function, 2016–2024 (USD Million)
Table 44 Market in the Americas, By End User, 2016–2024 (USD Million)
Table 45 Market in Americas, By Country 2016–2024 (USD Million)
Table 46 Market in Europe, By System Configuration, 2016–2024 (USD Million)
Table 47 Market in Europe, By System Type, 2016–2024 (USD Million)
Table 48 Market in Europe, By Function, 2016–2024 (USD Million)
Table 49 Market in Europe, By End User, 2016–2024 (USD Million)
Table 50 Market in Europe, By Country 2016–2024 (USD Million)
Table 51 Market in APAC, By System Configuration, 2016–2024 (USD Million)
Table 52 Market in APAC, By System Type, 2016–2024 (USD Million)
Table 53 Market in APAC, By Function, 2016–2024 (USD Million)
Table 54 Market in APAC, By End User, 2016–2024 (USD Million)
Table 55 Market in APAC, By Country 2016–2024 (USD Million)
Table 56 Market in RoW, By System Configuration, 2016–2024 (USD Million)
Table 57 Market in RoW, By System Type, 2016–2024 (USD Million)
Table 58 Market in RoW, By Function, 2016–2024 (USD Million)
Table 59 Market RoW, By End User, 2016–2024 (USD Million)
Table 60 Market in RoW, By Country 2016–2024 (USD Million)
Table 61 Product Launches, Acquisitions, and Expansions in Market
List of Figures (30 Figures)
Figure 1 Research Design
Figure 2 Process Flow
Figure 3 Market Size Estimation Methodology: Bottom-Up Approach
Figure 4 Market Size Estimation Methodology: Top-Down Approach
Figure 5 Data Triangulation
Figure 6 Multiline System and Fully Automatic Function of System Expected to Hold Major Shares Throughout the Forecast Period
Figure 7 Medical and Healthcare is Expected to Hold the Largest Share Throughout the Forecast Period
Figure 8 APAC Likely to Be Fastest-Growing Region in Market During Forecast Period
Figure 9 Demand for Automation in Material Handling Across Industries Driving the Market
Figure 10 Multiline Expected to Hold Largest Market Share of Market Throughout Forecast Period
Figure 11 Medical and Healthcare End User and Market in Germany Expected to Account for Largest Shares in Europe in 2019
Figure 12 Medical and Healthcare to Hold Largest Share of Market Throughout Forecast Period
Figure 13 Market in APAC Expected to Grow at Highest CAGR During Forecast Period
Figure 14 US Expected to Account for Largest Share of Market in 2019
Figure 15 Demand for Automation in Material Handling Across Industries is Driving the Market
Figure 16 Value Chain Analysis: Major Value Added During the Original Equipment Manufacturing Phase
Figure 17 Single-Phase to Grow at the Highest Cage During the Forecast Period
Figure 18 Multiline System to Grow at the Highest Rate During the Forecast Period
Figure 19 Fully Automatic to Grow at A Higher CAGR During the Forecast Period
Figure 20 Commercial to Grow at the Highest CAGR During the Forecast Period
Figure 21 Market: Geographic Analysis
Figure 22 Market Snapshot: Americas
Figure 23 Market Snapshot: Europe
Figure 24 Market Snapshot: APAC
Figure 25 Market Snapshot: RoW
Figure 26 Market, Companies Adopted Both Organic and Inorganic Growth Strategies Between January 2016 and October 2018
Figure 27 Top 5 Players in the Market, 2018
Figure 28 Market (Global) Competitive Leadership Mapping, 2018
Figure 29 Market Evaluation Framework
Figure 30 Swisslog Holding: Company Snapshot
The study involved 4 major activities in estimating the current size of the pneumatic tube system market. Exhaustive secondary research was done to collect information on the market, peer market, and parent market. The next step was to validate these findings, assumptions, and sizing with industry experts across value chain through primary research. Both top-down and bottom-up approaches were employed to estimate the complete market size. After that, market breakdown and data triangulation methods were used to estimate the market size of segments and subsegments.
Secondary Research
The research methodology used to estimate and forecast of market begins with capturing data on revenues of key vendors in the market through secondary research. This study incorporates the use of extensive secondary sources, directories, and databases such as Hoovers, Bloomberg Businessweek, Factiva, and OneSource to identify and collect information useful for the technical, market-oriented, and commercial study of the market. Vendor offerings have also been considered to determine the market segmentation. This entire research methodology includes the study of annual and financial reports of top players, presentations, press releases, journals, paid databases, trade directories, regulatory bodies, and safety standard organizations of pneumatic tube system market.
Primary Research
The pneumatic tube system market comprises several stakeholders, such as vendors of pneumatic tube system; research and development (R&D) organizations; hospitals and clinics; diagnostic centers; technology, service, and solution providers; intellectual property (IP) core and licensing providers; solutions providers, and system integrators in the supply chain. The supply side is characterized by advancements in pneumatic tube system, their end users, and their growing number of applications. Various primary sources from both the supply and demand sides of the market were interviewed to obtain qualitative and quantitative information. Following is the breakdown of primary respondents.
To know about the assumptions considered for the study, download the pdf brochure
Market Size Estimation
Both top-down and bottom-up approaches have been used to estimate and validate the total size of the pneumatic tube system market. These methods have also been used extensively to estimate the size of various market subsegments. The research methodology used to estimate the market size includes:
- Key players in major end user segments and markets were identified through extensive secondary research.
- The industry’s supply chain and market size, in terms of value, were determined through primary and secondary research processes.
- All percentage shares, splits, and breakdowns were determined using secondary sources and verified through primary sources.
Data Triangulation
After arriving at the overall market size—using the estimation processes as explained above—the market was split into several segments and subsegments. To complete the overall market engineering process and arrive at the exact statistics of each market segment and subsegment, data triangulation and market breakdown procedures were employed, wherever applicable. The data was triangulated by studying various factors and trends from both the demand and supply sides in the areas of pneumatic tube system market.
Research Objective
- To define, describe, segment, and forecast the global market, in terms of value, on the basis of system type, system configuration, function, end user, and geography
- To forecast of market size, in terms of value, for system type, system configuration, function, end user segments with regard to four main regions, namely, Americas, Europe, Asia Pacific (APAC), and Rest of the World (RoW)
- To strategically analyze the micromarkets with regard to the individual growth trends, prospects, and contribution to the market
- To provide detailed information regarding the major factors (drivers, restraints, opportunities, and industry-specific challenges) influencing the growth of market
- To analyze opportunities in the market for stakeholders and the details of the competitive landscape for leaders in the market
- To provide a detailed overview of the value chain in the market
- To analyze competitive developments such as expansion, mergers and acquisitions, and product launches, along with research and development (R&D) in market
- To strategically profile key players of the market and comprehensively analyze their market ranking and core competencies
Available Customizations
Along with the market data, MarketsandMarkets offers customizations according to a company’s specific needs. The following customization options are available for the report:
Company Information
- Detailed analysis and profiling of additional market players (Up to 5)
Critical Questions
- What are new end-user areas being explored by the pneumatic tube system solution providers?
- Which are the key players in the market, and how intense is the competition?


Growth opportunities and latent adjacency in Pneumatic Tube System Market