Smart Clothing Market by Textile Type, Product Type (Upper Wear, Lower Wear, Innerwear, and Others), End-User Industry (Military & Defense, Sports & Fitness, Fashion & Entertainment, Healthcare), and Geography - Global Forecast to 2025-2035


The global smart clothing market was valued at USD 4.04 billion in 2024 and is estimated to reach USD 26.89 billion by 2035, at a CAGR of 18.8% between 2025 and 2035.
The Smart Clothing Market is primarily driven by the rising consumer demand for wearable technology that seamlessly integrates health monitoring, fitness tracking, and connectivity into everyday apparel. Increasing health awareness, coupled with the growth of fitness and sports activities, has accelerated the adoption of garments embedded with sensors and IoT devices. Additionally, advancements in flexible electronics, conductive fabrics, and wireless communication technologies are enabling more functional, comfortable, and stylish smart clothing, further boosting market growth globally.

The Smart Clothing Market is further propelled by the expanding applications in healthcare, sports, and military sectors, where real-time monitoring of vital signs, posture, and performance is critical. Rising consumer preference for personalized and tech-enabled fashion, along with innovations in textile engineering, flexible sensors, and energy-efficient electronics, enhances usability and comfort. Moreover, increasing collaborations between tech companies and apparel brands are accelerating product development, adoption, and market penetration worldwide.
Market by Textile Type
Active Smart Textile
Active smart textiles are emerging as one of the fastest-growing segments in the smart clothing market due to their ability to interact dynamically with the wearer, monitoring physiological parameters such as heart rate, body temperature, and muscle activity. These textiles integrate sensors and conductive fibers that provide real-time data, enhancing applications in healthcare, fitness, and performance sports. Ultra-smart textiles, which feature highly advanced functionalities including energy harvesting, self-cleaning properties, and wireless connectivity, are expected to dominate market share. Their adoption is driven by innovations in materials science and the increasing demand for multifunctional apparel that combines comfort, performance, and technological sophistication.
Ultra-smart Textile
Ultra-smart textiles are projected to capture the largest market share in the smart clothing sector due to their advanced integration of sensors, actuators, and microelectronics directly into fabrics. These textiles enable real-time data collection and intelligent response systems, making them highly suitable for healthcare monitoring, military applications, and professional sports. The segment benefits from significant investments in research and development, enhanced textile-electronics compatibility, and partnerships between technology providers and fashion brands, further cementing their dominance in the smart clothing market.
Market by Product Type
Upper wear
Upper wear is expected to remain one of the highest-growing and highest-market-share product types in the smart clothing market. This includes smart shirts, jackets, and vests embedded with sensors for heart rate, posture, and temperature monitoring. Upper wear is particularly favored in sports, fitness, and healthcare applications due to its accessibility and functionality. Continuous innovation in lightweight materials, wireless connectivity, and seamless integration of electronics into fabrics is driving rapid adoption among consumers seeking comfort, performance, and real-time health monitoring.
Lower wear
Lower wear, including smart pants, leggings, and shorts, is projected to maintain the second-highest market share and significant growth within the smart clothing market. These products are increasingly used in fitness, rehabilitation, and sports applications for tracking muscle activity, gait, and posture. Innovations in flexible sensors, moisture-wicking fabrics, and integrated communication systems enhance usability and wearer comfort. The growing trend of full-body wearable solutions and increasing consumer awareness of performance-enhancing apparel are key factors driving the adoption of smart lower wear.
Market by End-user Industry
Sports & Fitness
The sports and fitness sector is expected to remain one of the highest-growing end-user industries in the smart clothing market. Smart apparel in this segment enables real-time monitoring of heart rate, calories burned, posture, and other vital metrics, helping athletes optimize performance and reduce injury risks. Increasing participation in fitness activities, combined with rising awareness of health and wellness, is fueling demand. Technological advancements in lightweight fabrics, flexible sensors, and wireless connectivity further enhance product appeal, making sports and fitness a key growth driver for the market.
Military & Defense
The military and defense segment is projected to capture the largest market share in the smart clothing industry due to its critical need for advanced wearable technologies. Smart uniforms equipped with sensors, GPS systems, and health monitoring devices enhance soldier safety, situational awareness, and operational efficiency. Significant government investments in defense R&D, coupled with rising adoption of IoT-enabled wearable solutions, are driving market expansion. The durability, multifunctionality, and real-time intelligence offered by smart clothing make it indispensable for modern military and defense operations.
Market by Geography
Geographically, the smart clothing market is experiencing widespread adoption across North America, Europe, Asia Pacific, and the Middle East & Africa. Asia Pacific leads the global smart clothing market due to rapid technological adoption, increasing disposable incomes, and a growing sports and fitness culture. Countries like China, Japan, and South Korea are investing heavily in wearable technology R&D and manufacturing infrastructure. Additionally, collaborations between local textile manufacturers and tech companies accelerate innovation in sensor-embedded fabrics. Rising consumer awareness of health monitoring and the popularity of fitness tracking devices further stimulate demand. As a result, Asia Pacific continues to demonstrate strong growth potential and dominates the smart clothing market globally.
Market Dynamics
Driver: Rising Demand for Monitoring Bodily Activities Through Sensors
The rising demand for real-time monitoring of bodily activities is a key driver for the smart clothing market. Consumers increasingly seek apparel embedded with sensors capable of tracking heart rate, body temperature, posture, and muscle activity. Such garments offer actionable insights for fitness enthusiasts, athletes, and healthcare patients, enabling performance optimization and early detection of health anomalies. Technological advancements in flexible electronics, miniaturized sensors, and wireless connectivity have made it easier to integrate monitoring capabilities into fabrics, driving widespread adoption and contributing significantly to market growth globally.
Restraint: High Cost of Products
The high cost of smart clothing products remains a significant restraint in market adoption. Advanced textiles embedded with sensors, microelectronics, and IoT connectivity incur higher manufacturing and research expenses, which translate to premium prices for consumers. This price barrier limits penetration, especially in price-sensitive regions and among casual fitness users. Additionally, the cost of maintenance, software updates, and potential device replacements further discourages widespread adoption. Until production scalability improves and manufacturing costs decrease, the high price point will continue to hinder mass-market growth for smart clothing.
Opportunity: Growing Awareness About the Need for Sports & Fitness
Growing awareness about sports, fitness, and overall health presents a significant opportunity for the smart clothing market. Increasing consumer focus on personal wellness and preventive healthcare has led to greater interest in garments that provide real-time performance monitoring, posture correction, and biometric tracking. Fitness apps, social media trends, and wearable technology integration are further educating consumers on the benefits of smart apparel. This rising consciousness creates opportunities for product innovation, strategic marketing, and expansion into emerging markets, allowing smart clothing brands to target a broader and more health-conscious audience.
Challenge: Technical Complications
Technical complications pose a major challenge to the growth of the smart clothing market. Integrating sensors, conductive threads, and wireless modules into flexible, durable, and comfortable fabrics requires sophisticated engineering. Issues such as sensor accuracy, durability during washing, power efficiency, and data security can limit usability and consumer trust. Additionally, compatibility with multiple devices and seamless software integration remains a technical hurdle. Addressing these challenges requires ongoing R&D investment, skilled workforce, and standardized protocols, which can slow down product development and market penetration despite rising demand.
Future Outlook
Between 2025 and 2035, the smart clothing market is expected to witness substantial growth as wearable technology becomes integral to healthcare, sports, fitness, and military applications. Advances in flexible sensors, IoT connectivity, and AI-driven analytics will enable garments to provide real-time monitoring of vital signs, posture, and performance, transforming clothing into intelligent, interactive apparel. Rising health awareness, growing participation in sports and fitness activities, and increasing adoption in defense and rehabilitation sectors will drive market expansion. As the market evolves, smart clothing will play a central role in personalized health management, performance optimization, and connected lifestyle ecosystems globally.
Key Market Players
Top smart clothing companies AiQ Smart Clothing (Taiwan), Athos Therapeutics (California), Sensoria (US), Hexoskin (Canada), and Under Armour (US).
Key Questions addressed in this report:
- What are the global trends in demand for the market?
- What are the upcoming technologies/product areas that will have a significant impact on the market in the future?
- What will be the revenue pockets for the market players in the next 6 years?
- What are the prime strategies followed by key players in the market?
 Exclusive indicates content/data unique to MarketsandMarkets and not available with any competitors.
Table of Contents
1 Introduction (Page No. - 16)
1.1 Study Objectives
1.2 Definition
1.2.1 Inclusions and Exclusions
1.3 Study Scope
1.3.1 Markets Covered
1.4 Years Considered
1.5 Currency
1.6 Stakeholders
2 Research Methodology (Page No. - 19)
2.1 Research Data
2.1.1 Secondary Data
2.1.1.1 Major Secondary Sources
2.1.1.2 Key Data From Secondary Sources
2.1.2 Primary Data
2.1.2.1 Primary Interviews With Experts
2.1.2.2 Breakdown of Primaries
2.1.2.3 Key Data From Primary Sources
2.1.2.4 Key Industry Insights
2.2 Market Size Estimation
2.2.1 Bottom-Up Approach
2.2.1.1 Approach for Capturing the Market Size By Bottom-Up Analysis (Demand Side)
2.2.2 Top-Down Approach
2.2.2.1 Approach for Capturing the Market Size By Top-Down Analysis (Supply Side)
2.3 Market Breakdown and Data Triangulation
2.4 Research Assumptions
3 Executive Summary (Page No. - 28)
4 Premium Insights (Page No. - 31)
4.1 Attractive Opportunities for the Smart Clothing Market
4.2 Market, By Product Type
4.3 Market, By End-User Industry and Country
4.4 Geographic Snapshot of the Market
5 Market Overview (Page No. - 34)
5.1 Introduction
5.2 Market Dynamics
5.2.1 Drivers
5.2.1.1 Rising Demand for Monitoring Bodily Activities Through Sensors
5.2.1.2 Increasing Adoption of Smart Clothes for Various End-User Industries
5.2.2 Restraints
5.2.2.1 High Cost of Products
5.2.3 Opportunities
5.2.3.1 Growing Awareness About the Need for Sports & Fitness
5.2.4 Challenges
5.2.4.1 Technical Complications
6 Smart Clothing Market, By Textile Type (Page No. - 39)
6.1 Introduction
6.2 Active Smart
6.2.1 Sports and Fitness Segment to Grow at Highest CAGR in the Forecast Period
6.3 Passive Smart
6.3.1 Military and Defense to Occupy the Largest Share in the Market
6.4 Ultra-Smart
6.4.1 Sports and Fitness to Occupy the Largest Share for Ultra Smart Clothing
7 Smart Clothing Market, By Product Type (Page No. - 45)
7.1 Introduction
7.2 Upper Wear
7.2.1 Upper Wear Segment to Account for the Largest Share
7.3 Lower Wear
7.3.1 Lower Wear Segment to Capture A Significant Share for Sports & Fitness During Forecast Period
7.4 Innerwear
7.4.1 Market for Innerwear Projected to Be the Largest for Military & Defense During Forecast Period
7.5 Others
8 Smart Clothing Market, By End-User Industry (Page No. - 52)
8.1 Introduction
8.2 Military & Defense
8.2.1 Upper Wear Segment to Dominate the Market for Military & Defense During the Forecast Period
8.3 Sports & Fitness
8.3.1 Market for Sports & Fitness in the APAC Region to Grow at the Highest CAGR
8.4 Fashion & Entertainment
8.4.1 North America to Dominate the Fashion & Entertainment Vertical During the Forecast Period
8.5 Healthcare
8.5.1 APAC to Register the Highest Growth Rate for Healthcare
8.6 Mining
8.6.1 North America to Dominate the Market During the Forecast Period
8.7 Others
8.7.1 APAC to Grow at the Highest CAGR for Verticals Such as Construction, Transportation, and Automotive
9 Smart Clothing Market, By Region (Page No. - 83)
9.1 Introduction
9.2 North America
9.2.1 US
9.2.1.1 Presence of Leading Smart Clothing Manufacturers in North America Driving the Market Growth in the US
9.2.2 Canada
9.2.2.1 Growth of the IoT Platform and Its Related Components Propelling the Growth of the Market
9.2.3 Mexico
9.2.3.1 Rising Adoption of New and Innovative New Technologies in Manufacturing Processes Propelling the Growth of the Market
9.3 Europe
9.3.1 Germany
9.3.1.1 Advancements in Wearable Technology, Growing Awareness, and Inclination Toward Smart Clothing to Drive the Market During the Forecast Period
9.3.2 UK
9.3.2.1 Adoption of Smart Clothes for the Sports & Fitness Industry Driving Market Growth in the UK
9.3.3 France
9.3.3.1 Increasing Demand for Portable Electronic Products From the Healthcare Industry
9.3.4 Italy
9.3.4.1 Increasing Demand for Fitness Bands and Health Monitoring Wearables to Drive the Market During the Forecast Period
9.3.5 Rest of Europe
9.4 Asia Pacific
9.4.1 China
9.4.1.1 China to Witness Rapid Growth in the Global Market During the Forecast Period
9.4.2 Japan
9.4.2.1 Japan Witnesses the Highest Demand for Smart Clothes From the Military & Defense Industry
9.4.3 India
9.4.3.1 Health Monitoring to Be A Market Driver in the Country in the Coming Years
9.4.4 South Korea
9.4.4.1 Upgradation of Technology and Innovation Driving the Market in South Korea
9.4.5 Rest of Asia Pacific
9.5 Rest of the World (RoW)
9.5.1 South and Central America
9.5.1.1 Brazil Propelling the Market in the Region
9.5.2 Middle East and Africa (MEA)
9.5.2.1 Multiple Factors Driving the Market in the Middle East & Africa
10 Competitive Landscape (Page No. - 106)
10.1 Introduction
10.2 Market Player Ranking Analysis
10.3 Competitive Leadership Mapping
10.3.1 Visionary Leaders
10.3.2 Dynamic Differentiators
10.3.3 Innovators
10.3.4 Emerging Companies
10.4 Competitive Benchmarking
10.4.1 Strength of Product Portfolios (15 Companies)
10.4.2 Business Strategy Excellence (15 Companies)
10.5 Competitive Scenario
10.6 Competitive Situations & Trends
10.6.1 Product Launches/Developments
10.6.2 Collaborations/Partnerships
11 Company Profiles (Page No. - 113)
(Business Overview, Products Offered, Recent Developments, SWOT Analysis, and MnM View)*
11.1 Key Companies
11.1.1 AIQ Smart Clothing
11.1.2 Athos
11.1.3 Carre Technologies Inc (Hexoskin)
11.1.4 Sensoria Inc.
11.1.5 Cityzen Sciences
11.1.6 Applycon S.R.O.
11.1.7 Clothing Plus
11.1.8 Dupont
11.1.9 Vulpes Electronics
11.1.10 Wearable X
11.2 Other Key Companies
11.2.1 Myontec
11.2.2 Myzone
11.2.3 Owlet
11.2.4 Siren
11.2.5 Toray Industries, Inc.
*Details on Business Overview, Products Offered, Recent Developments, SWOT Analysis, and MnM View Might Not Be Captured in Case of Unlisted Companies.
12 Appendix (Page No. - 133)
12.1 Discussion Guide
12.2 Knowledge Store: Marketsandmarkets’ Subscription Portal
12.3 Available Customization
12.4 Related Reports
12.5 Author Details
List of Tables (102 Tables)
Table 1 Smart Clothing Market Size, By Textile Type, 2016–2024 (USD Million)
Table 2 Market Size for Active Smart Textiles, By End-User Industry, 2016–2024 (USD Million)
Table 3 Market Size for Passive Smart Textiles, By End-User Industry, 2016–2024 (USD Million)
Table 4 Market Size for Ultra-Smart Textiles, By End-User Industry, 2016–2024 (USD Million)
Table 5 Market Size, By Product Type, 2016–2024 (USD Million)
Table 6 Market Size for Upperwear, By End-User Industry, 2016–2024 (USD Million)
Table 7 Market Size for Lower Wear, By End-User Industry, 2016–2024 (USD Million)
Table 8 Market Size for Innerwear, By End-User Industry, 2016–2024 (USD Million)
Table 9 Market Size for Other Product Types, By End-User Industry, 2016–2024 (USD Million)
Table 10 Market Size, By End-User Industry, 2016–2024 (USD Million)
Table 11 Market Size for Military & Defense, By Product Type, 2016–2024 (USD Million)
Table 12 Market Size for Military & Defense, By Region, 2016–2024 (USD Million)
Table 13 North America: Market Size for Military & Defense, By Country, 2016–2024 (USD Million)
Table 14 Europe: Market Size for Military & Defense, By Country, 2016–2024 (USD Million)
Table 15 Asia Pacific: Market Size for Military & Defense, By Country, 2016–2024 (USD Million)
Table 16 RoW: Market Size for Military & Defense, By Region, 2016–2024 (USD Million)
Table 17 Market Size for Military & Defense, By Textile Type, 2016–2024 (USD Million)
Table 18 North America: Market Size for Military & Defense, By Textile Type, 2016–2024 (USD Million)
Table 19 Europe: Market Size for Military & Defense, By Textile Type, 2016–2024 (USD Million)
Table 20 Asia Pacific: Market Size for Military & Defense, By Textile Type, 2016–2024 (USD Million)
Table 21 RoW: Market Size for Military & Defense, By Textile Type, 2016–2024 (USD Million)
Table 22 Market Size for Sports & Fitness, By Product Type, 2016–2024 (USD Million)
Table 23 Market Size for Sports & Fitness, By Region, 2016–2024 (USD Million)
Table 24 North America: Market Size for Sports & Fitness, By Country, 2016–2024 (USD Million)
Table 25 Europe: Market Size for Sports & Fitness, By Country, 2016–2024 (USD Million)
Table 26 Asia Pacific: Market Size for Sports & Fitness, By Country, 2016–2024 (USD Million)
Table 27 RoW: Market Size for Sports & Fitness, By Region, 2016–2024 (USD Million)
Table 28 Market Size for Sports & Fitness, By Textile Type, 2016–2024 (USD Million)
Table 29 North America: Market Size for Sports & Fitness, By Textile Type, 2016–2024 (USD Million)
Table 30 Europe: Market Size for Sports & Fitness, By Textile Type, 2016–2024 (USD Million)
Table 31 Asia Pacific: Market Size for Sports & Fitness, By Textile Type, 2016–2024 (USD Million)
Table 32 RoW: Market Size for Sports & Fitness, By Textile Type, 2016–2024 (USD Million)
Table 33 Market Size for Fashion & Entertainment, By Product Type, 2016–2024 (USD Million)
Table 34 Market Size for Fashion & Entertainment, By Region, 2016–2024 (USD Million)
Table 35 North America: Market Size for Fashion & Entertainment, By Country, 2016–2024 (USD Million)
Table 36 Europe: Market Size for Fashion & Entertainment, By Country, 2016–2024 (USD Million)
Table 37 Asia Pacific: Market Size for Fashion & Entertainment, By Country, 2016–2024 (USD Million)
Table 38 RoW: Market Size for Fashion & Entertainment, By Region, 2016–2024 (USD Million)
Table 39 Market Size for Fashion & Entertainment, By Textile Type, 2016–2024 (USD Million)
Table 40 North America: Market Size for Fashion & Entertainment, By Textile Type, 2016–2024 (USD Million)
Table 41 Europe: Market Size for Fashion & Entertainment, By Textile Type, 2016–2024 (USD Million)
Table 42 Asia Pacific: Market Size for Fashion & Entertainment, By Textile Type, 2016–2024 (USD Million)
Table 43 RoW: Market Size for Fashion & Entertainment, By Textile Type, 2016–2024 (USD Million)
Table 44 Market Size for Healthcare, By Product Type, 2016–2024 (USD Million)
Table 45 Market Size for Healthcare, By Region, 2016–2024 (USD Million)
Table 46 North America: Market Size for Healthcare, By Country, 2016–2024 (USD Million)
Table 47 Europe: Market Size for Healthcare, By Country, 2016–2024 (USD Million)
Table 48 Asia Pacific: Market Size for Healthcare, By Country, 2016–2024 (USD Million)
Table 49 RoW: Market Size for Healthcare, By Region, 2016–2024 (USD Million)
Table 50 Market Size for Healthcare, By Textile Type, 2016–2024 (USD Million)
Table 51 North America: Market Size for Healthcare, By Textile Type, 2016–2024 (USD Million)
Table 52 Europe: Market Size for Healthcare, By Textile Type, 2016–2024 (USD Million)
Table 53 Asia Pacific: Market Size for Healthcare, By Textile Type, 2016–2024 (USD Million)
Table 54 RoW: Market Size for Healthcare, By Textile Type, 2016–2024 (USD Million)
Table 55 Market Size for Mining, By Product Type, 2016–2024 (USD Million)
Table 56 Market Size for Mining, By Region, 2016–2024 (USD Million)
Table 57 North America: Market Size for Mining, By Country, 2016–2024 (USD Million)
Table 58 Europe: Market Size for Mining, By Country, 2016–2024 (USD Million)
Table 59 Asia Pacific: Market Size for Mining, By Country, 2016–2024 (USD Million)
Table 60 RoW: Market Size for Mining, By Region, 2016–2024 (USD Million)
Table 61 Market Size for Mining, By Textile Type, 2016–2024 (USD Million)
Table 62 North America: Market Size for Mining, By Textile Type, 2016–2024 (USD Million)
Table 63 Europe: Market Size for Mining, By Textile Type, 2016–2024 (USD Million)
Table 64 Asia Pacific: Market Size for Mining, By Textile Type, 2016–2024 (USD Million)
Table 65 RoW: Market Size for Mining, By Textile Type, 2016–2024 (USD Million)
Table 66 Market Size for Others, By Product Type, 2016–2024 (USD Million)
Table 67 Market Size for Others, By Region, 2016–2024 (USD Million)
Table 68 North America: Market Size for Others, By Country, 2016–2024 (USD Million)
Table 69 Europe: Market Size for Others, By Country, 2016–2024 (USD Million)
Table 70 Asia Pacific: Market Size for Others, By Country, 2016–2024 (USD Million)
Table 71 RoW: Market Size for Others, By Region, 2016–2024 (USD Million)
Table 72 Market Size for Others, By Textile Type, 2016–2024 (USD Million)
Table 73 North America: Market Size for Others, By Textile Type, 2016–2024 (USD Million)
Table 74 Europe: Market Size for Others, By Textile Type, 2016–2024 (USD Million)
Table 75 Asia Pacific: Market Size for Others, By Textile Type, 2016–2024 (USD Million)
Table 76 RoW: Market Size for Others, By Textile Type, 2016–2024 (USD Million)
Table 77 Smart Clothing Market Size, By Region, 2016–2024 (USD Million)
Table 78 North America: Market Size, By Country, 2016–2024 (USD Million)
Table 79 North America: Market Size, By End-User Industry, 2016–2024 (USD Million)
Table 80 US: Market Size, By End-User Industry, 2016–2024 (USD Million)
Table 81 Canada: Market Size, By End-User Industry, 2016–2024 (USD Million)
Table 82 Mexico: Market Size, By End-User Industry, 2016–2024 (USD Million)
Table 83 Europe: Market Size, By Country, 2016–2024 (USD Million)
Table 84 Europe: Market Size, By End-User Industry, 2016–2024 (USD Million)
Table 85 Germany: Market Size, By End-User Industry, 2016–2024 (USD Million)
Table 86 UK: Market Size, By End-User Industry, 2016–2024 (USD Million)
Table 87 France: Market Size, By End-User Industry, 2016–2024 (USD Million)
Table 88 Italy: Market Size, By End-User Industry, 2016–2024 (USD Million)
Table 89 Rest of Europe: Market Size, By End-User Industry, 2016–2024 (USD Million)
Table 90 Asia Pacific: Market Size, By Country, 2016–2024 (USD Million)
Table 91 Asia Pacific: Market Size, By End-User Industry, 2016–2024 (USD Million)
Table 92 China: Market Size, By End-User Industry, 2016–2024 (USD Million)
Table 93 Japan: Market Size, By End-User Industry, 2016–2024 (USD Million)
Table 94 India: Market Size, By End-User Industry, 2016–2024 (USD Million)
Table 95 South Korea: Market Size, By End-User Industry, 2016–2024 (USD Million)
Table 96 Rest of Asia Pacific: Market Size, By End-User Industry, 2016–2024 (USD Million)
Table 97 RoW: Market Size, By Region, 2016–2024 (USD Million)
Table 98 RoW: Market Size, By End-User Industry, 2016–2024 (USD Million)
Table 99 South & Central America: Market Size, By End-User Industry, 2016–2024 (USD Million)
Table 100 MEA: Market Size, By End-User Industry, 2016–2024 (USD Million)
Table 101 Product Launches/Developments, 2017–2019
Table 102 Collaborations/Partnerships, 2018
List of Figures (48 Figures)
Figure 1 Smart Clothing Market Segmentation
Figure 2 Smart Clothing Market: Process Flow of Market Size Estimation
Figure 3 Market: Research Design
Figure 4 Market Size Estimation Methodology: Bottom-Up Approach
Figure 5 Market Size Estimation Methodology: Top-Down Approach
Figure 6 Data Triangulation
Figure 7 Research Assumptions
Figure 8 The Active Smart Segment is Projected to Lead the Market During the Forecast Period
Figure 9 The Upperwear Segment is Projected to Dominate the Market During the Forecast Period
Figure 10 The Market for the Sports & Fitness Industry is Projected to Grow at the Highest CAGR During the Forecast Period
Figure 11 North America Accounted for the Largest Share of the Market in 2018
Figure 12 Increasing Adoption of Smart Clothes for Various End-User Industries
Figure 13 Upper Wear Segment to Grow at the Highest CAGR During the Forecast Period
Figure 14 The US Market Accounted for the Largest Share in the Global Market in 2018
Figure 15 China is Projected to Grow at the Highest CAGR During the Forecast Period
Figure 16 Market Drivers and Their Impact
Figure 17 Declining Cost of Sensors Likely to Drive the Overall Market
Figure 18 Market Restraints and Their Impact
Figure 19 Market Opportunities and Their Impact
Figure 20 Market Challenges and Their Impact
Figure 21 Ultra-Smart Textiles Segment to Grow at the Highest CAGR During the Forecast Period
Figure 22 Market Size for Passive Smart Textiles, By End-User Industry, 2019 vs 2024 (USD Million)
Figure 23 Market Size for Ultra-Smart Textiles, By End-User Industry, 2019 vs 2024 (USD Million)
Figure 24 Market for Upper Wear to Grow at the Highest CAGR During the Forecast Period
Figure 25 Market Size for Upper Wear, By End-User Industry, 2019 vs 2024 (USD Million)
Figure 26 Market for Innerwear, By End-User Industry, 2019 vs 2024 (USD Million)
Figure 27 Market for Sports & Fitness to Grow at the Highest CAGR During the Forecast Period
Figure 28 Upper Wear Segment to Dominate the Market for Military & Defense During the Forecast Period
Figure 29 Asia Pacific to Grow at the Highest CAGR in the Market for Military & Defense During the Forecast Period
Figure 30 Market for Sports & Fitness in Asia Pacific to Grow at the Highest CAGR During the Forecast Period
Figure 31 Active Smart Segment to Account for the Largest Share of the Market for Sports & Fitness During the Forecast Period
Figure 32 North America to Dominate the Market for Fashion & Entertainment During the Forecast Period
Figure 33 Asia Pacific to Register the Fastest Growth in the Market for Healthcare During the Forecast Period
Figure 34 Active Smart Segment to Lead the Market for Healthcare During the Forecast Period
Figure 35 North America to Dominate the Market for Mining During the Forecast Period
Figure 36 Market in Asia Pacific to Grow at the Highest CAGR During the Forecast Period
Figure 37 Market Size, By Region, 2019 vs 2024 (USD Million)
Figure 38 North America: Market Snapshot
Figure 39 The US to Register the Highest CAGR in North America for the Market During the Forecast Period
Figure 40 Europe: Smart Clothing Market Snapshot
Figure 41 Germany to Account for the Largest Share of the European Market During the Forecast Period
Figure 42 Asia Pacific: Smart Clothing Market Snapshot
Figure 43 China to Lead the Market in the Asia Pacific Market During the Forecast Period
Figure 44 South & Central America to Register A Higher CAGR in the Market During the Forecast Period
Figure 45 Companies Adopted Product Launches/Developments as Their Key Growth Strategies During 2017–2019
Figure 46 AIQ Smart Clothing (Taiwan) Dominated the Market in 2018
Figure 47 Competitive Leadership Mapping for the Global Market, 2018
Figure 48 Evaluation Framework: Smart Clothing Market
The study involved four major activities in estimating the current size of the smart clothing market. Exhaustive secondary research was done to collect information on the market, peer market, and parent market. The next step was to validate these findings, assumptions, and sizing with industry experts across the value chain through primary research. Both top-down and bottom-up approaches were employed to estimate the complete market size. After that, market breakdown and data triangulation methods were used to estimate the market size of segments and subsegments.
Secondary Research
The research methodology used to estimate and forecast the smart clothing market begins with capturing data on revenue of key vendors in the market through secondary research. This study incorporates the use of extensive secondary sources, directories, and databases, such as Hoovers, Bloomberg Businessweek, Factiva, and OneSource to identify and collect information useful for the technical, market-oriented, and commercial study of the smart clothing market. Vendor offerings have also been considered to determine the market segmentation. This entire research methodology includes the study of annual and financial reports of top players, presentations, press releases, journals, paid databases, trade directories, regulatory bodies, and safety standard organizations.
Primary Research
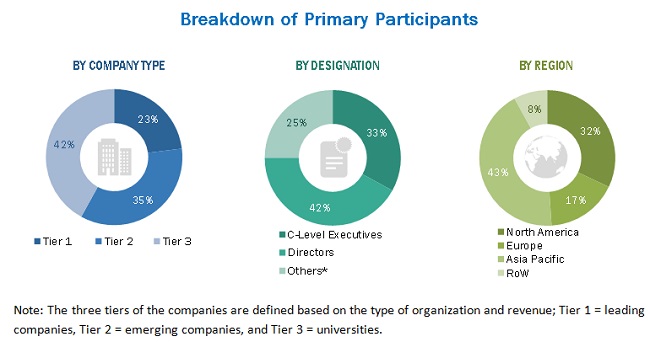
The smart clothing market comprises several stakeholders, such as suppliers of raw material and manufacturing equipment; standard components, original equipment manufacturers (OEMs); original device manufacturers (ODMs) of smart clothing; solutions providers; vendors of assembly, testing, and packaging solutions; and system integrators in the supply chain. Various primary sources from both the supply and demand sides of the market were interviewed to obtain qualitative and quantitative information. Following is the breakdown of primary respondents.
To know about the assumptions considered for the study, download the pdf brochure
Market Size Estimation
Both top-down and bottom-up approaches have been used to estimate and validate the total size of the smart clothing market. These methods have also been used extensively to estimate the size of various market subsegments. The research methodology used to estimate the market size includes the following:
- Key players in major end-user industry and markets were identified through extensive secondary research.
- The industry’s supply chain and market size, in terms of value, were determined through primary and secondary research processes.
- All percentage shares, splits, and breakdowns were determined using secondary sources and verified through primary sources.
Data Triangulation
After arriving at the overall market size—using the estimation processes as explained above—the market was split into several segments and subsegments. To complete the overall market engineering process and arrive at the exact statistics of each market segment and subsegment, data triangulation, and market breakdown procedures were employed, wherever applicable. The data have been triangulated by studying various factors and trends from both the demand and supply sides. The market has also been validated using both top-down and bottom-up approaches.
Research Objective
- To define, describe, and forecast the overall smart clothing market, in terms of value, segmented based on textile type, product type, end-user industry, and geography
- To forecast the market size for various segments with regard to 4 regions—North America, Europe, Asia Pacific (APAC), and Rest of the World (RoW)
- To provide detailed information regarding the major factors (drivers, restraints, opportunities, and challenges) influencing the growth of the smart clothing market
- To strategically analyze the micromarkets with respect to individual growth trends, prospects, and contribution to the overall smart clothing market
- To analyze opportunities in the smart clothing market for stakeholders by identifying the high-growth segments
- To strategically profile key players, comprehensively analyze their market rankings and core competencies, and detail the competitive landscape for market leaders
- To analyze competitive developments such as product launches and development; collaboration and partnerships; and R&D in the overall smart clothing market
Available Customizations
Along with the market data, MarketsandMarkets offers customizations according to a company’s specific needs. The following customization options are available for the report:
Company Information
- Detailed analysis and profiling of additional market players (up to 5)


Growth opportunities and latent adjacency in Smart Clothing Market