Sodium Hydroxide Market

Sodium Hydroxide Market by Grade (Solid, 50% Aqueous Solution), Production Process, Application (Biodiesel, Alumina, Inorganic Chemicals, Organic Chemicals, Food, Pulp & Paper, Soap & Detergent, Textiles, Water Treatment), & Region - Global Forecast to 2027

Report Code: CH 8173 Sep, 2022, by marketsandmarkets.com

Sodium Hydroxide Market

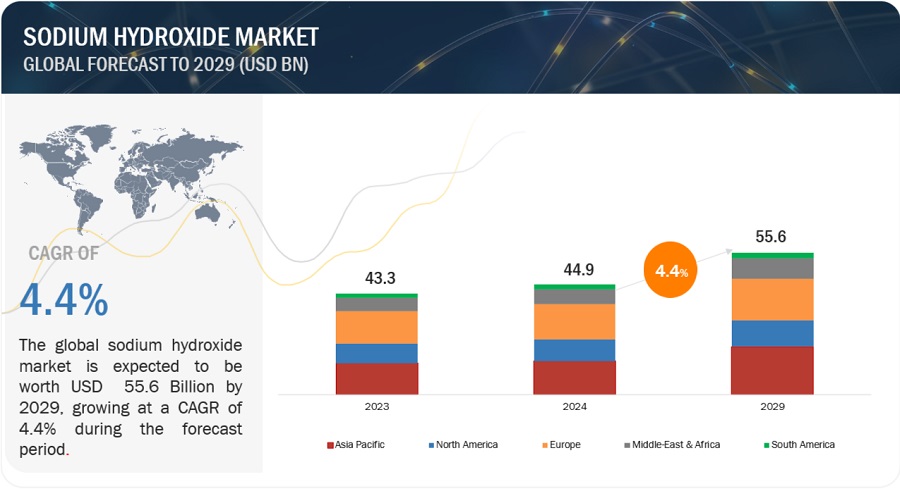
Sodium Hydroxide Market was valued at USD 49.3 billion in 2022 and is projected to reach USD 61.1 billion by 2027, growing at a cagr 4.4% from 2022 to 2027. The booming construction industry, including both residential and non residential infrastructure across the world, is one of the major factors boosting the demand for paints & coetings. The titanium dioxide market is driven by the paints & coatings application in the construction and automotive industries, which is likely to have a positive impact on the market.

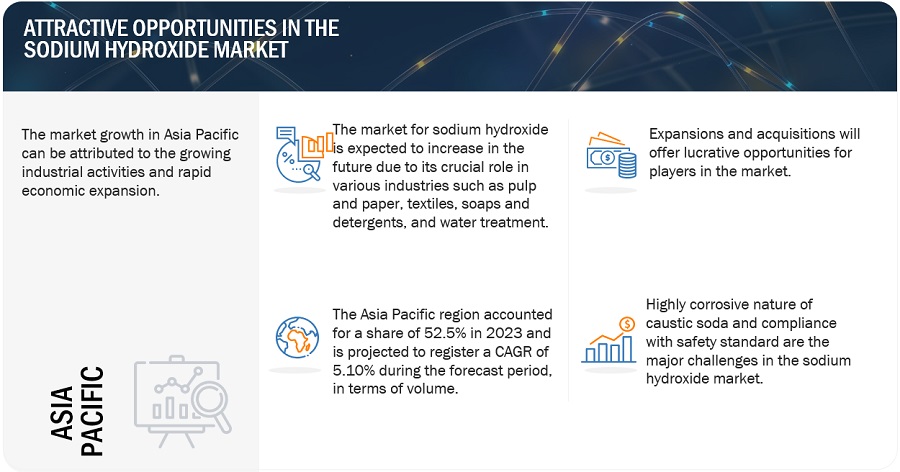
Attractive Opportunities in the Sodium Hydroxide Market
Sodium Hydroxide Market

To know about the assumptions considered for the study, Request for Free Sample Report
Sodium Hydroxide Market Dynamics

Driver:  Increasing demand for alumina in major end-use industries

Caustic soda is used to refine raw bauxite into white power alumina that is then smelted to make aluminum. According to the International Aluminium Institute, the global alumina production in March 2021 stood at 11.832 million tonnes, bringing the total output to 34.199 million tonnes in the first quarter of 2021. The production in March reflected a hike of 11.41% month-on-month from 10.620 million tonnes and 7.50% in the year from 11.006 million tonnes. Aluminum is refined from raw bauxite ore in an energy-intensive process that uses a substantial amount of caustic soda (NaOH) as the dissolving agent. Caustic soda is used because it is readily available and cost-effective. The major end-use industries of aluminum are building & construction, transportation,  and containers & packaging. In the building and construction industry, aluminum is used to make frames for doors and windows, staircases, heating systems, roofs, furniture, and others. It is also used in the construction of buildings, bridges, roads, and others.

Restraints: Environmental impact

Sodium hydroxide exposed in the atmosphere could be very dangerous since it readily reacts with other chemicals since it is subject to wet deposition'. It can readily react with water vapour in the air and produce aerosol or mist which are very corrosive. Concentrated aerosol compounds (silica, asbestos and etc) may result in a number of diseases such as silicosis and black lung when exposed to it since it can severely irritate upper respiratory tracts.

Sodium hydroxide is a very strong base due to the hydroxide anion in its compound. This is considered to be a contaminant if it were to disposed within water. Sodium hydroxide's primary effect would cause the water's pH level to raise. If the ocean became too basic it will produce carbonic acid, which will release even more hydrogen ions and making the ocean even more acidic. The increase of the acidity level of the ocean will cause marine life (such as clams, mussels and etc) to produce weaker shells and will not survive. Coral will also be affected since their skeletons are made of calcium carbonate. Since coral produces food and oxyan to the sea creatures, they are vital is our environment. If you all the coral were to die from lack of survivability, then the fish in our ocean will suffer and most likely die.

Opportunity: Industrialization in emerging economies

Increasing demand from the packaging, building & construction, consumer goods, and automotive industries in these countries increases the need for plastics, aluminum, and others used for various applications in these industries. The emerging economies such as China, India, South Korea, Indonesia, Thailand, Taiwan, Mexico, Brazil, and Argentina with the growth in industrialization are expected to drive the sodium hydroxide market during the next five years.

The global chemicals market has been growing at a fairly strong rate recently. In the forecast period, similarly strong growth is expected. According to an in-house research, the global chemicals market was valued is expected to reach a value of USD 5,334.5 million in 2022. The Commodity chemicals category accounted for 50.5% to the total chemical sales followed by specialty chemicals (19.7%), agricultural chemicals (8.4%) and other (21.5% ) . As company manufactures and sells various chemicals and has its customers worldwide, favorable trends in the global chemicals market provide it with growth opportunities for sodium hydroxide market

Chemical industries in the US and Europe are mature, and their growth is largely influenced by GDP growth. Rapid industrialization, supported by strong demand due to the improving standards of living, significant population base, and available pools of workforces in the Asia Pacific, the Middle East & Africa, and South America, has led companies to establish their facilities in these regions and cater to the regional demand.

Challenges: Highly corrosive nature of caustic soda and compliance with safety standards

Solid sodium is highly corrosive. It reacts with greases and fats which can lead to irreversible damage to any contact point with the body (for example skin or eyes). Depending on the concentration, solutions of sodium hydroxide in water are corrosive, irritating or non irritating and they cause direct local effects at the contact point with the body. Sodium hydroxide is highly corrosive. NaOH can react with moisture from the air and may generate heat as it dissolves. This heat can be enough to cause a fire if it is near flammable materials.

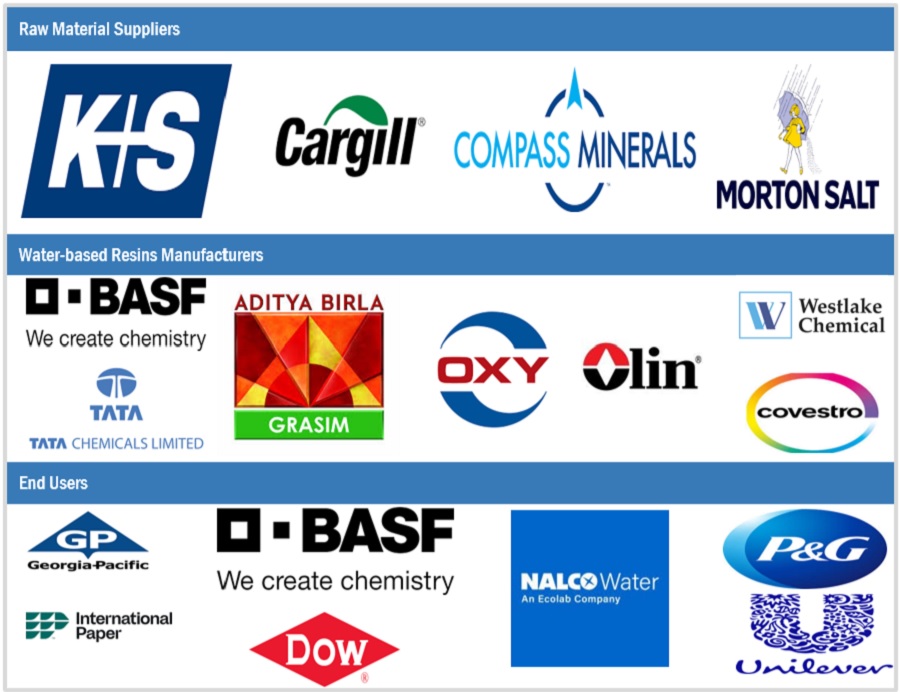
Sodium Hydroxide Market Ecosystem

Sodium Hydroxide Market Ecosystem

50% W/W Solution is the fastest growing segment by grade in the Sodium Hydroxide market.

Based on grade, 50% W/W Solution is estimated to be the largest and fastest growing segment of Sodium Hydroxide during the forecast period. Sodium hydroxide 50% w/w aqueous solution is used as a chemical reactant or neutralization agent in various industries such as chemical, pharmaceutical, textile, pulp & paper, metal, and food industries and in soap & detergent manufacturing. It is also used in the manufacture of synthetic fabrics such as rayon and also for manufacturing food products. It is utilized for pH adjustment and for the formation of in situ sodium methylate in bioethanol and biodiesel processing.

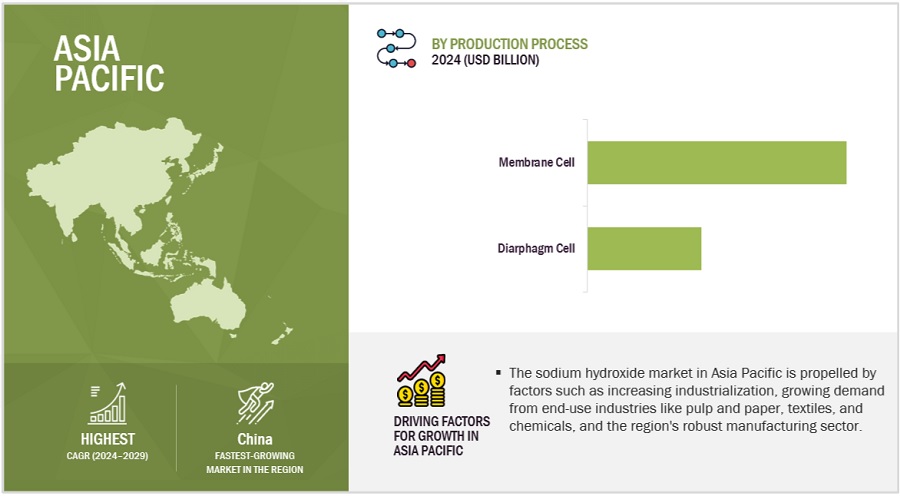
Membrane cell is the fastest growing segment by production process in the Sodium Hydroxide market.

Membrane cell is estimated to be the largest segment in the Sodium Hydroxide market during the forecast period. The sodium hydroxide produced by the membrane cell process is most typically brought up as membrane grade. It conjointly contains a growing acceptance as a rayon grade product in all areas outside of rayon fiber production. The membrane cell process has a relatively lower environmental impact compared to the diaphragm and mercury cell processes. Companies are shifting toward the use of membrane cell technology due to safe raw materials, low electricity consumption, and the production of high-quality caustic soda.

Asia Pacific is estimated to be the largest market for Sodium Hydroxide

Asia Pacific is the largest and fastest growing market for Sodium Hydroxide, followed by North America and Europe. In Asia Pacific, China, India, and Southeast Asia are expected to witness high growth during the forecast period. The growth of the market in the region is led by rapid industrialization, rising demand from various applications, and increasing government spending. Different companies are focusing on these emerging markets and increasing their footprints by setting up manufacturing facilities, distribution centers, and research & development centers

Global Sodium Hydroxide manufacturers are Tata Chemicals Limited (India), Olin Corporation (US), Westlake Corporation (US), Occidental Petroleum Corporation (US), Dow (US), Solvay S.A (Belgium), BASF SE (Germany), Xinjiang Zhongtai Chemical Co. Ltd (China), Akzo Nobel N.V (Netherlands), Brenntag North America, Inc (US), and others.

Sodium Hydroxide Market by Region

To know about the assumptions considered for the study, download the pdf brochure

Sodium Hydroxide Market Players

The leading players in the Sodium Hydroxide market are Tata Chemicals Limited (India), Olin Corporation (US), Westlake Corporation (US), Occidental Petroleum Corporation (US), Dow (US), Solvay S.A (Belgium), BASF SE (Germany), Xinjiang Zhongtai Chemical Co. Ltd (China), Akzo Nobel N.V (Netherlands), Brenntag North America, Inc (US), and others.

These companies have adopted various organic as well as inorganic growth strategies between 2018 and 2022 to strengthen their position in the market. New product development, joint venture, acquisition, and expansion were among the key growth strategies adopted by these leading players to enhance their product offering and regional presence and meet the growing demand for Sodium Hydroxide in the emerging economies.

Sodium Hydroxide Market Report Scope

Report Metric

Details

Market Size Value in 2022

USD 49.3 Billion

Revenue Forecast in 2027

USD 61.1 Billion

CAGR

4.4%

Years Considered

2020-2027

Base year

2021

Forecast period

2022-2027

Unit considered 

Value (USD Billion), Volume (Kilo Tons)

Segments

Application, Grade, Production Process and Region

Regions

North America, Europe, Asia-Pacific, Middle East & Africa and South America

Companies

The major players are Tata Chemicals Limited (India), Olin Corporation (US), Westlake Corporation (US), Occidental Petroleum Corporation (US), Dow (US), Solvay S.A (Belgium), BASF SE (Germany), Xinjiang Zhongtai Chemical Co. Ltd (China), Akzo Nobel N.V (Netherlands), Brenntag North America, Inc (US), and others.

This research report categorizes the global Sodium Hydroxide market on the basis of Application, Grade, Production Process and Region.

By Grade:

  • Solid
  • 50% Aqueous Solution
  • Others

By Production Process:

By Application:

  • Biodiesel
  • Alumina
  • Inorganic Chemicals
  • Organic Chemicals
  • Food
  • Pulp & Paper
  • Soap & Detergent
  • Textiles
  • Water Treatment
  • Others

By Region:

  • North America
  • Europe
  • Asia Pacific (APAC)
  • South America
  • Middle East & Africa (MEA)

The market has been further analyzed for the key countries in each of these regions.

Key Questions Addressed by the Report

  • What was the market size of Sodium Hydroxide and the estimated share of each region in 2021, in terms of volume and value?
  • What will be the CAGR of the Sodium Hydroxide market in all the key regions during the forecast period?
  • What are the new revenue streams for the Sodium Hydroxide market?
  • What is the estimated demand for Sodium Hydroxide in various applications?
  • Who are the major players in the market region wise?
  • What is the impact of the COVID-19 pandemic on the Sodium Hydroxide market?

Frequently Asked Questions (FAQ):

To speak to our analyst for a discussion on the above findings, click Speak to Analyst


TABLE OF CONTENTS

1 INTRODUCTION (Page No. - 20)
    1.1 STUDY OBJECTIVES
    1.2 MARKET DEFINITION
    1.3 MARKET SCOPE
           1.3.1 REGIONS COVERED
           1.3.2 YEARS CONSIDERED
    1.4 CURRENCY CONSIDERED
    1.5 UNIT CONSIDERED
    1.6 STAKEHOLDERS

2 RESEARCH METHODOLOGY (Page No. - 23)
    2.1 RESEARCH DATA
           2.1.1 SECONDARY DATA
                    2.1.1.1 Key data from secondary sources
           2.1.2 PRIMARY DATA
                    2.1.2.1 Key data from primary sources
    2.2 MARKET SIZE ESTIMATION
    2.3 DATA TRIANGULATION
    2.4 RESEARCH ASSUMPTIONS
    2.5 LIMITATIONS
    2.6 GROWTH RATE ASSUMPTIONS/GROWTH FORECAST

3 EXECUTIVE SUMMARY (Page No. - 31)

4 PREMIUM INSIGHTS (Page No. - 34)
    4.1 SIGNIFICANT OPPORTUNITIES IN SODIUM HYDROXIDE MARKET
    4.2 SODIUM HYDROXIDE MARKET, BY GRADE AND COUNTRY, 2021
    4.3 SODIUM HYDROXIDE MARKET, BY APPLICATION
    4.4 SODIUM HYDROXIDE MARKET, BY PRODUCTION PROCESS  AND REGION
    4.5 SODIUM HYDROXIDE MARKET, BY KEY COUNTRIES

5 MARKET OVERVIEW (Page No. - 37)
    5.1 INTRODUCTION
    5.2 MARKET DYNAMICS
           5.2.1 DRIVERS
                    5.2.1.1 Increasing demand for alumina in major end-use industries
                    5.2.1.2 Steady growth of chemicals industry
           5.2.2 RESTRAINTS
                    5.2.2.1 Environmental impact
           5.2.3 OPPORTUNITIES
                    5.2.3.1 Industrialization in emerging economies
           5.2.4 CHALLENGES
                    5.2.4.1 Highly corrosive nature of caustic soda and compliance with safety standards

6 INDUSTRY TRENDS (Page No. - 41)
    6.1 PORTER’S FIVE FORCES ANALYSIS
           6.1.1 BARGAINING POWER OF SUPPLIERS
           6.1.2 BARGAINING POWER OF BUYERS
           6.1.3 INTENSITY OF COMPETITIVE RIVALRY
           6.1.4 THREAT OF NEW ENTRANTS
           6.1.5 THREAT OF SUBSTITUTES
    6.2 ECOSYSTEM
    6.3 TRADE ANALYSIS
    6.4 TECHNOLOGY ANALYSIS
           6.4.1 MERCURY CELL
           6.4.2 DIAPHRAGM CELL
           6.4.3 MEMBRANE CELL
    6.5 REGULATORY LANDSCAPE
           6.5.1 REGULATORY BODIES, GOVERNMENT AGENCIES, AND OTHER ORGANIZATIONS
    6.6 PATENT ANALYSIS
           6.6.1 INTRODUCTION
           6.6.2 METHODOLOGY
           6.6.3 DOCUMENT TYPE
    6.7 VALUE CHAIN ANALYSIS
    6.8 CASE STUDY
           6.8.1 EFFICIENT RECOVERY AND REUSE OF CAUSTIC SODA FROM MERCERIZING WASH WATER
    6.9 TRENDS & DISRUPTIONS IMPACTING CUSTOMERS
           6.9.1 REVENUE SHIFT & NEW REVENUE POCKETS FOR INORGANIC CHEMICALS
    6.1 KEY CONFERENCES & EVENTS IN 2022–2023
    6.11 AVERAGE SELLING PRICE ANALYSIS

7 SODIUM HYDROXIDE MARKET, BY GRADE (Page No. - 55)
    7.1 INTRODUCTION
    7.2 SOLID
           7.2.1 WIDELY USED FOR TEXTILE PROCESSING
    7.3 50% W/W SOLUTION
           7.3.1 HIGH DEMAND FROM NUMEROUS END-USE INDUSTRIES
    7.4 OTHERS

8 SODIUM HYDROXIDE MARKET, BY PRODUCTION PROCESS (Page No. - 59)
    8.1 INTRODUCTION
    8.2 DIAPHRAGM CELL
           8.2.1 COST-EFFICIENT PROCESS
    8.3 MEMBRANE CELL
           8.3.1 PRODUCTION OF HIGH-QUALITY SODIUM HYDROXIDE
    8.4 OTHERS

9 SODIUM HYDROXIDE MARKET, BY APPLICATION (Page No. - 63)
    9.1 INTRODUCTION
    9.2 ALUMINA
           9.2.1 INCREASED USE OF ALUMINA IN AUTOMOTIVE INDUSTRY
    9.3 INORGANIC CHEMICAL
           9.3.1 GROWING CONSTRUCTION AND DETERGENT INDUSTRIES
    9.4 ORGANIC CHEMICAL
           9.4.1 KEY RAW MATERIAL FOR COMMERCIAL PRODUCTION OF VARIOUS ORGANIC CHEMICALS
    9.5 FOOD
           9.5.1 CHANGING FOOD PREFERENCES FROM UN-PROCESSED TO PROCESSED FOODS
    9.6 PULP & PAPER
           9.6.1 INCREASED DEMAND FOR PULP & PAPER IN PACKAGING SECTOR
    9.7 SOAP & DETERGENT
           9.7.1 DEMAND FROM INSTITUTIONAL & INDUSTRIAL CLEANING APPLICATION
    9.8 TEXTILE
           9.8.1 GROWTH OF TEXTILE INDUSTRY IN ASIA PACIFIC
    9.9 WATER TREATMENT
           9.9.1 RISING CONCERN FOR WATER FILTRATION
    9.10 BIODIESEL
           9.10.1 INCREASING DEMAND FOR CLEAN ENERGY
    9.11 OTHERS

10 SODIUM HYDROXIDE MARKET, BY REGION (Page No. - 72)
     10.1 INTRODUCTION
     10.2 ASIA PACIFIC
             10.2.1 CHINA
                        10.2.1.1 High demand for sodium hydroxide in alumina, pulp & paper, and textile applications
             10.2.2 JAPAN
                        10.2.2.1 Pulp & paper and water treatment sectors to augment market growth
             10.2.3 INDIA
                        10.2.3.1 Increasing FDI in manufacturing sector to support market growth
             10.2.4 INDONESIA
                        10.2.4.1 Growth in food & beverage industry to propel market
             10.2.5 REST OF ASIA PACIFIC
     10.3 EUROPE
             10.3.1 GERMANY
                        10.3.1.1 Favorable economic environment for construction and chemical sectors
             10.3.2 FRANCE
                        10.3.2.1 Growth in plastic industry to fuel demand for caustic soda
             10.3.3 ITALY
                        10.3.3.1 Growth in end-use industries
             10.3.4 UK
                        10.3.4.1 Steady increase in construction and chemical sectors
             10.3.5 SPAIN
                        10.3.5.1 Increased export base, urbanization, and high disposable income
             10.3.6 REST OF EUROPE
     10.4 NORTH AMERICA
             10.4.1 US
                        10.4.1.1 Steady growth in demand from several industrial applications
             10.4.2 CANADA
                        10.4.2.1 Uncertain end-use industry growth
             10.4.3 MEXICO
                        10.4.3.1 High demand from end-use industries
     10.5 MIDDLE EAST & AFRICA
             10.5.1 SAUDI ARABIA
                        10.5.1.1 Increased investment in biofuel to support growth
             10.5.2 IRAN
                        10.5.2.1 Growing demand from food processing, biofuels, and textiles to drive market
             10.5.3 REST OF MIDDLE EAST & AFRICA
     10.6 SOUTH AMERICA
             10.6.1 BRAZIL
                        10.6.1.1 Paper & packaging and construction industries
             10.6.2 ARGENTINA
                        10.6.2.1 Recovery of manufacturing sector
             10.6.3 REST OF SOUTH AMERICA

11 COMPETITIVE LANDSCAPE (Page No. - 142)
     11.1 OVERVIEW
     11.2 MARKET SHARE ANALYSIS
     11.3 REVENUE ANALYSIS OF TOP MARKET PLAYERS
     11.4 COMPANY EVALUATION QUADRANT
             11.4.1 STARS
             11.4.2 EMERGING LEADERS
             11.4.3 PERVASIVE PLAYERS
     11.5 SMALL & MEDIUM ENTERPRISES (SMES) AND STARTUPS  MATRIX, 2021
             11.5.1 PROGRESSIVE COMPANIES
             11.5.2 RESPONSIVE COMPANIES
             11.5.3 DYNAMIC COMPANIES
             11.5.4 STARTING BLOCKS
     11.6 COMPETITIVE SCENARIO
             11.6.1 DEALS

12 COMPANY PROFILES (Page No. - 149)
     12.1 KEY PLAYERS
             12.1.1 TATA CHEMICALS LIMITED
                        12.1.1.1 Business overview
                        12.1.1.2 Products offered
                        12.1.1.3 Recent developments
                        12.1.1.4 MnM view
                                     12.1.1.4.1 Key strengths/Right to win
                                     12.1.1.4.2 Weaknesses and competitive threats
             12.1.2 OLIN CORPORATION
                        12.1.2.1 Business overview
                        12.1.2.2 Products offered
                        12.1.2.3 MnM view
                                     12.1.2.3.1 Key strengths/Right to win
                                     12.1.2.3.2 Strategic choices
                                     12.1.2.3.3 Weaknesses and competitive threats
             12.1.3 WESTLAKE CORPORATION
                        12.1.3.1 Business overview
                        12.1.3.2 Products offered
                                     12.1.3.2.1 Deals
                        12.1.3.3 MnM view
                                     12.1.3.3.1 Key strengths/Right to win
                                     12.1.3.3.2 Strategic choices
                                     12.1.3.3.3 Weakness and competitive threats
             12.1.4 OCCIDENTAL PETROLEUM CORPORATION
                        12.1.4.1 Business overview
                        12.1.4.2 Products offered
                        12.1.4.3 MnM view
                                     12.1.4.3.1 Key strengths/right to win
                                     12.1.4.3.2 Strategic choices
                                     12.1.4.3.3 Weaknesses and competitive threats
             12.1.5 DOW
                        12.1.5.1 Business overview
                        12.1.5.2 Products offered
                        12.1.5.3 MnM view
                                     12.1.5.3.1 Key strengths/Right to win
                                     12.1.5.3.2 Strategic choices
                                     12.1.5.3.3 Weaknesses and competitive threats
             12.1.6 SOLVAY S.A
                        12.1.6.1 Business overview
                        12.1.6.2 Products offered
                        12.1.6.3 MnM view
                                     12.1.6.3.1 Key strengths/Right to win
                                     12.1.6.3.2 Strategic choices
                                     12.1.6.3.3 Weakness and competitive threats
             12.1.7 BASF SE
                        12.1.7.1 Business overview
                        12.1.7.2 Products offered
                        12.1.7.3 MnM view
             12.1.8 XINJIANG ZHONGTAI CHEMICAL CO. LTD.
                        12.1.8.1 Business overview
                        12.1.8.2 Products offered
                        12.1.8.3 MnM view
             12.1.9 AKZO NOBEL N.V.
                        12.1.9.1 Business overview
                        12.1.9.2 Products offered
                        12.1.9.3 MnM view
             12.1.10 BRENNTAG NORTH AMERICA, INC.
                        12.1.10.1 Business overview
                        12.1.10.2 Products offered
                        12.1.10.3 MnM view
     12.2 OTHER PLAYERS
             12.2.1 PPG INDUSTRIES, INC.
             12.2.2 INEOS GROUP AG
             12.2.3 FORMOSA PLASTICS CORPORATION
             12.2.4 FMC CORPORATION
             12.2.5 VYNOVA
             12.2.6 NIRMA LIMITED
             12.2.7 COVESTRO AG
             12.2.8 HANWHA CORPORATION
             12.2.9 SHIN-ETSU CHEMICAL CO., LTD.
             12.2.10 VATS INTERNATIONAL
             12.2.11 SODA – ARABIAN ALKALI COMPANY
             12.2.12 HAWKINS INC.
             12.2.13 DIVERSEY HOLDINGS LTD.
             12.2.14 TECO CHEMICALS AS

13 APPENDIX (Page No. - 177)
     13.1 DISCUSSION GUIDE
     13.2 KNOWLEDGE STORE: MARKETSANDMARKETS  SUBSCRIPTION PORTAL
     13.3 CUSTOMIZATION OPTIONS
     13.4 RELATED REPORTS
     13.5 AUTHOR DETAILS


LIST OF TABLES (194 TABLES)

TABLE 1 APPLICATIONS OF CAUSTIC SODA PRODUCTS IN VARIOUS INDUSTRIES
TABLE 2 SODIUM HYDROXIDE MARKET: PORTER’S FIVE FORCES ANALYSIS
TABLE 3 SODIUM HYDROXIDE (SOLID) IMPORT DATA, 2020 (USD THOUSAND)
TABLE 4 SODIUM HYDROXIDE (SOLID) EXPORT DATA, 2020 (USD THOUSAND)
TABLE 5 SODIUM HYDROXIDE (AQUEOUS SOLUTION) EXPORT DATA, 2020 (USD THOUSAND)
TABLE 6 SODIUM HYDROXIDE (AQUEOUS SOLUTION) IMPORT DATA, 2020 (USD THOUSAND)
TABLE 7 LIST OF PATENTS
TABLE 8 SODIUM HYDROXIDE MARKET: DETAILED LIST OF CONFERENCES & EVENTS
TABLE 9 SODIUM HYDROXIDE MARKET SIZE, BY GRADE, 2020–2027 (USD MILLION)
TABLE 10 SODIUM HYDROXIDE MARKET SIZE, BY GRADE, 2020–2027 (KILOTON)
TABLE 11 SODIUM HYDROXIDE MARKET SIZE, BY PRODUCTION PROCESS,  2020–2027 (USD MILLION)
TABLE 12 SODIUM HYDROXIDE MARKET SIZE, BY PRODUCTION PROCESS, 2020–2027 (KILOTON)
TABLE 13 SODIUM HYDROXIDE MARKET SIZE, BY APPLICATION, 2020–2027 (USD MILLION)
TABLE 14 SODIUM HYDROXIDE MARKET SIZE, BY APPLICATION, 2020–2027 (KILOTON)
TABLE 15 SODIUM HYDROXIDE MARKET SIZE, BY REGION, 2020–2027 (USD MILLION)
TABLE 16 SODIUM HYDROXIDE MARKET SIZE, BY REGION, 2020–2027 (KILOTON)
TABLE 17 ASIA PACIFIC: SODIUM HYDROXIDE MARKET SIZE, BY COUNTRY,  2020–2027 (USD MILLION)
TABLE 18 ASIA PACIFIC: MARKET SIZE, BY COUNTRY, 2020–2027 (KILOTON)
TABLE 19 ASIA PACIFIC: HISTORIC SODIUM HYDROXIDE MARKET SIZE, BY GRADE  2016–2019 (USD MILLION)
TABLE 20 ASIA PACIFIC: HISTORIC MARKET SIZE, BY GRADE,  2016–2019 (KILOTON)
TABLE 21 ASIA PACIFIC: MARKET SIZE, BY GRADE,  2020–2027 (USD MILLION)
TABLE 22 ASIA PACIFIC: MARKET SIZE, BY GRADE, 2020–2027 (KILOTON)
TABLE 23 ASIA PACIFIC: HISTORIC SODIUM HYDROXIDE MARKET SIZE, BY PRODUCTION PROCESS, 2016–2019 (USD MILLION)
TABLE 24 ASIA PACIFIC: HISTORIC MARKET SIZE, BY PRODUCTION PROCESS, 2016–2019 (KILOTON)
TABLE 25 ASIA PACIFIC: MARKET SIZE, BY PRODUCTION PROCESS,  2020–2027 (USD MILLION)
TABLE 26 ASIA PACIFIC: MARKET SIZE, BY PRODUCTION PROCESS,  2020–2027 (KILOTON)
TABLE 27 ASIA PACIFIC: HISTORIC SODIUM HYDROXIDE MARKET SIZE, BY APPLICATION,  2016–2019 (USD MILLION)
TABLE 28 ASIA PACIFIC: HISTORIC MARKET SIZE, BY APPLICATION,  2016–2019 (KILOTON)
TABLE 29 ASIA PACIFIC: MARKET SIZE, BY APPLICATION,  2020–2027 (USD MILLION)
TABLE 30 ASIA PACIFIC: MARKET SIZE, BY APPLICATION,  2020–2027 (KILOTON)
TABLE 31 CHINA: SODIUM HYDROXIDE MARKET SIZE, BY GRADE, 2020–2027 (USD MILLION)
TABLE 32 CHINA: MARKET SIZE, BY GRADE, 2020–2027 (KILOTON)
TABLE 33 CHINA: MARKET SIZE, BY APPLICATION, 2020–2027 (USD MILLION)
TABLE 34 CHINA: MARKET SIZE, BY APPLICATION, 2020–2027 (KILOTON)
TABLE 35 JAPAN: SODIUM HYDROXIDE MARKET SIZE, BY GRADE, 2020–2027 (USD MILLION)
TABLE 36 JAPAN: MARKET SIZE, BY GRADE, 2020–2027 (KILOTON)
TABLE 37 JAPAN: MARKET SIZE, BY APPLICATION, 2020–2027 (USD MILLION)
TABLE 38 JAPAN: MARKET SIZE, BY APPLICATION, 2020–2027 (KILOTON)
TABLE 39 INDIA: SODIUM HYDROXIDE MARKET SIZE, BY GRADE, 2020–2027 (USD MILLION)
TABLE 40 INDIA: MARKET SIZE, BY GRADE, 2020–2027 (KILOTON)
TABLE 41 INDIA: MARKET SIZE, BY APPLICATION, 2020–2027 (USD MILLION)
TABLE 42 INDIA: MARKET SIZE, BY APPLICATION, 2020–2027 (KILOTON)
TABLE 43 INDONESIA: SODIUM HYDROXIDE MARKET SIZE, BY GRADE, 2020–2027 (USD MILLION)
TABLE 44 INDONESIA: MARKET SIZE, BY GRADE, 2020–2027 (KILOTON)
TABLE 45 INDONESIA: MARKET SIZE, BY APPLICATION,  2020–2027 (USD MILLION)
TABLE 46 INDONESIA: MARKET SIZE, BY APPLICATION, 2020–2027 (KILOTON)
TABLE 47 REST OF ASIA PACIFIC: SODIUM HYDROXIDE MARKET SIZE, BY GRADE,  2020–2027 (USD MILLION)
TABLE 48 REST OF ASIA PACIFIC: MARKET SIZE, BY GRADE,  2020–2027 (KILOTON)
TABLE 49 REST OF ASIA PACIFIC: MARKET SIZE, BY APPLICATION,  2020–2027 (USD MILLION)
TABLE 50 REST OF ASIA PACIFIC: MARKET SIZE, BY APPLICATION,  2020–2027 (KILOTON)
TABLE 51 EUROPE: SODIUM HYDROXIDE MARKET SIZE, BY COUNTRY, 2020–2027 (USD MILLION)
TABLE 52 EUROPE: MARKET SIZE, BY COUNTRY, 2020–2027 (KILOTON)
TABLE 53 EUROPE: MARKET SIZE, BY GRADE, 2016–2019 (USD MILLION)
TABLE 54 EUROPE: MARKET SIZE, BY GRADE, 2016–2019 (KILOTON)
TABLE 55 EUROPE: MARKET SIZE, BY GRADE, 2020–2027 (USD MILLION)
TABLE 56 EUROPE: MARKET SIZE, BY GRADE, 2020–2027 (KILOTON)
TABLE 57 EUROPE: MARKET SIZE, BY PRODUCTION PROCESS,  2016–2019 (USD MILLION)
TABLE 58 EUROPE: MARKET SIZE, BY PRODUCTION PROCESS,  2016–2019 (KILOTON)
TABLE 59 EUROPE: MARKET SIZE, BY PRODUCTION PROCESS,  2020–2027 (USD MILLION)
TABLE 60 EUROPE: MARKET SIZE, BY PRODUCTION PROCESS,  2020–2027 (KILOTON)
TABLE 61 EUROPE: MARKET SIZE, BY APPLICATION,  2016–2019 (USD MILLION)
TABLE 62 EUROPE: MARKET SIZE, BY APPLICATION, 2016–2019 (KILOTON)
TABLE 63 EUROPE: MARKET SIZE, BY APPLICATION,  2020–2027 (USD MILLION)
TABLE 64 EUROPE: MARKET SIZE, BY APPLICATION, 2020–2027 (KILOTON)
TABLE 65 GERMANY: SODIUM HYDROXIDE MARKET SIZE, BY GRADE, 2020–2027 (USD MILLION)
TABLE 66 GERMANY: MARKET SIZE, BY GRADE, 2020–2027 (KILOTON)
TABLE 67 GERMANY: MARKET SIZE, BY APPLICATION,  2020–2027 (USD MILLION)
TABLE 68 GERMANY: MARKET SIZE, BY APPLICATION, 2020–2027 (KILOTON)
TABLE 69 FRANCE: SODIUM HYDROXIDE MARKET SIZE, BY GRADE, 2020–2027 (USD MILLION)
TABLE 70 FRANCE: MARKET SIZE, BY GRADE, 2020–2027 (KILOTON)
TABLE 71 FRANCE: MARKET SIZE, BY APPLICATION,  2020–2027 (USD MILLION)
TABLE 72 FRANCE: MARKET SIZE, BY APPLICATION, 2020–2027 (KILOTON)
TABLE 73 ITALY: SODIUM HYDROXIDE MARKET SIZE, BY GRADE, 2020–2027 (USD MILLION)
TABLE 74 ITALY: MARKET SIZE, BY GRADE, 2020–2027 (KILOTON)
TABLE 75 ITALY: MARKET SIZE, BY APPLICATION, 2020–2027 (USD MILLION)
TABLE 76 ITALY: MARKET SIZE, BY APPLICATION, 2020–2027 (KILOTON)
TABLE 77 UK: SODIUM HYDROXIDE MARKET SIZE, BY GRADE, 2020–2027 (USD MILLION)
TABLE 78 UK: MARKET SIZE, BY GRADE, 2020–2027 (KILOTON)
TABLE 79 UK: MARKET SIZE, BY APPLICATION, 2020–2027 (USD MILLION)
TABLE 80 UK: MARKET SIZE, BY APPLICATION, 2020–2027 (KILOTON)
TABLE 81 SPAIN: SODIUM HYDROXIDE MARKET SIZE, BY GRADE, 2020–2027 (USD MILLION)
TABLE 82 SPAIN: MARKET SIZE, BY GRADE, 2020–2027 (KILOTON)
TABLE 83 SPAIN: MARKET SIZE, BY APPLICATION, 2020–2027 (USD MILLION)
TABLE 84 SPAIN: MARKET SIZE, BY APPLICATION, 2020–2027 (KILOTON)
TABLE 85 REST OF EUROPE: SODIUM HYDROXIDE MARKET SIZE, BY GRADE,  2020–2027 (USD MILLION)
TABLE 86 REST OF EUROPE: MARKET SIZE, BY GRADE, 2020–2027 (KILOTON)
TABLE 87 REST OF EUROPE: MARKET SIZE, BY APPLICATION,  2020–2027 (USD MILLION)
TABLE 88 REST OF EUROPE: MARKET SIZE, BY APPLICATION,  2020–2027 (KILOTON)
TABLE 89 NORTH AMERICA: SODIUM HYDROXIDE MARKET SIZE, BY COUNTRY,  2020–2027 (USD MILLION)
TABLE 90 NORTH AMERICA: MARKET SIZE, BY COUNTRY,  2020–2027 (KILOTON)
TABLE 91 NORTH AMERICA: MARKET SIZE, BY GRADE,  2016–2019 (USD MILLION)
TABLE 92 NORTH AMERICA: MARKET SIZE, BY GRADE, 2016–2019 (KILOTON)
TABLE 93 NORTH AMERICA: MARKET SIZE, BY GRADE,  2020–2027 (USD MILLION)
TABLE 94 NORTH AMERICA: MARKET SIZE, BY GRADE, 2020–2027 (KILOTON)
TABLE 95 NORTH AMERICA: MARKET SIZE, BY PRODUCTION PROCESS,  2016–2019 (USD MILLION)
TABLE 96 NORTH AMERICA: MARKET SIZE, BY PRODUCTION PROCESS,  2016–2019 (KILOTON)
TABLE 97 NORTH AMERICA: MARKET SIZE, BY PRODUCTION PROCESS, 2020–2027 (USD MILLION)
TABLE 98 NORTH AMERICA: MARKET SIZE, BY PRODUCTION PROCESS,  2020–2027 (KILOTON)
TABLE 99 NORTH AMERICA: MARKET SIZE, BY APPLICATION,  2016–2019 (USD MILLION)
TABLE 100 NORTH AMERICA: SODIUM HYDROXIDE MARKET SIZE, BY APPLICATION,  2016–2019 (KILOTON)
TABLE 101 NORTH AMERICA: MARKET SIZE, BY APPLICATION,  2020–2027 (USD MILLION)
TABLE 102 NORTH AMERICA: MARKET SIZE, BY APPLICATION,  2020–2027 (KILOTON)
TABLE 103 US: SODIUM HYDROXIDE MARKET SIZE, BY GRADE, 2020–2027 (USD MILLION)
TABLE 104 US: MARKET SIZE, BY GRADE, 2020–2027 (KILOTON)
TABLE 105 US: MARKET SIZE, BY APPLICATION, 2020–2027 (USD MILLION)
TABLE 106 US: MARKET SIZE, BY APPLICATION, 2020–2027 (KILOTON)
TABLE 107 CANADA: SODIUM HYDROXIDE MARKET SIZE, BY GRADE, 2020–2027 (USD MILLION)
TABLE 108 CANADA: MARKET SIZE, BY GRADE, 2020–2027 (KILOTON)
TABLE 109 CANADA: MARKET SIZE, BY APPLICATION,  2020–2027 (USD MILLION)
TABLE 110 CANADA: MARKET SIZE, BY APPLICATION, 2020–2027 (KILOTON)
TABLE 111 MEXICO: SODIUM HYDROXIDE MARKET SIZE, BY GRADE, 2020–2027 (USD MILLION)
TABLE 112 MEXICO: MARKET SIZE, BY GRADE, 2020–2027 (KILOTON)
TABLE 113 MEXICO: MARKET SIZE, BY APPLICATION,  2020–2027 (USD MILLION)
TABLE 114 MEXICO: MARKET SIZE, BY APPLICATION, 2020–2027 (KILOTON)
TABLE 115 MIDDLE EAST & AFRICA: SODIUM HYDROXIDE MARKET SIZE, BY COUNTRY,  2020–2027 (USD MILLION)
TABLE 116 MIDDLE EAST & AFRICA: MARKET SIZE, BY COUNTRY,  2020–2027 (KILOTON)
TABLE 117 MIDDLE EAST & AFRICA: HISTORIC SODIUM HYDROXIDE MARKET SIZE, BY GRADE,  2016–2019 (USD MILLION)
TABLE 118 MIDDLE EAST & AFRICA: HISTORIC MARKET SIZE, BY GRADE,  2016–2019 (KILOTON)
TABLE 119 MIDDLE EAST & AFRICA: MARKET SIZE, BY GRADE,  2020–2027 (USD MILLION)
TABLE 120 MIDDLE EAST & AFRICA: MARKET SIZE, BY GRADE,  2020–2027 (KILOTON)
TABLE 121 MIDDLE EAST & AFRICA: HISTORIC SODIUM HYDROXIDE MARKET SIZE, BY PRODUCTION PROCESS, 2016–2019 (USD MILLION)
TABLE 122 MIDDLE EAST & AFRICA: HISTORIC MARKET SIZE, BY PRODUCTION PROCESS, 2016–2019 (KILOTON)
TABLE 123 MIDDLE EAST & AFRICA: MARKET SIZE, BY PRODUCTION PROCESS, 2020–2027 (USD MILLION)
TABLE 124 MIDDLE EAST & AFRICA: MARKET SIZE, BY PRODUCTION PROCESS, 2020–2027 (KILOTON)
TABLE 125 MIDDLE EAST & AFRICA: HISTORIC SODIUM HYDROXIDE MARKET SIZE, BY APPLICATION, 2016–2019 (USD MILLION)
TABLE 126 MIDDLE EAST & AFRICA: HISTORIC MARKET SIZE, BY APPLICATION, 2016–2019 (KILOTON)
TABLE 127 MIDDLE EAST & AFRICA: MARKET SIZE, BY APPLICATION, 2020–2027 (USD MILLION)
TABLE 128 MIDDLE EAST & AFRICA: MARKET SIZE, BY APPLICATION,  2020–2027 (KILOTON)
TABLE 129 SAUDI ARABIA: SODIUM HYDROXIDE MARKET SIZE, BY GRADE,  2020–2027 (USD MILLION)
TABLE 130 SAUDI ARABIA: MARKET SIZE, BY GRADE, 2020–2027 (KILOTON)
TABLE 131 SAUDI ARABIA: MARKET SIZE, BY APPLICATION,  2020–2027 (USD MILLION)
TABLE 132 SAUDI ARABIA: MARKET SIZE, BY APPLICATION,  2020–2027 (KILOTON)
TABLE 133 IRAN: SODIUM HYDROXIDE MARKET SIZE, BY GRADE, 2020–2027 (USD MILLION)
TABLE 134 IRAN: MARKET SIZE, BY GRADE, 2020–2027 (KILOTON)
TABLE 135 IRAN: MARKET SIZE, BY APPLICATION, 2020–2027 (USD MILLION)
TABLE 136 IRAN: MARKET SIZE, BY APPLICATION, 2020–2027 (KILOTON)
TABLE 137 REST OF MIDDLE EAST & AFRICA: SODIUM HYDROXIDE MARKET SIZE, BY GRADE,  2020–2027 (USD MILLION)
TABLE 138 REST OF MIDDLE EAST & AFRICA: MARKET SIZE, BY GRADE,  2020–2027 (KILOTON)
TABLE 139 REST OF MIDDLE EAST & AFRICA: MARKET SIZE, BY APPLICATION, 2020–2027 (USD MILLION)
TABLE 140 REST OF MIDDLE EAST & AFRICA: MARKET SIZE, BY APPLICATION, 2020–2027 (KILOTON)
TABLE 141 SOUTH AMERICA: SODIUM HYDROXIDE MARKET SIZE, BY COUNTRY,  2020–2027 (USD MILLION)
TABLE 142 SOUTH AMERICA: MARKET SIZE, BY COUNTRY,  2020–2027 (KILOTON)
TABLE 143 SOUTH AMERICA: MARKET SIZE, BY TYPE,  2016–2019 (USD MILLION)
TABLE 144 SOUTH AMERICA: MARKET SIZE, BY TYPE, 2016–2019 (KILOTON)
TABLE 145 SOUTH AMERICA: MARKET SIZE, BY TYPE,  2020–2027 (USD MILLION)
TABLE 146 SOUTH AMERICA: MARKET SIZE, BY TYPE, 2020–2027 (KILOTON)
TABLE 147 SOUTH AMERICA: MARKET SIZE, BY PRODUCTION PROCESS, 20116–2019 (USD MILLION)
TABLE 148 SOUTH AMERICA: MARKET SIZE, BY PRODUCTION PROCESS,  2016–2019 (KILOTON)
TABLE 149 SOUTH AMERICA: MARKET SIZE, BY PRODUCTION PROCESS,  2020–2027 (USD MILLION)
TABLE 150 SOUTH AMERICA: MARKET SIZE, BY PRODUCTION PROCESS,  2020–2027 (KILOTON)
TABLE 151 SOUTH AMERICA: MARKET SIZE, BY APPLICATION,  2016–2019 (USD MILLION)
TABLE 152 SOUTH AMERICA: MARKET SIZE, BY APPLICATION,  2016–2019 (KILOTON)
TABLE 153 SOUTH AMERICA: MARKET SIZE, BY APPLICATION,  2020–2027 (USD MILLION)
TABLE 154 SOUTH AMERICA: MARKET SIZE, BY APPLICATION,  2020–2027 (KILOTON)
TABLE 155 BRAZIL: SODIUM HYDROXIDE MARKET SIZE, BY GRADE, 2020–2027 (USD MILLION)
TABLE 156 BRAZIL: MARKET SIZE, BY GRADE, 2020–2027 (KILOTON)
TABLE 157 BRAZIL: MARKET SIZE, BY APPLICATION, 2020-2027 (USD MILLION)
TABLE 158 BRAZIL: MARKET SIZE, BY APPLICATION, 2020-2027 (KILOTON)
TABLE 159 ARGENTINA: SODIUM HYDROXIDE MARKET SIZE, BY GRADE, 2020–2027 (USD MILLION)
TABLE 160 ARGENTINA: MARKET SIZE, BY GRADE, 2020–2027 (KILOTON)
TABLE 161 ARGENTINA: MARKET SIZE, BY GRADE, 2020–2027 (USD MILLION)
TABLE 162 ARGENTINA: MARKET SIZE, BY GRADE, 2020–2027 (KILOTON)
TABLE 163 REST OF SOUTH AMERICA: SODIUM HYDROXIDE MARKET SIZE, BY GRADE,  2020–2027 (USD MILLION)
TABLE 164 REST OF SOUTH AMERICA: MARKET SIZE, BY GRADE,  2020–2027 (KILOTON)
TABLE 165 REST OF SOUTH AMERICA: MARKET SIZE, BY APPLICATION,  2020–2027 (USD MILLION)
TABLE 166 REST OF SOUTH AMERICA: MARKET SIZE, BY APPLICATION,  2020–2027 (KILOTON)
TABLE 167 SODIUM HYDROXIDE MARKET: MARKET SHARES OF KEY PLAYERS
TABLE 168 SODIUM HYDROXIDE MARKET: DEALS, 2019- 2022
TABLE 169 TATA CHEMICALS LIMITED: COMPANY OVERVIEW
TABLE 170 TATA CHEMICALS LIMITED: DEALS
TABLE 171 OLIN CORPORATION: COMPANY OVERVIEW
TABLE 172 WESTLAKE CORPORATION: COMPANY OVERVIEW
TABLE 173 WESTLAKE CORPORATION: DEALS
TABLE 174 OCCIDENTAL PETROLEUM CORPORATION: COMPANY OVERVIEW
TABLE 175 DOW: COMPANY OVERVIEW
TABLE 176 SOLVAY S.A: COMPANY OVERVIEW
TABLE 177 BASF SE: COMPANY OVERVIEW
TABLE 178 XINJIANG ZHONGTAI CHEMICAL CO. LTD.: COMPANY OVERVIEW
TABLE 179 AKZO NOBEL N.V.: COMPANY OVERVIEW
TABLE 180 BRENNTAG NORTH AMERICA, INC.: COMPANY OVERVIEW
TABLE 181 PPG INDUSTRIES, INC: COMPANY OVERVIEW
TABLE 182 INEOS GROUP AG: COMPANY OVERVIEW
TABLE 183 FORMOSA PLASTICS CORPORATION: COMPANY OVERVIEW
TABLE 184 FMC CORPORATION: COMPANY OVERVIEW
TABLE 185 VYNOVA.: COMPANY OVERVIEW
TABLE 186 NIRMA LIMITED: COMPANY OVERVIEW
TABLE 187 COVESTRO AG: COMPANY OVERVIEW
TABLE 188 HANWHA CORPORATION: COMPANY OVERVIEW
TABLE 189 SHIN-ETSU CHEMICAL CO., LTD.: COMPANY OVERVIEW
TABLE 190 VATS INTERNATIONAL: COMPANY OVERVIEW
TABLE 191 SODA – ARABIAN ALKALI COMPANY: COMPANY OVERVIEW
TABLE 192 HAWKINS INC.: COMPANY OVERVIEW
TABLE 193 DIVERSEY HOLDINGS LTD.: COMPANY OVERVIEW
TABLE 194 TECO CHEMICALS AS: COMPANY OVERVIEW


LIST OF FIGURES (39 FIGURES)

FIGURE 1 SODIUM HYDROXIDE MARKET SEGMENTATION
FIGURE 2 SODIUM HYDROXIDE MARKET: RESEARCH DESIGN
FIGURE 3 LIST OF STAKEHOLDERS INVOLVED AND BREAKDOWN OF PRIMARY INTERVIEWS
FIGURE 4 MARKET SIZE ESTIMATION: BOTTOM-UP APPROACH
FIGURE 5 MARKET SIZE ESTIMATION: TOP-DOWN APPROACH
FIGURE 6 MARKET SIZE ESTIMATION: SUPPLY-SIDE ANALYSIS
FIGURE 7 SODIUM HYDROXIDE MARKET: DATA TRIANGULATION
FIGURE 8 50% AQUEOUS SOLUTION SEGMENT TO DOMINATE MARKET
FIGURE 9 ORGANIC CHEMICAL APPLICATION TO LEAD MARKET DURING FORECAST PERIOD
FIGURE 10 MEMBRANE CELL TO BE FASTEST-GROWING SEGMENT DURING FORECAST PERIOD
FIGURE 11 NORTH AMERICA TO WITNESS HIGHEST CAGR DURING FORECAST PERIOD
FIGURE 12 ORGANIC CHEMICALS SECTOR TO OFFER GROWTH OPPORTUNITIES
FIGURE 13 ASIA PACIFIC ACCOUNTED FOR LARGEST SHARE IN 2021
FIGURE 14 ORGANIC CHEMICAL SEGMENT TO LEAD MARKET
FIGURE 15 MEMBRANE CELL SEGMENT ACCOUNTED FOR LARGEST SHARE OF OVERALL MARKET
FIGURE 16 US AND CHINA TO BE FASTEST-GROWING MARKETS
FIGURE 17 DRIVERS, RESTRAINTS, OPPORTUNITIES, AND CHALLENGES IN SODIUM HYDROXIDE MARKET
FIGURE 18 SODIUM HYDROXIDE MARKET: PORTER’S FIVE FORCES ANALYSIS
FIGURE 19 SODIUM HYDROXIDE ECOSYSTEM
FIGURE 20 SODIUM HYDROXIDE MARKET: VALUE CHAIN
FIGURE 21 REVENUE SHIFT FOR SODIUM HYDROXIDE MANUFACTURERS
FIGURE 22 50% W/W SOLUTION SEGMENT DOMINATED SODIUM HYDROXIDE MARKET  IN 2021
FIGURE 23 MEMBRANE CELL SEGMENT TO LEAD SODIUM HYDROXIDE MARKET DURING FORECAST PERIOD
FIGURE 24 ORGANIC CHEMICAL SEGMENT TO LEAD SODIUM HYDROXIDE MARKET DURING FORECAST PERIOD
FIGURE 25 REGIONAL SNAPSHOT: ASIA PACIFIC TO GROW AT HIGHEST RATE DURING FORECAST PERIOD
FIGURE 26 ASIA PACIFIC: SODIUM HYDROXIDE MARKET SNAPSHOT
FIGURE 27 COMPANIES ADOPTED NEW PRODUCT LAUNCHES AS KEY GROWTH  STRATEGY IN 2022
FIGURE 28 SHARE OF LEADING COMPANIES IN SODIUM HYDROXIDE MARKET
FIGURE 29 REVENUE ANALYSIS OF KEY COMPANIES
FIGURE 30 COMPANY EVALUATION QUADRANT: SODIUM HYDROXIDE MARKET, 2021
FIGURE 31 SME MATRIX: SODIUM HYDROXIDE MARKET, 2021
FIGURE 32 TATA CHEMICALS LIMITED: COMPANY SNAPSHOT
FIGURE 33 OLIN CORPORATION: COMPANY SNAPSHOT
FIGURE 34 WESTLAKE CORPORATION: COMPANY SNAPSHOT
FIGURE 35 OCCIDENTAL PETROLEUM CORPORATION: COMPANY SNAPSHOT
FIGURE 36 D0W: COMPANY SNAPSHOT
FIGURE 37 SOLVAY S.A: COMPANY SNAPSHOT
FIGURE 38 BASF SE: COMPANY SNAPSHOT
FIGURE 39 AKZO NOBEL N.V.: COMPANY SNAPSHOT

This research involves the use of extensive secondary sources and databases, such as Factiva and Bloomberg, to identify and collect information useful for a technical and market-oriented study of the Sodium Hydroxide market. Primary sources include industry experts from related industries and preferred suppliers, manufacturers, distributors, technologists, standards & certification organizations, and organizations related to all segments of the value chain of this industry. In-depth interviews have been conducted with various primary respondents, such as key industry participants, subject matter experts (SMEs), executives of key companies, and industry consultants to obtain and verify critical qualitative and quantitative information as well as to assess growth prospects.

Sodium Hydroxide Market Secondary Research

In the secondary research process, various sources such as annual reports, press releases, and investor presentations of companies; white papers; and publications from recognized websites and databases have been referred to for identifying and collecting information. Secondary research has been used to obtain key information about the industry's supply chain, the total pool of key players, market classification and segmentation according to the industry trends to the bottom-most level, regional markets, and key developments from both market-and technology-oriented perspectives.

Sodium Hydroxide Market Primary Research

The Sodium Hydroxide market comprises several stakeholders in the supply chain, which include suppliers, processors, and end-product manufacturers. Various primary sources from the supply and demand sides of the markets have been interviewed to obtain qualitative and quantitative information. The primary participants from the demand side include key opinion leaders, executives, vice presidents, and CEOs of companies in the Sodium Hydroxide market. Primary sources from the supply side include associations and institutions involved in the Sodium Hydroxide industry, key opinion leaders, and processing players.

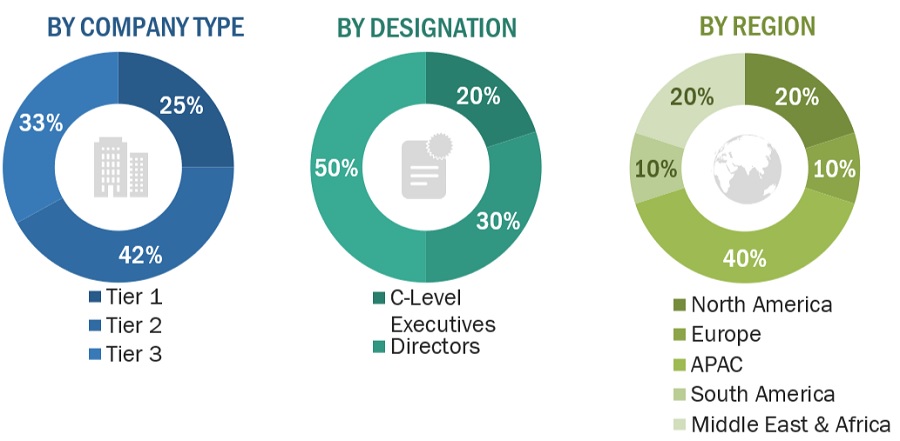
Following is the breakdown of primary respondents

Sodium Hydroxide Market Size, and Share

Notes: Others include sales, marketing, and product managers.

Tier 1: >USD 1 Billion; Tier 2: USD 500 million–1 Billion; and Tier 3:

To know about the assumptions considered for the study, download the pdf brochure

Sodium Hydroxide Market Size Estimation

Both top-down and bottom-up approaches were used to estimate and validate the size of the global Sodium Hydroxide market. The research methodology used to estimate the market size includes the following:

  • The key players in the industry were identified through extensive secondary research.
  • The supply chain of the industry and market size, in terms of value, were determined through primary and secondary research.
  • All percentage shares split, and breakdowns were determined using secondary sources and verified through primary sources.
  • All possible parameters that affect the markets covered in this research study were accounted for, viewed in extensive detail, verified through primary research, and analyzed to obtain the final quantitative and qualitative data.
  • The research includes the study of reports, reviews, and newsletters of key industry players along with extensive interviews with key officials, such as directors and marketing executives.

Sodium Hydroxide Market Data Triangulation

After arriving at the total market size from the estimation process explained above, the overall market was split into several segments and subsegments. To complete the overall market size estimation process and arrive at the exact statistics for all segments and subsegments, the data triangulation and market breakdown procedures have been employed, wherever applicable. The data have been triangulated by studying various factors and trends from both the demand and supply sides. In addition, the market size has been validated by using both the top-down and bottom-up approaches.

Sodium Hydroxide Market Report Objectives

  • To define, describe, and forecast the global Sodium Hydroxide market in terms of both volume and value
  • To provide insights regarding the significant factors influencing the growth of the market (drivers, restraints, opportunities, and challenges)
  • To analyze and forecast the market based on application
  • To forecast the market size, in terms of volume and value, with respect to five main regions, namely, North America, Europe, Asia Pacific, the Middle East & Africa, and South America
  • To analyze the opportunities in the market for stakeholders and provide details of the competitive landscape
  • To strategically profile key players in the market
  • To analyze competitive developments in the market, such as new product launch, capacity expansion, and merger & acquisition
  • To strategically profile the leading players and comprehensively analyze their key developments, such as expansions and mergers & acquisitions, in the Sodium Hydroxide market

Sodium Hydroxide Market Available Customizations

Along with the given market data, MarketsandMarkets offers customizations as per the specific needs of the companies. The following customization options are available for the report:

Product Analysis:

  • Product Matrix which gives a detailed comparison of the product portfolio of each company

Sodium Hydroxide Market Regional Analysis

  • Further breakdown of the Rest of APAC Sodium Hydroxide market
  • Further breakdown of Rest of Europe Sodium Hydroxide market

Sodium Hydroxide Market Company Information

  • Detailed analysis and profiling of additional market players (up to 5)
Custom Market Research Services

We will customize the research for you, in case the report listed above does not meet with your exact requirements. Our custom research will comprehensively cover the business information you require to help you arrive at strategic and profitable business decisions.

Request Customization

Instant Answers with GPT - Ask Now!

Ask real questions. Get complete answers !
Report Code
CH 8173
Published ON
Sep, 2022
Choose License Type
BUY NOW
  • SHARE
X
Request Customization
Speak to Analyst
Speak to Analyst
OR FACE-TO-FACE MEETING
PERSONALIZE THIS RESEARCH
  • Triangulate with your Own Data
  • Get Data as per your Format and Definition
  • Gain a Deeper Dive on a Specific Application, Geography, Customer or Competitor
  • Any level of Personalization
REQUEST A FREE CUSTOMIZATION
LET US HELP YOU!
  • What are the Known and Unknown Adjacencies Impacting the Sodium Hydroxide Market
  • What will your New Revenue Sources be?
  • Who will be your Top Customer; what will make them switch?
  • Defend your Market Share or Win Competitors
  • Get a Scorecard for Target Partners
CUSTOMIZED WORKSHOP REQUEST
+1-888-600-6441
  • Call Us
  • +1-888-600-6441 (Corporate office hours)
  • +1-888-600-6441 (US/Can toll free)
  • +44-800-368-9399 (UK office hours)
CONNECT WITH US
ABOUT TRUST ONLINE
©2024 MarketsandMarkets Research Private Ltd. All rights reserved
DMCA.com Protection Status Website Feedback