Spectrum Analyzer Market by Offering (Product & Software), Type (Swept-Tuned, Vector Signal, Real-Time), Range (<6 GHz, 6 GHz–18 GHz, >18 GHz), Form Factor (Handheld, Portable, Benchtop), Network Technology, End-User Industry - Global Forecasts to 2035


The Spectrum Analyzer Market is witnessing steady expansion as wireless communication, semiconductor development, aerospace and defense electronics, automotive connectivity, and industrial IoT applications become increasingly dependent on accurate radio-frequency (RF) and microwave signal measurement. The global Spectrum Analyzer Market is estimated at approximately USD 2–3 billion in 2025 and is projected to reach USD 5–7 billion by 2035, registering a CAGR of 8%–10% during the forecast period. Increasing deployment of 5G and emerging 6G technologies, growing spectrum utilization, connected devices, satellite communication, automotive radar, and advanced electronic systems are key factors supporting market growth. AI, IoT, automation, and digital transformation are also reshaping test and measurement workflows by enabling automated signal analysis, predictive maintenance, remote instrument control, and intelligent identification of interference and abnormal RF behavior. As wireless networks become more complex and operate across wider frequency ranges, spectrum analyzers are becoming essential tools for design validation, compliance testing, troubleshooting, manufacturing, and field measurement.
Key Market Trends & Insights
One of the most important trends in the Spectrum Analyzer Market is the transition toward higher-frequency and wider-bandwidth measurement capabilities. The expansion of 5G networks, millimeter-wave communication, satellite broadband, radar systems, and emerging 6G research is creating demand for instruments capable of measuring increasingly complex signals across broad frequency ranges. Manufacturers are therefore investing in high-performance analyzers with greater bandwidth, faster sweep speeds, improved dynamic range, and advanced signal-processing capabilities.
North America is expected to remain a leading regional market because of its strong aerospace and defense industry, advanced telecommunications infrastructure, semiconductor ecosystem, and high investment in RF and microwave technologies. Asia Pacific is projected to record the fastest growth, supported by rapid 5G deployment, electronics manufacturing, semiconductor investments, automotive production, and expansion of wireless infrastructure across China, Japan, South Korea, and other economies.
Real-time spectrum analysis is another major growth area. Traditional swept analyzers remain widely used, but real-time spectrum analyzers are increasingly preferred for capturing short-duration transients, interference, frequency-hopping signals, and other events that conventional measurement approaches may miss. This capability is especially important for advanced wireless systems and defense applications.
AI is increasingly being incorporated into test and measurement workflows. Machine learning can help identify signal patterns, classify interference, detect anomalies, automate measurements, and reduce the expertise required for complex RF analysis. AI-enabled software is therefore becoming an important differentiator alongside the hardware specifications of spectrum analyzers.
The adoption of portable and handheld spectrum analyzers is also expanding. Field engineers require lightweight instruments for installation, maintenance, network optimization, electromagnetic compatibility testing, and interference hunting. Cloud connectivity and remote instrument management are further enabling distributed testing environments.
Market Size & Forecast
- Base year market size: USD 2–3 billion in 2025
- Forecast value by 2035: USD 5–7 billion by 2035
- Expected CAGR: 8%–10% during 2025–2035
- Growth factors: Expansion of 5G and future 6G networks, satellite communications, IoT connectivity, automotive radar, semiconductor manufacturing, aerospace and defense electronics, and increasing demand for automated RF testing are expected to drive market growth.
The market outlook remains favorable as electronic systems become more dependent on wireless connectivity and high-frequency technologies. Increasing complexity in RF environments is simultaneously creating demand for measurement systems with greater accuracy, bandwidth, speed, and automation.
Spectrum Analyzer Market Top 10 key takeaway
- The Spectrum Analyzer Market is driven by growing demand for advanced RF and microwave measurement.
- The market is estimated at USD 2–3 billion in 2025.
- The market is projected to reach USD 5–7 billion by 2035.
- 5G deployment is a major demand driver for spectrum analysis equipment.
- Asia Pacific is expected to register the fastest growth during the forecast period.
- North America is expected to remain a leading regional market.
- Real-time spectrum analyzers are gaining importance for complex signal environments.
- AI and automation are improving signal identification and measurement workflows.
- Aerospace, defense, telecommunications, and semiconductor industries represent major application areas.
- Portable, software-defined, cloud-connected, and high-frequency analyzers are expected to create new opportunities.
Product Insights
The spectrum analyzer product segment includes swept-tuned, vector signal, real-time, portable, handheld, and benchtop instruments. Benchtop spectrum analyzers continue to represent an important segment because they provide high measurement accuracy, broad frequency coverage, sophisticated signal analysis, and advanced connectivity. They are extensively used in research laboratories, semiconductor development, telecommunications testing, aerospace and defense laboratories, and electronics manufacturing.
However, portable and handheld spectrum analyzers are gaining momentum because of the increasing requirement for field-based testing. Telecommunications operators and installation teams use portable analyzers to assess network performance, identify interference, verify signal quality, and support network deployment. Their compact form factors allow engineers to perform measurements outside controlled laboratory environments.
Vector signal analyzers are also becoming increasingly important as wireless systems use sophisticated modulation formats and higher data rates. These instruments enable detailed analysis of modulation quality, error vector magnitude, occupied bandwidth, channel power, and other parameters needed for modern communication-system validation.
Real-time spectrum analyzers represent one of the most promising product categories. Their ability to capture transient signals and analyze large amounts of spectrum data enables engineers to identify intermittent interference and complex signal behavior. With AI-enabled software, these systems can increasingly automate signal classification and anomaly detection.
Future product development is expected to emphasize wider bandwidths, higher frequency ranges, faster processing, improved dynamic range, lower noise floors, and more intuitive software. Cloud connectivity and remote operation will also become increasingly important for distributed engineering teams.
Technology / Component Insights
Technology innovation is a central factor shaping the Spectrum Analyzer Market. Modern spectrum analyzers combine RF front ends, mixers, local oscillators, analog-to-digital converters, digital signal processors, displays, control systems, and sophisticated software. Improvements in these components directly influence frequency range, resolution bandwidth, dynamic range, sweep speed, and measurement accuracy.
Digital signal processing is particularly important because it enables analyzers to perform advanced measurements and process increasingly large volumes of RF data. High-speed ADCs allow instruments to capture wider bandwidths, while advanced processors enable real-time analysis of complex signals.
5G and emerging 6G technologies are increasing the need for advanced RF measurement. Massive MIMO, carrier aggregation, millimeter-wave frequencies, beamforming, and complex modulation schemes require sophisticated instruments capable of evaluating signal characteristics across multiple dimensions.
AI and machine learning are becoming important software-level technologies. AI-based systems can automatically recognize signal patterns, identify interference sources, compare measurements with historical data, and detect anomalies. In manufacturing environments, automated test systems can use software algorithms to determine whether devices meet predefined RF performance criteria.
IoT is expanding the number of connected devices that require RF validation. Spectrum analyzers can support testing of wireless modules, sensors, gateways, industrial equipment, smart-home products, and other connected systems. As billions of devices operate across shared spectrum, interference monitoring and spectrum management become increasingly important.
Automation is also transforming test laboratories. Automated measurement sequences allow manufacturers to perform repetitive tests with limited human intervention, improving throughput and reducing measurement variability. Integration with manufacturing execution systems and cloud-based analytics can further support centralized monitoring and quality management.
Future innovation is expected to include AI-assisted troubleshooting, software-defined measurement platforms, higher-frequency capabilities, advanced cybersecurity, remote testing, and increasingly autonomous test systems.
Application Insights
Telecommunications represents one of the leading applications in the Spectrum Analyzer Market. The rapid deployment of 5G infrastructure requires extensive testing of base stations, antennas, RF components, mobile devices, and network equipment. Spectrum analyzers help engineers verify signal quality, measure interference, validate channel performance, and ensure compliance with technical requirements.
The aerospace and defense sector represents another major application area. Radar, electronic warfare, satellite communications, secure communications, navigation, and avionics systems operate across sophisticated RF environments. Spectrum analyzers are used during research, development, production, maintenance, and system validation.
Semiconductor and electronics manufacturing is also generating substantial demand. RF components, wireless chipsets, amplifiers, filters, oscillators, and communication modules require precise characterization during development and production. As semiconductor designs move toward higher frequencies and more integrated architectures, accurate spectrum measurement becomes increasingly important.
Automotive applications are expanding rapidly due to connected vehicles, vehicle-to-everything communication, radar-based ADAS, and electric vehicle electronics. Automotive radar operating in high-frequency bands requires specialized RF measurement capabilities to validate performance and detect interference.
Industrial IoT, smart infrastructure, satellite communications, healthcare devices, and consumer electronics are additional areas of opportunity. Future growth will increasingly come from applications where wireless connectivity and RF reliability are critical.
Regional Insights
North America is expected to maintain its leadership position in the Spectrum Analyzer Market, supported by advanced telecommunications networks, strong aerospace and defense spending, semiconductor R&D, and the presence of major test and measurement companies. The US market benefits from continued investments in 5G, satellite communications, radar, electronic warfare, and advanced semiconductor technologies. Research institutions and technology companies also contribute to strong demand for high-performance RF measurement equipment.
Europe represents another mature market, with demand supported by automotive electronics, aerospace, industrial automation, telecommunications, and regulatory requirements related to electromagnetic compatibility. Germany, France, and the UK are important technology centers for automotive and industrial RF applications.
Asia Pacific is expected to be the fastest-growing regional market. Rapid telecommunications development, extensive electronics manufacturing, semiconductor investments, EV production, and increasing deployment of connected infrastructure are supporting demand. China is particularly important because of its large wireless ecosystem and electronics manufacturing base, while Japan and South Korea continue to invest in advanced communication and semiconductor technologies.
- North America: Strong demand from telecommunications, aerospace, defense, and semiconductor industries.
- Europe: Growth supported by automotive electronics, industrial automation, and advanced wireless technologies.
- Asia Pacific: Expected to record the fastest growth due to electronics manufacturing and 5G expansion.
- China: Increasing wireless infrastructure and semiconductor investment support market expansion.
- Japan and South Korea: Strong R&D ecosystems create demand for high-performance RF measurement.
Country-Specific Market Trends
China is expected to experience strong growth in the Spectrum Analyzer Market due to rapid telecommunications deployment, electronics manufacturing, semiconductor development, and expansion of industrial IoT. Investments in 5G infrastructure and next-generation communication technologies are supporting demand for RF testing equipment. Japan is expected to maintain a technologically advanced market driven by automotive electronics, robotics, telecommunications, consumer electronics, and semiconductor R&D.
The United States is expected to remain the largest country-level market in North America. Demand is supported by advanced wireless infrastructure, aerospace and defense programs, satellite communication, semiconductor manufacturing, and 6G research. Canada is benefiting from telecommunications modernization, aerospace applications, and research initiatives, while Mexico's electronics and automotive manufacturing industries are creating additional demand for testing equipment.
Germany is expected to remain a key European market because of its automotive manufacturing base and industrial technology ecosystem. France benefits from aerospace, defense, telecommunications, and electronics applications. Government initiatives supporting digital infrastructure, semiconductor capabilities, industrial automation, and advanced communications are expected to sustain investment across Europe.
Country-level growth is expected to vary according to telecommunications investment, electronics manufacturing capacity, government technology programs, and adoption of advanced wireless systems.
- China: 5G infrastructure and electronics manufacturing are major market drivers.
- Japan: Automotive, semiconductor, robotics, and wireless R&D support demand.
- United States: Aerospace, defense, 5G, satellite, and semiconductor applications dominate.
- Canada and Mexico: Telecommunications and electronics manufacturing provide growth opportunities.
- Germany and France: Automotive, aerospace, industrial, and communication applications remain important.
Key Spectrum Analyzer Market Company Insights
The competitive landscape of the Spectrum Analyzer Market includes major test and measurement companies such as Keysight Technologies, Rohde & Schwarz, Anritsu, Teledyne Technologies, Yokogawa Test & Measurement, VIAVI Solutions, and National Instruments. These companies compete through measurement accuracy, frequency coverage, bandwidth, dynamic range, software functionality, portability, and application-specific solutions.
Keysight Technologies continues to focus on advanced wireless, semiconductor, aerospace, and 5G/6G test solutions, while Rohde & Schwarz emphasizes high-performance spectrum analysis, wireless communications, aerospace and defense, and EMC testing. Anritsu has a strong presence in mobile communications, network testing, and RF measurement applications.
Teledyne Technologies is expanding its measurement capabilities across high-speed electronics and advanced instrumentation. VIAVI Solutions focuses strongly on communications testing and network deployment, while Yokogawa provides precision measurement solutions for research and industrial applications. National Instruments, through its software-defined test approach, contributes to the trend toward modular and automated RF measurement.
- Keysight Technologies: Focuses on 5G/6G, semiconductor, aerospace, and advanced RF testing.
- Rohde & Schwarz: Emphasizes high-performance spectrum analysis and wireless testing.
- Anritsu: Targets mobile communications, RF testing, and network applications.
- VIAVI Solutions: Focuses on telecommunications infrastructure and field testing.
- Yokogawa Test & Measurement: Emphasizes precision measurement and industrial applications.
Recent Developments
Spectrum analyzer manufacturers are increasingly introducing instruments with wider instantaneous bandwidths, higher frequency coverage, faster signal processing, and improved real-time analysis. These developments are intended to address increasingly complex 5G, satellite, radar, and next-generation wireless applications.
AI-assisted measurement and automated signal classification are also emerging as important product capabilities. Advanced software can help engineers identify interference, classify signals, automate measurement procedures, and analyze large datasets more efficiently.
Another development is the growing integration of spectrum analyzers into automated test environments. Manufacturers are connecting instruments with cloud platforms, laboratory automation systems, and remote-control software to support distributed engineering and manufacturing operations. These developments are expected to improve productivity and reduce testing time.
Market Segmentation
The Spectrum Analyzer Market can be segmented by product, technology or component, application, and region. By product, the market includes benchtop, portable, handheld, real-time, swept-tuned, and vector signal analyzers. Benchtop systems remain important for laboratory and high-precision applications, while portable and handheld systems are gaining popularity for field testing and network deployment.
By technology or component, spectrum analyzers can be evaluated according to RF front-end architecture, frequency range, bandwidth, digital signal processing, display and control systems, and software capabilities. Real-time digital signal processing and high-speed data conversion are becoming increasingly important as wireless signals become wider and more complex.
By application, telecommunications, aerospace and defense, semiconductor and electronics manufacturing, automotive, industrial IoT, consumer electronics, and research institutions represent important demand centers. By region, North America, Europe, Asia Pacific, and other markets form the major geographic segments.
- By Product: Benchtop systems lead high-performance laboratory applications, while portable analyzers support field testing.
- By Technology: Digital signal processing and real-time analysis are major innovation areas.
- By Application: Telecommunications, aerospace and defense, and semiconductor testing remain key applications.
- By Frequency Range: Demand is shifting toward higher-frequency and millimeter-wave measurement capabilities.
- By Region: North America leads, while Asia Pacific is expected to grow fastest.
Conclusion
The Spectrum Analyzer Market is positioned for sustained growth as wireless connectivity, advanced electronics, semiconductor development, and high-frequency technologies become increasingly important across industries. Estimated at USD 2–3 billion in 2025, the market is projected to reach USD 5–7 billion by 2035, expanding at a CAGR of 8%–10%. The transition toward 5G, 6G, satellite communications, automotive radar, industrial IoT, and advanced semiconductor architectures will continue increasing the need for accurate and flexible RF measurement.
AI and automation will become particularly important in the next phase of market development. Intelligent signal classification, automated test sequences, predictive diagnostics, cloud-based analytics, and remote instrument management can reduce testing complexity and improve engineering productivity. At the same time, real-time spectrum analysis and higher-frequency measurement capabilities will become increasingly important as spectrum environments become more crowded and technologically complex.
For telecommunications operators, semiconductor manufacturers, aerospace and defense organizations, automotive companies, and electronics manufacturers, spectrum analyzers are strategic tools for ensuring performance, reliability, compliance, and electromagnetic compatibility. Through 2035, vendors that combine advanced hardware with intelligent software, automation, connectivity, and application-specific solutions will be well positioned to capture emerging opportunities.
FAQs
1. What is the market size of the Spectrum Analyzer Market?
The global Spectrum Analyzer Market is estimated at approximately USD 2–3 billion in 2025 and is projected to reach USD 5–7 billion by 2035, supported by 5G, semiconductor, aerospace, defense, automotive, and IoT applications.
2. What is the growth rate of the Spectrum Analyzer Market?
The Spectrum Analyzer Market is expected to grow at a CAGR of 8%–10% from 2025 to 2035, driven by increasing demand for high-frequency testing, wireless infrastructure, real-time spectrum analysis, and automated measurement.
3. What are the key drivers of the Spectrum Analyzer Market?
Major drivers include 5G and emerging 6G deployment, IoT connectivity, semiconductor manufacturing, aerospace and defense electronics, automotive radar, satellite communication, increasing RF spectrum congestion, and the growing adoption of automated testing.
4. Which region is expected to lead the Spectrum Analyzer Market?
North America is expected to remain a leading regional market because of its strong telecommunications, aerospace and defense, semiconductor, and technology sectors. Asia Pacific is projected to register the fastest growth during the forecast period.
5. Who are the key companies in the Spectrum Analyzer Market?
Key companies include Keysight Technologies, Rohde & Schwarz, Anritsu, Teledyne Technologies, Yokogawa Test & Measurement, VIAVI Solutions, and National Instruments. These companies are focusing on higher frequency ranges, real-time analysis, automation, AI-enabled software, and application-specific RF testing solutions.
To speak to our analyst for a discussion on the above findings, click Speak to Analyst
 Exclusive indicates content/data unique to MarketsandMarkets and not available with any competitors.
Table of Contents
1 Introduction (Page No. - 17)
1.1 Objectives of the Study
1.2 Market Definition
1.3 Study Scope
1.3.1 Markets Covered
1.3.2 Geographic Scope
1.3.3 Years Considered for the Study
1.4 Currency
1.5 Limitations
1.6 Stakeholders
2 Research Methodology (Page No. - 21)
2.1 Research Data
2.1.1 Secondary Data
2.1.1.1 Key Data From Secondary Sources
2.1.2 Primary Data
2.1.2.1 Key Data From Primary Sources
2.1.2.2 Key Industry Insights
2.1.2.3 Breakdown of Primaries
2.2 Market Size Estimation
2.2.1 Bottom-Up Approach
2.2.2 Top-Down Approach
2.3 Market Breakdown and Data Triangulation
2.4 Research Assumptions
3 Executive Summary (Page No. - 29)
4 Premium Insights (Page No. - 34)
4.1 Attractive Opportunities in the Spectrum Analyzer Market Between 2016 and 2022
4.2 Spectrum Analyzer Market, By Offering (2016–2022)
4.3 Spectrum Analyzer Market, By Type (2016–2022)
4.4 Spectrum Analyzer Market, By Frequency Range (2016–2022)
4.5 Spectrum Analyzer Market, By Form Factor (2016–2022)
4.6 Spectrum Analyzer Market, By Region and End-User Industry
4.7 Spectrum Analyzer Market, By Region (2016–2022)
4.8 Life Cycle Analysis, By Region
5 Market Overview (Page No. - 40)
5.1 Introduction
5.2 Market Segmentation
5.2.1 Spectrum Analyzer Market, By Offering
5.2.2 Spectrum Analyzer Market, By Type
5.2.3 Spectrum Analyzer Market, By Frequency Range
5.2.4 Spectrum Analyzer Market, By Form Factor
5.2.5 Spectrum Analyzer Market, By Network Technology
5.2.6 Spectrum Analyzer Market, By End-User Industry
5.2.7 Spectrum Analyzer Market, By Geography
5.3 Market Dynamics
5.3.1 Drivers
5.3.1.1 Growing Market for Wireless Technology Which Requires Spectrum Analyzers for Testing
5.3.1.2 Growing Demand for Spectrum Analyzers With Multi-Tasking Capabilities
5.3.1.3 Technological Advancement Leading to Innovation in Spectrum Analyzer Offering
5.3.1.4 Increasing Adoption of Portable and Hand-Held Spectrum Analyzers
5.3.1.5 Significant Advancements in Terms of Bandwidth and Frequency Globally
5.3.2 Restraints
5.3.2.1 Requirement of Cost-Effective Spectrum Analyzers With Maximum Features
5.3.2.2 Increasing Demand for Second-Hand Spectrum Analyzers
5.3.3 Opportunities
5.3.3.1 Constantly Growing Need for Higher Bandwidth
5.3.3.2 Widespread Deployment of Lte
5.3.4 Challenges
5.3.4.1 Need for Components to Cope Up With Increasing Bandwidth
5.3.4.2 Controlling the Noise Floor of the Spectrum Analyzing System
5.3.4.3 Measurement of Low-Level Signals With A Spectrum Analyzer
6 Industry Trends (Page No. - 51)
6.1 Introduction
6.2 Advanced Technological Trends and Innovations
6.2.1 Lte and Lte-Advanced is the Future of Telecom
6.2.2 Market Potential for Lte Services
6.2.3 Role of Test and Measurement Equipment in This Segment
6.3 Value Chain Analysis
6.4 Porter’s Five Forces Analysis
6.4.1 Threat of New Entrants
6.4.2 Threat of Substitutes
6.4.3 Bargaining Power of Suppliers
6.4.4 Bargaining Power of Buyers
6.4.5 Intensity of Competitive Rivalry
7 Spectrum Analyzer Market, By Offering (Page No. - 59)
7.1 Introduction
7.2 Product
7.3 Software
8 Spectrum Analyzer Market, By Type (Page No. - 62)
8.1 Introduction
8.2 Swept-Tuned Spectrum Analyzer
8.2.1 Rf Tuning Method
8.2.2 Super Heterodyne
8.3 Vector Signal Spectrum Analyzer
8.4 Real-Time Spectrum Analyzer
8.4.1 Fast Fourier Transform (FFT) Spectrum Analyzer
8.4.2 Parallel Filter Analyzer
9 Spectrum Analyzer Market, By Frequency Range (Page No. - 78)
9.1 Introduction
9.2 <6 GHz
9.3 6 GHz–18 GHz
9.4 >18 GHz
10 Spectrum Analyzer Market, By Form Factor (Page No. - 87)
10.1 Introduction
10.2 Handheld Spectrum Analyzer
10.3 Portable Spectrum Analyzer
10.4 Benchtop Spectrum Analyzer
11 Spectrum Analyzer Market, By Network Technology (Page No. - 95)
11.1 Introduction
11.2 Wired Network Technology
11.3 Wireless Network Technology
12 Spectrum Analyzer Market, By End-User Industry (Page No. - 99)
12.1 Introduction
12.2 Automotive and Transportation
12.3 Aerospace & Defense
12.4 IT & Telecommunication
12.5 Medical & Healthcare
12.6 Semiconductors & Electronics
12.7 Industrial & Energy Sector
12.8 Others (Educational Institutes and Government Sector)
13 Geographic Analysis (Page No. - 124)
13.1 Introduction
13.2 North America
13.2.1 U.S.
13.2.2 Canada
13.2.3 Mexico
13.3 Europe
13.3.1 Germany
13.3.2 U.K.
13.3.3 France
13.3.4 ITaly
13.3.5 Rest of Europe (RoE)
13.4 Asia-Pacific (APAC)
13.4.1 China
13.4.2 Japan
13.4.3 South Korea
13.4.4 India
13.4.5 Rest of APAC (RoAPAC)
13.5 Rest of the World (RoW)
13.5.1 South America
13.5.2 Middle East & Africa
14 Competitive Landscape (Page No. - 142)
14.1 Overview
14.2 Key Players in Spectrum Analyzer Market
14.3 Competitive Situations and Trends
14.3.1 New Product Developments
14.3.2 Partnerships, Agreements, Contracts, and Collaborations
14.3.3 Mergers & Acquisitions
14.3.4 Other Developments
15 Company Profiles (Page No. - 152)
(Company at A Glance, Business Overview, Products Offered, Key Strategy, Recent Developments, SWOT Analysis & MnM View)*
15.1 Introduction
15.2 Keysight Technologies
15.3 Rohde & Schwarz GmbH & Co., Kg.
15.4 Fortive Corporation
15.5 Anritsu Corporation
15.6 Advantest Corporation
15.7 Cobham PLC
15.8 Giga-Tronics Incorporated
15.9 Yokogawa Electric Corporation
15.10 National Instruments Corporation
15.11 LP Technologies Inc
15.12 Teledyne Lecroy, Inc.
15.13 Avcom of Virginia. Inc
15.14 B&K Precision Corporation
15.15 Stanford Research Systems, Inc.
*Details on Company at A Glance, Recent Financials, Products Offered, Strategies & Insights, & Recent Developments Might Not Be Captured in Case of Unlisted Companies.
16 Appendix (Page No. - 189)
16.1 Insights of Industry Experts
16.2 Discussion Guide
16.3 Knowledge Store: Marketsandmarkets’ Subscription Portal
16.4 Introducing Rt: Real-Time Market Intelligence
16.5 Available Customizations
16.5.1 Market Size for 2017, 2019, and 2021 for Segments Such as Offering, Type, Frequency Range, Form Factor, Network Technology, End-User Industry, and Geography.
16.5.2 Unit Shipment of Global Spectrum Analyzer Market
16.5.3 Company Information: Detailed Analysis and Profiling of Additional Five Market Players
16.6 Related Reports
List of Tables (87 Tables)
Table 1 Currency Table
Table 2 Spectrum Analyzer Market, By Offering, 2013–2022 (USD Million)
Table 3 Worldwide Lte Connections and Networks (2014)
Table 4 Recent Spectrum Analyzers Offering With Multi-Tasking Capabilities, By Key Player (2012–2016)
Table 5 Porter’s Five Forces Analysis (2015): High Impact of Intensity of Competitive Rivalry on the Spectrum Analyzer Market
Table 6 Spectrum Analyzer Market, By Offering, 2013–2022 (USD Million)
Table 7 Spectrum Analyzer Market, By Type, 2013–2022 (USD Million)
Table 8 Swept-Tuned Spectrum Analyzer Market, By End-User Industry, 2013–2022 (USD Million)
Table 9 Swept-Tuned Spectrum Analyzer Market, By Frequency Range, 2013–2022 (USD Million)
Table 10 Swept-Tuned Spectrum Analyzer Market, By Form Factor, 2013–2022 (USD Million)
Table 11 Swept-Tuned Spectrum Analyzer Market, By Network Technology, 2013–2022 (USD Million)
Table 12 Swept-Tuned Spectrum Analyzer Market, By Region, 2013–2022 (USD Million)
Table 13 Vector Signal Spectrum Analyzer Market, By End-User Industry, 2013–2022 (USD Million)
Table 14 Vector Signal Spectrum Analyzer Market, By Frequency Range, 2013–2022 (USD Million)
Table 15 Vector Signal Spectrum Analyzer Market, By Form Factor,2013–2022 (USD Million)
Table 16 Vector Signal Spectrum Analyzer Market, By Network Technology, 2013–2022 (USD Million)
Table 17 Vector Signal Spectrum Analyzer Market, By Region, 2013–2022 (USD Million)
Table 18 Real-Time Spectrum Analyzer Market, By End-User Industry, 2013–2022 (USD Million)
Table 19 Real-Time Spectrum Analyzer Market, By Frequency Range, 2013–2022 (USD Million)
Table 20 Real-Time Spectrum Analyzer Market, By Form Factor, 2013–2022 (USD Million)
Table 21 Real-Time Spectrum Analyzer Market, By Network Technology, 2013–2022 (USD Million)
Table 22 Real-Time Spectrum Analyzer Market, By Region, 2013–2022 (USD Million)
Table 23 Spectrum Analyzer Market, By Frequency Range, 2013–2022 (USD Million)
Table 24 Spectrum Analyzer Market for <6 GHz Frequency Range, By End-User Industry, 2013–2022 (USD Million)
Table 25 Spectrum Analyzer Market for <6 GHz Frequency Range, By Type, 2013–2022 (USD Million)
Table 26 Spectrum Analyzer Market for 6 GHz–18 GHz Frequency Range, By End-User Industry, 2013–2022 (USD Million)
Table 27 Spectrum Analyzer Market for 6 GHz–18 GHz Frequency Range, By Type, 2013–2022 (USD Million)
Table 28 Spectrum Analyzer Market for >18 GHz Frequency Range, By End-User Industry, 2013–2022 (USD Thousand)
Table 29 Spectrum Analyzer Market for >18 GHz Frequency Range, By Type, 2013–2022 (USD Million)
Table 30 Spectrum Analyzer Market, By Form Factor, 2013–2022 (USD Million)
Table 31 Handheld Spectrum Analyzer Market, By End-User Industry, 2013–2022 (USD Million)
Table 32 Handheld Spectrum Analyzer Market, By Type, 2013–2022 (USD Million)
Table 33 Portable Spectrum Analyzer Market, By End-User Industry, 2013–2022 (USD Million)
Table 34 Portable Spectrum Analyzer Market, By Type, 2013–2022 (USD Million)
Table 35 Benchtop Spectrum Analyzer Market, By End-User Industry, 2013–2022 (USD Million)
Table 36 Benchtop Spectrum Analyzer Market, By Type, 2013–2022 (USD Million)
Table 37 Spectrum Analyzer Market, By Network Technology, 2013–2022 (USD Million)
Table 38 Wired Spectrum Analyzer Market, By Type, 2013–2022 (USD Million)
Table 39 Wireless Spectrum Analyzer Market, By Type, 2013–2022 (USD Million)
Table 40 Spectrum Analyzer Market, By End-User Industry, 2013–2022 (USD Million)
Table 41 Spectrum Analyzer Market for Automotive & Transportation End-User Industry, By Type, 2013–2022 (USD Million)
Table 42 Spectrum Analyzer Market for Automotive & Transportation End-User Industry, By Frequency Range, 2013–2022 (USD Million)
Table 43 Spectrum Analyzer Market for Automotive & Transportation End-User Industry, By Form Factor, 2013–2022 (USD Million)
Table 44 Spectrum Analyzer Market for Automotive & Transportation End-User Industry, By Region, 2013–2022 (USD Thousand)
Table 45 Spectrum Analyzer Market for A&D End-User Industry, By Type, 2013–2022 (USD Million)
Table 46 Spectrum Analyzer Market for A&D End-User Industry, By Frequency Range, 2013–2022 (USD Million)
Table 47 Spectrum Analyzer Market for A&D End-User Industry, By Form Factor, 2013–2022 (USD Million)
Table 48 Spectrum Analyzer Market for A&D End-User Industry, By Region, 2013–2022 (USD Million)
Table 49 Spectrum Analyzer Market for IT & Telecommunication End-User Industry, By Type, 2013–2022 (USD Million)
Table 50 Spectrum Analyzer Market for IT & Telecommunication End-User Industry, By Frequency Range, 2013–2022 (USD Million)
Table 51 Spectrum Analyzer Market for IT & Telecommunication End-User Industry, By Form Factor, 2013–2022 (USD Million)
Table 52 Spectrum Analyzer Market for IT & Telecommunication End-User Industry, By Region, 2013–2022 (USD Million)
Table 53 Spectrum Analyzer Market for Medical & Healthcare End-User Industry, By Type, 2013–2022 (USD Million)
Table 54 Spectrum Analyzer Market for Medical & Healthcare End-User Industry, By Frequency Range, 2013–2022 (USD Thousand)
Table 55 Spectrum Analyzer Market for Medical & Healthcare End-User Industry, By Form Factor, 2013–2022 (USD Million)
Table 56 Spectrum Analyzer Market for Medical & Healthcare End-User Industry, By Region, 2013–2022 (USD Thousand)
Table 57 Spectrum Analyzer Market for Semiconductors & Electronics End-User Industry, By Type, 2013–2022 (USD Million)
Table 58 Spectrum Analyzer Market for Semiconductors & Electronics End-User Industry, By Frequency Range, 2013–2022 (USD Million)
Table 59 Spectrum Analyzer Market for Semiconductors & Electronics End-User Industry, By Form Factor, 2013–2022 (USD Million)
Table 60 Spectrum Analyzer Market for Semiconductors & Electronics End-User Industry, By Region, 2013–2022 (USD Million)
Table 61 Spectrum Analyzer Market for Industrial & Energy End-User Industry, By Type, 2013–2022 (USD Million)
Table 62 Spectrum Analyzer Market for Industrial & Energy End-User Industry, By Frequency Range, 2013–2022 (USD Million)
Table 63 Spectrum Analyzer Market for Industrial & Energy End-User Industry, By Form Factor, 2013–2022 (USD Million)
Table 64 Spectrum Analyzer Market for Industrial & Energy End-User Industry, By Region, 2013–2022 (USD Million)
Table 65 Spectrum Analyzer Market for Other End-User Industries, By Type, 2013–2022 (USD Thousand)
Table 66 Spectrum Analyzer Market for Other End-User Industries, By Frequency Range, 2013–2022 (USD Thousand)
Table 67 Spectrum Analyzer Market for Other End-User Industries, By Form Factor, 2013–2022 (USD Thousand)
Table 68 Spectrum Analyzer Market for Other End-User Industries, By Region, 2013–2022 (USD Thousand)
Table 69 Spectrum Analyzer Market, By Region, 2013–2022 (USD Million)
Table 70 Spectrum Analyzer Market in North America, By Country, 2013–2022 (USD Million)
Table 71 Spectrum Analyzer Market in North America, By End-User Industry, 2013–2022 (USD Million)
Table 72 Spectrum Analyzer Market in North America, By Type, 2013–2022 (USD Million)
Table 73 Spectrum Analyzer Market in Europe, By Country, 2013–2022 (USD Million)
Table 74 Spectrum Analyzer Market in Europe, By End-User Industry, 2013–2022 (USD Million)
Table 75 Spectrum Analyzer Market in Europe, By Type, 2013–2022 (USD Million)
Table 76 Spectrum Analyzer Market in APAC, By Country, 2013–2022 (USD Million)
Table 77 Spectrum Analyzer Market in APAC, By End-User Industry, 2013–2022 (USD Million)
Table 78 Spectrum Analyzer Market in APAC, By Type, 2013–2022 (USD Million)
Table 79 Spectrum Analyzer Market in RoW, By Region, 2013–2022 (USD Million)
Table 80 Spectrum Analyzer Market in RoW, By End-User Industry, 2013–2022 (USD Thousand)
Table 81 Spectrum Analyzer Market in RoW, By Type, 2013–2022 (USD Million)
Table 82 Companies Segment Revenue of Major Players, (2013–2015) USD Billion
Table 83 Top 5 Players in the Spectrum Analyzer Market, 2015
Table 84 New Product Developments (2011–2016)
Table 85 Partnerships, Agreements, Contracts, and Collaborations (2013–2016)
Table 86 Mergers & Acquisitions (2011–2016 )
Table 87 Other Developments (2016)
List of Figures (77 Figures)
Figure 1 Market Segmentation
Figure 2 Spectrum Analyzer Market: Research Design
Figure 3 Data Triangulation
Figure 4 Process Flow of Market Size Estimation
Figure 5 Snapshot of Spectrum Analyzer Market, By Offering (2013–2022)
Figure 6 Medical & Healthcare End-User Industry Estimated to Witness the Highest Growth Rate Between 2016 and 2022
Figure 7 Swept-Tuned Spectrum Analyzer Expected to Hold A Major Market Share Between 2016 and 2022
Figure 8 North America Led the Spectrum Analyzer Market in 2015
Figure 9 Spectrum Analyzer Market Expected to Grow at A Siginificant Rate Between 2016 and 2022
Figure 10 Software Market to Grow at the Highest Rate Between 2016 and 2022
Figure 11 Swept-Tuned Spectrum Analyzer Expected to Hold the Major Market Size Between 2016 and 2022
Figure 12 Market for <6 GHz Expected to Hold the Lagest Market Size in 2016
Figure 13 Benchtop Spectrum Analyzer Expected to Hold A Major Market Share Between 2013 and 2022
Figure 14 APAC Spectrum Analyzer Market Expected to Surpass the North American Market in 2016
Figure 15 U.S. Expected to Hold the Largest Share of the Spectrum Analyzer Market in 2016
Figure 16 The Market in North America and APAC is in the Growth Stage in the Spectrum Analyzer Market Between 2016 and 2022
Figure 17 Growth in Demand for Spectrum Analyzers With Multi-Tasking Capabilities Expected to Propel the Growth of the Spectrum Analyzer Market
Figure 18 Cable Modems: Increasing Bandwidth Between 1982 and 2016
Figure 19 Value Chain Analysis of the Spectrum Analyzer Market (2015)
Figure 20 Overview of Porter’s Five Forces Analysis of Spectrum Analyzer Market (2015)
Figure 21 Spectrum Analyzer Market: Porter’s Five Forces Analysis (2015)
Figure 22 Spectrum Analyzer Market: Threat of New Entrants
Figure 23 Spectrum Analyzer Market: Bargaining Power of Suppliers
Figure 24 Spectrum Analyzer Market: Bargaining Power of Buyers
Figure 25 Spectrum Analyzer Market: Intensity of Competitive Rivalry
Figure 26 Product Offering to Hold the Larger Market Size Between 2016 and 2022
Figure 27 Real-Time Spectrum Analyzer to Grow at the Highest Rate Between 2016 and 2022
Figure 28 IT & Telecommunication End-User Industry to Hold A Major Share of the Swept-Tuned Spectrum Analyzer Market Till 2022 (USD Million)
Figure 29 Portable Spectrum Analyzer to Grow at the Highest Rate Between 2016 and 2022
Figure 30 APAC and North America to Be the Top Two Markets for Swept-Tuned Spectrum Analyzer in 2016
Figure 31 Vector Signal Spectrum Analyzer With <6 GHz Frequency Range to Hold A Major Market Share Between 2016 and 2022
Figure 32 APAC to Grow at the Highest Rate in the Vector Signal Spectrum Analyzer Market Between 2016 and 2022
Figure 33 IT & Telecommunication End-User Industry to Hold A Major Market Size of the Real-Time Spectrum Analyzer Market Till 2022
Figure 34 Market for >18 GHz Frequency Range to Grow at the Highest Rate in the Spectrum Analyzer Market Between 2016 and 2022
Figure 35 Real-Time Spectrum Analyzer to Witness the Highest Growth Rate Between 2016 and 2022
Figure 36 IT & Telecommunication End-User Industry to Hold A Major Market Size for >18 GHz Frequency Range Between 2016 and 2022
Figure 37 Portable Spectrum Analyzer to Grow at the Highest Rate in the Spectrum Analyzer Market Between 2016 and 2022
Figure 38 Real-Time Spectrum Analyzer to Grow at the Highest Rate in the Handheld Spectrum Analyzer Market Between 2016 and 2022
Figure 39 IT & Telecommunication to Hold A Major Market Size in the Portable Spectrum Analyzer Market Between 2016 and 2022
Figure 40 Swept-Tuned Spectrum Analyzer to Hold A Major Share of the Benchtop Spectrum Analyzer Market in 2016
Figure 41 Wireless Network Technology to Witness the Highest Growth Rate in the Spectrum Analyzer Market Between 2016 and 2022
Figure 42 Medical & Healthcare End-User Industry to Witness the Highest Growth Rate in the Spectrum Analyzer Market Between 2016 and 2022
Figure 43 Spectrum Analyzer With <6 GHz Frequency Range to Lead the Market for the Automotive & Transportation End-User Industry Between 2016 and 2022
Figure 44 Portable Spectrum Analyzer to Grow at the Highest Rate in the Automotive & Transportation Industry Between 2016 and 2022
Figure 45 Spectrum Analyzer Market in >18 GHz Frequency Range to Grow at the Highest Rate in the A&D End-User Industry Between 2016 and 2022
Figure 46 North America and APAC to Be the Top Two Markets for A&D End-User Industry Till 2022
Figure 47 Spectrum Analyzer With Frequency Range <6 GHz to Hold the Major Share of the Market for IT & Telecommunication End-User Industry Till 2022
Figure 48 Real-Time Spectrum Analyzer to Witness the Highest Growth Rate in the Medical & Healthcare End-User Industry Between 2016 and 2022
Figure 49 North America to Grow at the Highest Rate in the Medical & Healthcare End-User Industry Between 2016 and 2022
Figure 50 Spectrum Analyzer With Frequency Range of <6 GHz to Lead the Market for the Semiconductors & Electronics End-User Industry Between 2016 and 2022
Figure 51 APAC to Grow at the Highest Rate in the Semiconductors & Electronics End-User Industry Between 2016 and 2022
Figure 52 North America to Hold A Major Share of the Industrial & Energy Sector Between 2016 and 2022
Figure 53 Portable Spectrum Analyzer Market to Grow at the Highest Rate Between 2016 and 2022
Figure 54 Geographic Snapshot of Spectrum Analyzer Market (2016–2022)
Figure 55 North American Market Snapshot
Figure 56 IT & Telecommunication to Lead the Spectrum Analyzer Market in North America Between 2016 and 2022 (USD Million)
Figure 57 APAC Market Snapshot
Figure 58 IT & Telecommunication to Lead the Spectrum Analyzer Market in RoW Between 2016 and 2022 (USD Thousand)
Figure 59 Companies Adopted New Product Developments as the Key Growth Strategy Between 2013 and 2016
Figure 60 Advantest Corporation Registered the Highest Growth Rate in Terms of Segment Revenue Between 2013 and 2015
Figure 61 Market Evolution Framework — New Product Developments as the Major Strategy Adopted By Key Players (2013–2016)
Figure 62 Battle for Market Ranking: New Product Developments as the Key Growth Strategy
Figure 63 Geographic Revenue Mix of the Major Market Players (2015)
Figure 64 Keysight Technologies: Company Snapshot
Figure 65 Keysight Technologies: SWOT Analysis
Figure 66 Rohde & Schwarz GmbH & Co., Kg.: Company Snapshot
Figure 67 Rohde & Schwarz GmbH & Co., Kg.: SWOT Analysis
Figure 68 Fortive Corporation: Company Snapshot
Figure 69 Fortive Corporation: SWOT Analysis
Figure 70 Anritsu Corporation: Company Snapshot
Figure 71 Anritsu Corporation: SWOT Analysis
Figure 72 Advantest Corporation: Company Snapshot
Figure 73 Advantest Corporation: SWOT Analysis
Figure 74 Cobham PLC : Company Snapshot
Figure 75 Giga-Tronics Incorporated: Company Snapshot
Figure 76 Yokogawa Electric Corporation: Company Snapshot
Figure 77 National Instruments Corporation: Company Snapshot
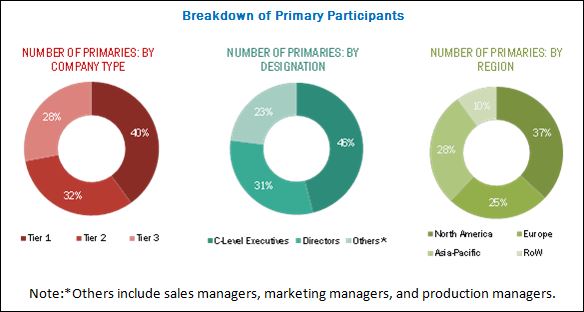
During this research study, major players of the spectrum analyzer ecosystem in various regions have been identified and their offerings, regional presence, and distribution channels have been understood through in-depth discussions. To find the overall market size, top-down and bottom-up approaches have been used to estimate the sizes of other individual markets by using percentage splits from secondary sources (such as Hoovers, Bloomberg BusinessWeek, Factiva, and OneSource) and primary research. The entire procedure includes the study of the annual and financial reports of the top market players and extensive interviews of industry leaders such as CEOs, VPs, directors, and marketing executives for key insights (both qualitative and quantitative) pertaining to the market. The figure below shows the breakdown of the primaries on the basis of the company type, designation, and region.
To know about the assumptions considered for the study, download the pdf brochure
The spectrum analyzer ecosystem comprises spectrum analyzer manufacturers who look after different phases in the value chain such as R&D, manufacturing, distribution, and post-sales services. Companies such as Keysight Technologies (U.S.), Rohde & Schwarz GmbH & Co., Kg. (Germany), Fortive Corporation (U.S.), Anritsu Corporation (Japan), Advantest Corporation (Japan), Cobham PLC (U.K.), Giga-tronics Incorporated (U.S.), Yokogawa Electric Corporation (Japan), National Instruments Corporation (U.S.), LP Technologies Inc. (U.S.), Teledyne LeCroy (U.S.), Avcom of Virginia Inc. (U.S.), B&K Precision Corporation (U.S.), and Stanford Research Systems, Inc. (U.S.), among others are the major players in the studied market.
Key Target Audience
- Semiconductor companies
- Consumer electronics manufacturers
- Telecommunication original device manufacturers (ODMs)
- Technology solution providers
- Original equipment manufacturers (OEMs)
- Universities and research organizations
- Technology investors
- Government bodies
The study answers several questions for the target audiences, primarily which market segments to focus on in the next two to five years for prioritizing efforts and investments.
Scope of the Report
In the research report, the spectrum analyzer market is segmented into the following submarkets:
By Offering:
- Product (Type, Frequency Range, Form Factor)
- Software (Apps and OS)
By Type:
- Swept-Tuned Spectrum Analyzer
- RF Tuning Method
- Super Heterodyne
- Vector Signal Spectrum Analyzer
- Real-Time Spectrum Analyzer
- Fast Fourier Transform (FFT)
- Parallel Filter Analyzer
By Frequency Range:
- <6 GHz
- 6 GHz–18 GHz
- >18 GHz
By Form Factor:
- Handheld Spectrum Analyzer
- Portable Spectrum Analyzer
- Benchtop Spectrum Analyzer
By Network Technology:
- Wired
- Wireless
By End-User Industry:
- Automotive & Transportation
- A&D
- IT & Telecommunication
- Medical & Healthcare
- Semiconductors & Electronics
- Industrial & Energy
- Others (Educational Institutes and Government Sector)
By Region:
- North America
- Europe
- Asia-Pacific (APAC)
- Rest of the World (RoW) (South America and Middle East & Africa)
Available Customizations
With the given market data, MarketsandMarkets offers customizations according to the company’s specific needs. The following customization options are available for the report:
Submarkets Analysis
- Market size for 2017, 2019, and 2021 for segments such as offering, type, frequency range, form factor, network technology, end-user industry, and geography.
- Unit shipment of global spectrum analyzer market.
Company Information
- Detailed analysis and profiling of additional market players (up to five)












Growth opportunities and latent adjacency in Spectrum Analyzer Market