
Superconducting Wire Market

Superconducting Wire Market by Type (Low-temperature Superconductor, Medium-temperature Superconductor, High-temperature Superconductor), Application (Magnetic Resonance Imaging, Power Grid Infrastructure, Superconducting Fault Current Limiter, Maglev), End User (Energy, Medical, Transportation, Research, and Others), Sales Channel, and Region - Global Forecast to 2030


OVERVIEW
Source: Secondary Research, Interviews with Experts, MarketsandMarkets Analysis
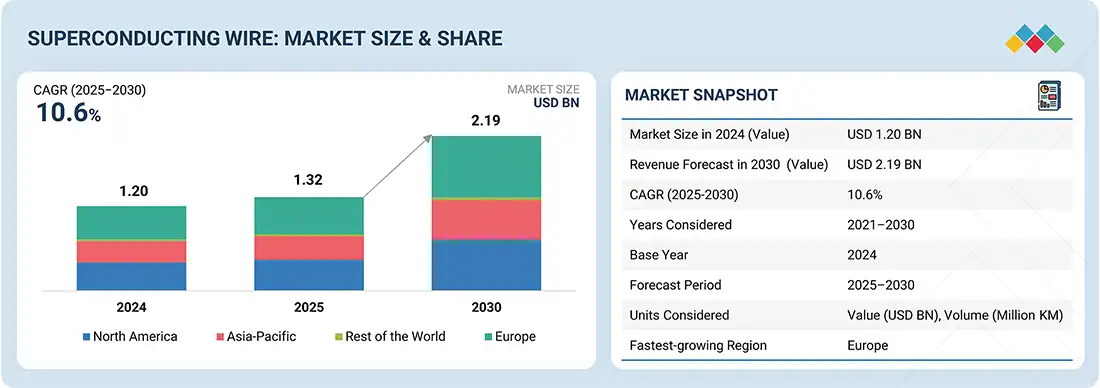
The global superconducting wire market is projected to reach USD 2.19 billion by 2030 from USD 1.32 billion in 2025, at a CAGR of 10.6%. Superconducting wire is in high demand because it allows nearly zero resistance in transmitting electricity, which enables efficient power transfer and energy saving. The demand is also driven by the growth of renewable energy integration, smart grids, and the electrification of power infrastructure. Additionally, developments in medical imaging (MRI), fusion energy, and transportation (maglev trains) contribute to market growth. Further expansion in industrial applications is fueled by innovations in material science and government support.
Superconducting Wire Market Size and Forecast:
- Market Size Value in 2024: USD 1.20 Billion
- Market Size Value in 2025: USD 1.32 Billion
- Revenue Forecast in 2030: USD 2.19 Billion
- Growth Rate: CAGR of 10.6% from 2025 to 2030
- Data available from 2021 to 2030
- The low-temperature superconductor (LTS) segment holds the largest market share due to its established use in MRI systems, research facilities, and high-field magnet applications.
Key Market Trends and Insights
- Market Growth: Driven by increasing demand for energy-efficient power transmission, expanding adoption of MRI systems, and growing investments in advanced superconducting technologies.
- Growing Trends: The use of superconducting wires in fusion energy projects, smart grids, offshore wind applications, and maglev transportation systems is gaining significant momentum worldwide.
- Growth Opportunities: Rising investments in hydrogen and clean energy infrastructure, expansion of superconducting fault current limiters, and advancements in high-temperature superconducting materials are creating substantial market opportunities.
- Market Share Analysis: The low-temperature superconductor (LTS) segment accounts for the largest market share in 2025 due to its widespread deployment in medical imaging and scientific research applications, while the energy segment is expected to witness the fastest growth during the forecast period.
KEY TAKEAWAYS
-
BY PRODUCT TYPEThe superconducting market by product type includes low temperature superconductors, medium temperature superconductors, and high temperature superconductors. Low temperature superconductors lead due to their proven reliability, established manufacturing processes, and dominant use in key applications like MRI and scientific research.
-
BY END USERThe end users include medical, energy, transportation, research, and other end users. Medical end users lead because MRI systems are the major consumers of superconducting wire. They rely heavily on superconducting magnets for high imaging precision.
-
BY APPLICATIONThe application includes magnetic resonance imaging, power grid infrastructure, superconducting fault current limiters, Maglev and others. Power grid infrastructure applications lead as utilities increasingly adopt superconducting wires to enhance grid efficiency, reduce transmission losses, and support modernization efforts.
-
BY SALES CHANNELThe sales channel includes direct and indirect. The direct sales channel leads because strong supplier-customer relationships and custom technical support are critical for high-value, specialized superconducting wire solutions.
-
BY REGIONEurope is leading the superconducting wire market due to its strong R&D ecosystem, advanced scientific research infrastructure, and substantial government support for projects such as fusion energy (ITER). European countries prioritize renewable energy integration and power grid modernization, driving demand for efficient superconducting wires.
-
COMPETITIVE LANDSCAPEThe market players are using both organic and inorganic strategies such as partnerships and investments to strengthen their positions. Companies such as THEVA Dünnschichttechnik GmbH and ASG Superconductors S.p.A have formed collaborations to meet the rising demand for superconducting wire in innovative applications.
The demand for superconducting wire is likely to grow exponentially over the next decade as the world increasingly focuses on energy-efficient systems and renewable energy sources. Superconducting wires allow almost zero electrical resistance and significantly reduce energy loss in power transmission, which is crucial for modernizing old power grids and supporting smart grid infrastructure. Additionally, advances in high-temperature superconductors and cryogenics are lowering operational costs and boosting applications in medical imaging (MRI), quantum computing, fusion reactors, and electric transportation such as maglev trains. Growing investments in research, development, and renewable energy projects are major drivers fueling this market's growth.
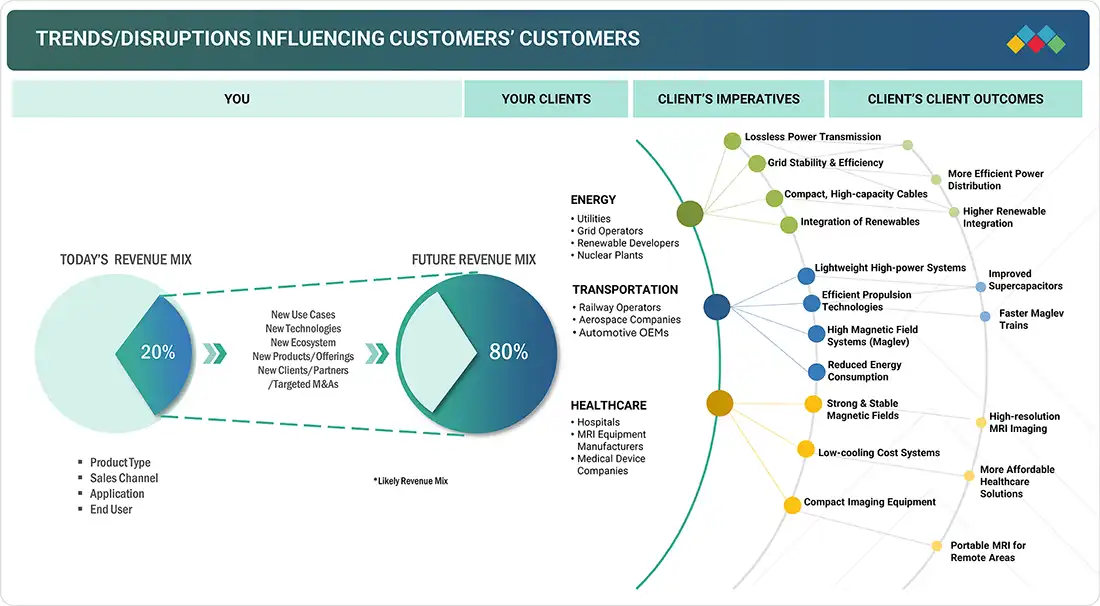
TRENDS & DISRUPTIONS IMPACTING CUSTOMERS' CUSTOMERS
The rise in investments in nuclear fusion projects will likely increase the demand for superconducting wires because they help reduce energy losses. Furthermore, emerging growth opportunities are expected to arise from the increasing demand for superconducting MRI systems along with growth in nuclear energy. Companies are working to develop cost-effective technologies for manufacturing superconducting wires without compromising their conductivity properties.
Source: Secondary Research, Interviews with Experts, MarketsandMarkets Analysis
MARKET DYNAMICS
Level
-
Growing need for advanced MRI systems globally

-
Cost and performance advantages of superconducting wires over conventional wires

Level
-
Cost constraints hampering superconducting adoption in low-voltage and medium-voltage applications

-
Slow rate of commercialization due to lack of skilled workforce

Level
-
Increased R&D activities in medical and transportation sectors

Level
-
High manufacturing costs of superconductors

-
Limited testing infrastructure

Source: Secondary Research, Interviews with Experts, MarketsandMarkets Analysis
Drivers: Growing need for advanced MRI systems globally
Magnetic resonance imaging (MRI) is a non-invasive diagnostic technique that employs magnetic and electromagnetic fields to generate detailed internal images of the human body. The method operates by stimulating hydrogen atoms within the body, detecting their response, and translating the signals into anatomical images via computer processing. As the global population ages, the demand for MRI-based diagnostics is rising, particularly for early detection and treatment of various medical conditions. MRI systems rely on superconducting magnets and radio frequencies to produce high-resolution images for medical analysis. Low-temperature superconductors, such as niobium-titanium (NbTi) wires, are commonly used in MRI systems due to their cost-effectiveness, dependability, and stable performance under cryogenic conditions.
Restraint: Cost constraints hampering superconducting adoption in low-voltage and medium-voltage applications
Superconducting systems always require continuous and precise cooling to maintain their superconducting state, usually at cryogenic temperatures. This reliance on low temperatures significantly increases operational costs, which can limit their economic viability, especially in cost-sensitive applications. Cryogenic cooling typically uses either liquid helium or liquid nitrogen, both of which require specialized storage, delivery, and recirculation systems to keep temperatures below certain thresholds. The supporting systems—such as compressors, heat exchangers, insulation, and safety controls—also demand high initial investments and incur ongoing operational and maintenance expenses.
Opportunities: Increased R&D activities in medical and transportation sectors
The rising demand for energy-efficient solutions has spurred increased research and development in the medical and transportation sectors, both of which depend heavily on superconducting wires. In medicine, MRI systems that use low-temperature superconductors like niobium-titanium (NbTi) incorporate superconducting wires to create high-field magnets that produce detailed images. By 2025, Bruker and Oxford Instruments reported a 15% increase in installations of HTS-based MRI systems, which can reduce helium consumption by 20% and lower operational costs by up to USD 10,000 per system each year. This shift also helps address the global helium shortage. In nuclear magnetic resonance (NMR), superconducting magnets consume less power and generate stronger magnetic fields compared to permanent magnets, advancing their applications in medicine, chemistry, and pharmaceuticals. The NMR market is expanding worldwide, with Japanese companies like Fujikura providing rare-earth-based tapes for these systems. Superconductors have also played a significant role in transportation, making ship propulsion systems smaller and more flexible, which reduces a ship’s weight and improves efficiency. Cables made with superconducting material (HTS) can also increase power densities in ships and military vessels. In January 2022, American Superconductor delivered an HTS-based ship protection system to the US Navy, marking a major milestone. HTS wires are also used in maglev trains and subways to enable faster speeds and accommodate more passengers, as seen with projects like the Shanghai Maglev and the Tokyo-Nagoya line, both of which are superconducting-based. Additionally, superconducting wires are used in the electric vehicle (EV) sector to develop lighter, more efficient motors with longer range. For example, Airbus announced its prototype of an EV using HTS in 2024, featuring a motor designed to save 12% in fuel.r
Challenges: High manufacturing costs of superconductors
Superconducting systems have significant barriers to large-scale adoption because of their expensive production. Superconducting wires involve sophisticated materials such as rare earth and high-purity metal, which are costly and of limited supply, contributing to price fluctuations. It is technically challenging in its manufacturing process, usually involving precision techniques like Powder-in-Tube (PIT), which also increases costs. Out of material and processing cost, there is an additional cost of keeping the material in a superconducting state at ultra-low temperature, as well as the fact that liquid helium, which is essential in cooling low-temperature superconductors, saw its price rise by about 10 percent a year as of 2025. These increasing prices put enormous obstacles in popularizing superconducting technology, especially in cost-sensitive systems such as urban power distribution and transportation, where more affordable conventional systems remain available.
Superconducting Wire Market: COMMERCIAL USE CASES ACROSS INDUSTRIES
| COMPANY | USE CASE DESCRIPTION | BENEFITS |
|---|---|---|
 |
Supplies superconducting wire and magnet systems for particle accelerators and research facilities (e.g., CERN, fusion projects) | Enables high-field research magnets, supports compact accelerator designs, advances nuclear fusion research |
 |
Collaborates on superconducting wire integration in naval propulsion and defense systems | Higher energy efficiency, reduced acoustic signature, compact shipboard power systems |
 |
Deploys superconducting wire for ship propulsion motors and advanced power systems | Significant weight reduction, improved efficiency, silent operation, higher power density for naval vessels |
 |
Pilots superconducting cable projects for grid reliability and urban power delivery | Enhances grid stability, reduces transmission losses, supports renewable energy integration |
Logos and trademarks shown above are the property of their respective owners. Their use here is for informational and illustrative purposes only.
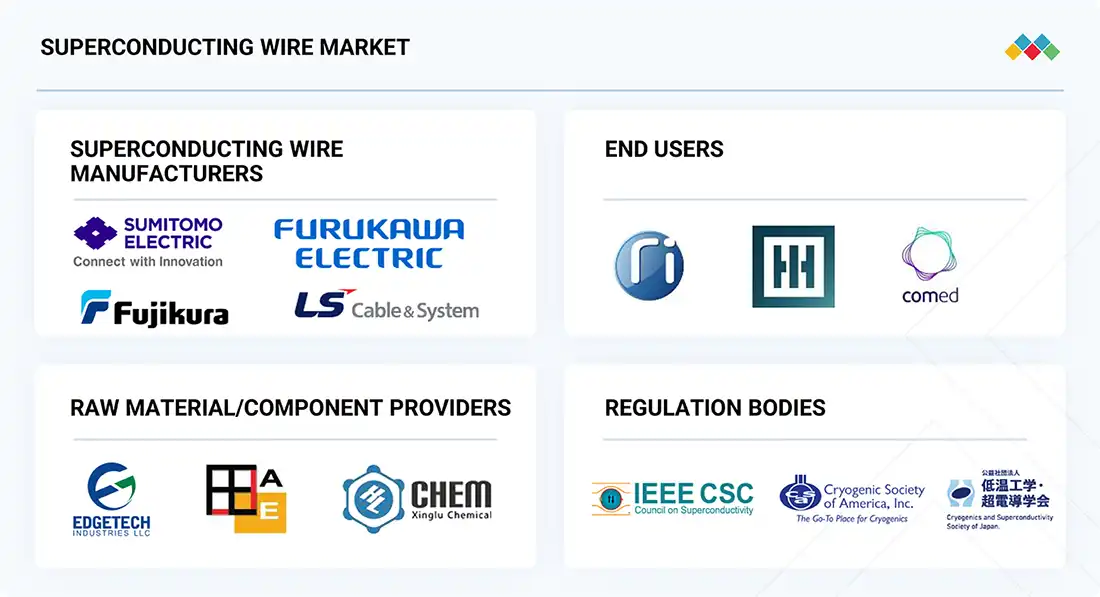
MARKET ECOSYSTEM
The superconducting wire market ecosystem includes various key participants such as raw material suppliers, manufacturers, distributors, end users, and regulatory bodies or standards organizations. The main end users of superconducting wires are found in the energy, medical, transportation, and automotive sectors. This list is not exhaustive but is provided to illustrate the primary players involved in the market.
Logos and trademarks shown above are the property of their respective owners. Their use here is for informational and illustrative purposes only.
MARKET SEGMENTS
Source: Secondary Research, Interviews with Experts, MarketsandMarkets Analysis
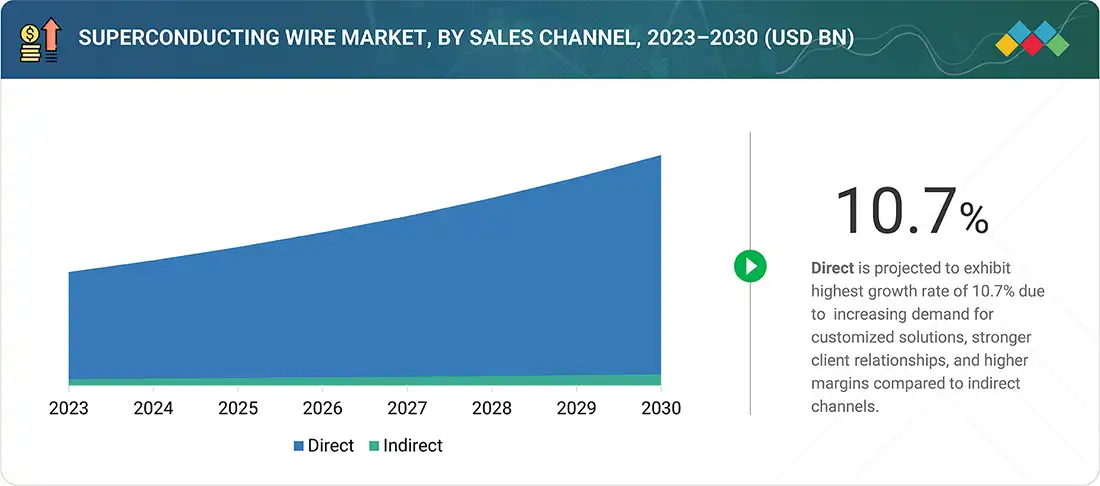
Superconducting Wire Market, By Sales Channel
The sales channels for superconducting wire are divided into direct and indirect options. The direct channels help manufacturers build strong relationships with end users, especially in industries like energy and healthcare where customized solutions can be made based on application needs. Indirect channels involve intermediaries and are more common for reaching a larger market.
Superconducting Wire Market, By Type
The superconducting wire market is categorized by type into low-temperature superconducting (LTS) wires, medium-temperature superconducting (MTS) wires, and high-temperature superconducting (HTS) wires. LTS wires currently dominate the market because of their proven use in MRI systems, scientific research, and industrial equipment. MTS wires are becoming more popular as an intermediate option, providing lower cooling costs for applications such as transformers and energy storage. HTS wires, which operate at higher temperatures with liquid nitrogen cooling, are revolutionizing the market by enabling advanced applications in smart grids, energy-efficient motors, wind turbines, and fusion reactors.
Superconducting Wire Market, By End User
The end-user segments for superconducting wires include medical, energy, research, transportation, and others. Superconducting wires are known for their breakthroughs in electrical conductivity because they exhibit zero resistance when cooled to a certain critical temperature. These wires are used in advanced technologies across energy, healthcare, transportation, and research, surpassing traditional conductors in enhancing efficiency, reliability, and innovation. They are applied in the medical field, such as magnetic resonance imaging (MRI) equipment, and in the transportation industry, like high-speed Maglev trains. Each sector leverages the unique properties of superconducting wires to address specific technical challenges they face. Ongoing technological advances continue to drive innovation, aiming to meet evolving needs and deliver high-performance solutions across these industries.
Superconducting Wire Market, By Application
The application segment includes magnetic resonance imaging, power grid infrastructure, superconducting fault current limiters, Maglev, and others. The high costs of producing superconducting systems pose a major challenge to their adoption. Manufacturing superconducting wires involves using complex, expensive, and rare materials like rare-earth elements and high-purity metals, leading to price fluctuations. The process is also technically difficult and often requires precision techniques such as Powder-in-Tube (PIT), which increases costs. Besides material and processing expenses, superconductivity at ultra-low temperatures adds further costs, especially because liquid helium, essential for cooling low-temperature superconductors, is expensive. These rising prices significantly hinder the wider use of superconducting technologies, especially in price-sensitive markets like urban power distribution and transportation, where more affordable options are still available.
REGION
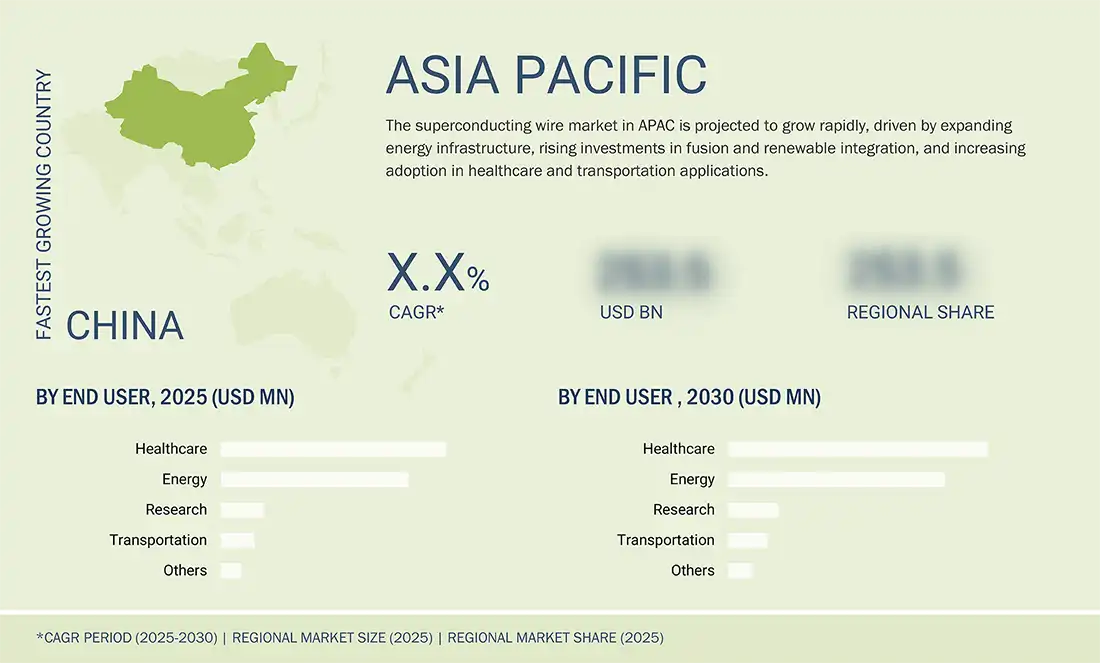
Asia Pacific to be fastest-growing region in global superconducting wire market during forecast period
The Asia Pacific is the fastest-growing market in the superconducting wire industry for several reasons. Increasing demand is driven by rapid urbanization, rising disposable incomes, and strict energy efficiency laws in China, Japan, South Korea, and India. Growth is supported by major investments in modernizing energy infrastructure, integrating renewable energy, and developing transportation systems. The region leads in research and development spending on high-temperature superconductors, boosted by government programs such as China's "Made in China 2025" and Japan's "Green Growth Strategy." Additionally, a strong semiconductor and material supply chain accelerates domestic production, leading to swift market development.
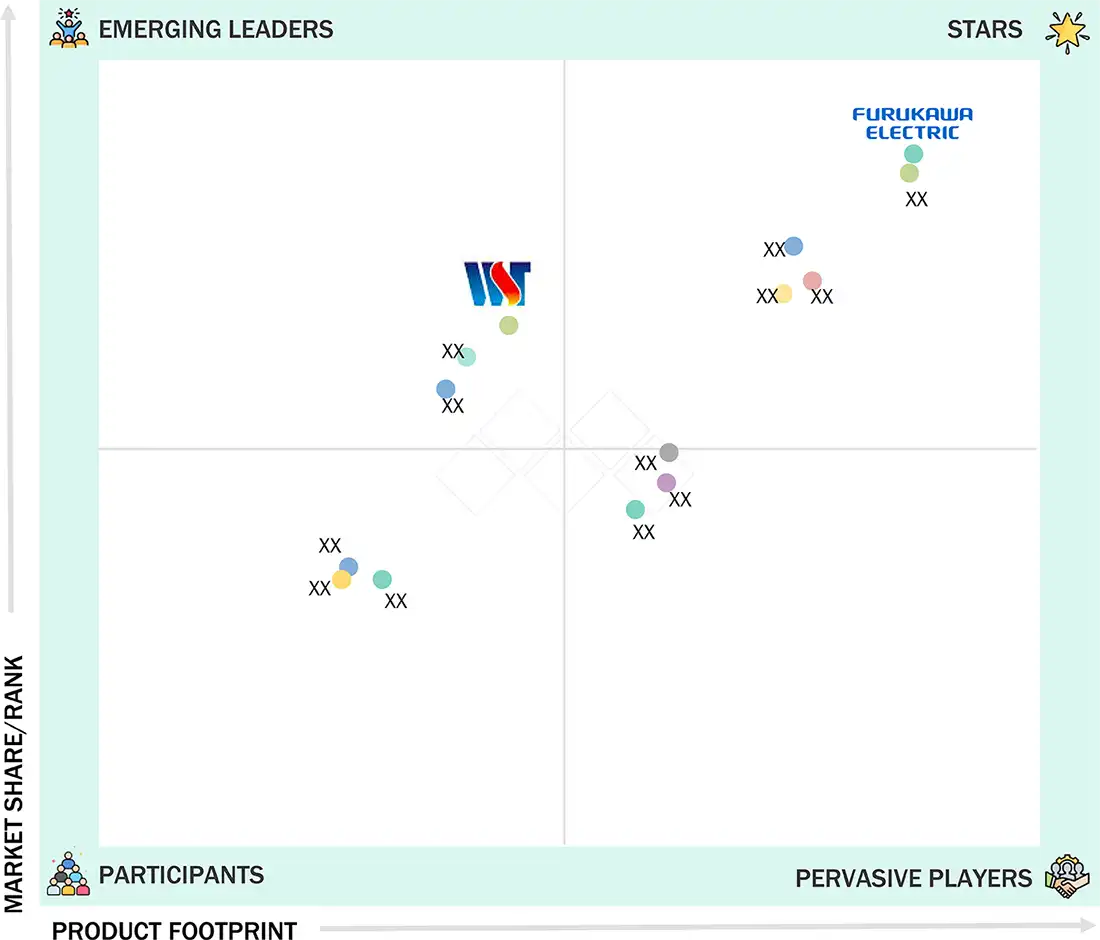
Superconducting Wire Market: COMPANY EVALUATION MATRIX
In the superconducting wire market matrix, Bruker stands out as a leader due to its strong market presence and extensive product portfolio, which supports large-scale adoption across industries such as energy and healthcare. Fujikara Ltd., identified as an emerging leader, is gaining traction with its solutions used in energy and research. Although Furukawa Electric Co., Ltd. currently holds an advantage because of its broad portfolio and shows robust growth potential, it could move into the leaders' quadrant with further advancements.
Source: Secondary Research, Interviews with Experts, MarketsandMarkets Analysis
KEY MARKET PLAYERS
MARKET SCOPE
| REPORT METRIC | DETAILS |
|---|---|
| Market Size in 2024 (Value) | USD 1.20 Billion |
| Market Forecast in 2030 (value) | USD 2.19 Billion |
| Growth Rate | CAGR of 10.6% from 2025-2030 |
| Years Considered | 2021-2030 |
| Base Year | 2024 |
| Forecast Period | 2030 |
| Units Considered | Value (USD Thousand), Volume (KM) |
| Report Coverage | Revenue forecast, company ranking, competitive landscape, growth factors and trends |
| Segments Covered | By Product Type: Low temperature superconductors, medium temperature superconductors, high temperature superconductors By End User: Medical, energy, transportation, research, others By Application: Magnetic resonance imaging, power grid infrastructure, su |
| Regions Covered | Asia Pacific, Europe, North America and Rest of the World |
WHAT IS IN IT FOR YOU: Superconducting Wire Market REPORT CONTENT GUIDE
DELIVERED CUSTOMIZATIONS
We have successfully delivered the following deep-dive customizations:
| CLIENT REQUEST | CUSTOMIZATION DELIVERED | VALUE ADDS |
|---|---|---|
| Superconducting wire global analysis by application | Global market size provided based on the products having application of superconducting technologies (Such as Transformers, Generators, MRI, Fault Current Limiters, Superconducting Magnetic Energy Storage, etc.) which included the usage of Superconducting material and different types of superconductors (LTS,HTS). |
|
RECENT DEVELOPMENTS
- December 2024 : THEVA Dünnschichttechnik GmbH (Germany) collaborated with the Max-Planck-Institute for Plasma Physics (IPP) and the Technical University of Munich’s Forschungs-Neutronenquelle Heinz Maier-Leibnitz (FRM II), launching the HTS4Fusion project to advance high-temperature superconductor (HTS) innovations for fusion technology..
- October 2024 : ASG Superconductors S.p.A. (Italy) collaborated with INFN (Istituto Nazionale di Fisica Nucleare) (Italy) under the IRIS project funded by Italy's PNRR to develop a 1 GW high-temperature superconducting cable using magnesium di-boride (MgB2) technology, aiming to boost environmental sustainability and energy efficiency while advancing Italy's leadership in superconducting technology through CERN-tested solutions focused on real-world power applications with accessible cryogenic cooling.
- December 2024 : American Superconductor (US) signed a sales contract with Huntington Ingalls Industries (US) for the supply of an HTS-based ship protection system and a degaussing system, utilizing the company's high-temperature superconductor (HTS) cables, to be installed on the San Antonio-class amphibious transport dock ship, LPD-32.
- January 2022 : American Superconductor (US) completed delivery of its HTS-based ship protection system for deployment on the San Antonio-class amphibious transport dock ship, USS Fort Lauderdale (LPD-28), for the US Navy (US).
Table of Contents
 Exclusive indicates content/data unique to MarketsandMarkets and not available with any competitors.
Methodology
The study involved major activities in estimating the current size of the superconducting wire market. Exhaustive secondary research was done to collect information on the peer and parent markets. The next step was to validate these findings, assumptions, and sizing with industry experts across the value chain through primary research. Both top-down and bottom-up approaches were employed to estimate the complete market size. Thereafter, market breakdown and data triangulation were used to estimate the market size of the segments and subsegments.
Secondary Research
Secondary sources for this research study include annual reports, press releases, and investor presentations of companies; white papers; certified publications; articles from recognized authors; and databases of various companies and associations. Secondary research was mainly used to obtain key information about the industry’s supply chain, monetary chain, the pool of key players, market classification, and segmentation according to industry trends to the bottom-most level, regional markets, and key developments from market- and technology-oriented perspectives.
Primary Research
In the primary research process, various primary sources from both the supply and demand sides were interviewed to obtain qualitative and quantitative information for this report. Primary sources from the supply side include industry experts, such as CEOs, vice presidents, marketing directors, technology & innovation directors, and related key executives from various companies and organizations operating in the superconducting wire market.
In the complete market engineering process, the top-down and bottom-up approaches and several data triangulation methods were used to estimate and forecast the market segments and subsegments listed in this report. Extensive qualitative and quantitative analyses were performed to list key information/insights in the report.

Note: Other designations include sales managers, engineers, and regional managers.
The tiers of the companies are defined based on their total revenue as of 2024: Tier 1: >USD 1 billion, Tier 2: USD 500
million–1 billion, and Tier 3:
To know about the assumptions considered for the study, download the pdf brochure
Market Size Estimation
The top-down and bottom-up approaches were used to estimate and validate the size of the global superconducting wire market and evaluate the sizes of various dependent submarkets. The key players in the market were identified through secondary research, and their shares in the respective regions were determined through primary and secondary research. This entire procedure included studying annual and financial reports of top market players and extensive interviews for key insights with industry leaders such as CEOs, VPs, directors, and marketing executives. All percentage shares, splits, and breakdowns were determined using secondary sources and verified through primary sources. All possible parameters that affect the markets covered in this research study were accounted for, viewed in extensive detail, verified through primary research, and analyzed to get the final quantitative and qualitative data.
Superconducting Wire Market : Top-Down and Bottom-Up Approach

Data Triangulation
After arriving at the overall market size from the estimation process explained below, the total market was split into several segments and subsegments. Wherever applicable, the data triangulation and market breakdown procedures were employed to complete the overall market engineering process and arrive at the exact statistics for all the segments and subsegments. The data was triangulated by studying various factors and trends from both the demand and supply sides.
Market Definition
Superconducting wires are high-performance conductors characterized by zero electrical resistance and the expulsion of magnetic fields (known as the Meissner effect) when cooled below a specific critical temperature. The materials commonly used in these wires include niobium-titanium (NbTi) and niobium-tin (Nb3Sn) for low-temperature superconductors (LTS), as well as rare-earth-based compounds, such as YBCO and Bi-2212, for high-temperature superconductors (HTS). A typical superconducting wire or cable consists of a superconducting filament embedded within a stabilizing matrix—usually copper or silver—with optional insulation or sheathing, depending on the intended application. These wires are manufactured in various forms, including multi-filamentary wires, tapes, or round wires, tailored to meet specific performance requirements.
The production of superconducting wires involves several key processes, including powder-in-tube extrusion, chemical vapor deposition (CVD), pulsed laser deposition (PLD), and rolling-assisted biaxially textured substrates (RABiTS) for high-temperature superconductor (HTS) tapes. These wires are specifically engineered for demanding applications that require minimal energy loss, high current density, and strong magnetic field tolerance. Typical use cases include MRI systems, power transmission cables, superconducting fault current limiters (SFCLs), magnetically levitated (maglev) trains, and particle accelerators.
Stakeholders
- Superconducting magnet and coil system integrators
- Cryogenic equipment and cooling system providers
- Material suppliers (e.g., niobium, yttrium, bismuth, silver, copper)
- Medical imaging equipment manufacturers (e.g., MRI, NMR)
- High-energy physics laboratories and research institutes
- Smart grid and power transmission system integrators
- Maglev transportation and rail system developers
- Fusion energy and particle accelerator project stakeholders (e.g., ITER, CERN)
- Defense and aerospace organizations using superconducting systems
- National and regional energy ministries and regulatory bodies
- Research and development organizations (government and private)
- Academic institutions involved in superconductivity research
- Environmental and energy-efficiency policy advocacy groups
- Engineering, procurement, and construction (EPC) companies
- Testing, inspection, and certification (TIC) service providers
- Standardization bodies (e.g., IEC, IEEE, ASTM)
- Clean technology investment firms and venture capitalists
- Energy utilities and grid operators
- Consulting firms specializing in advanced materials and energy systems
Report Objectives
- To define, describe, segment, and forecast the superconducting wire market based on type, end user, application, sales channel, and region, in terms of value
- To forecast the market size, in terms of volume, at a global level
- To provide detailed information on the major factors influencing the growth of the market (drivers, restraints, opportunities, and challenges)
- To strategically analyze the micromarkets with respect to individual growth trends, future expansions, and the contribution to the market
- To analyze market opportunities for stakeholders and the details of the competitive landscape for market leaders
- To forecast the growth of the superconducting wire market with respect to the main regions—Asia Pacific, Europe, North America, and RoW
- To strategically profile key players and comprehensively analyze their market rankings and core competencies
- To analyze competitive developments in the superconducting wire market, such as agreements, investments & expansions, product launches/developments, and mergers & acquisitions
Available Customizations
MarketsandMarkets offers customizations according to the specific needs of the companies using the given market data.
The following customization options are available for the report:
Product Analysis
- Product matrix, which gives a detailed comparison of the product portfolio of each company
Geographic Analysis as per Feasibility
- Further breakdown of the superconducting wire market, by Europe, Asia Pacific, North America, and Rest of the World
Company Information
- Detailed analysis and profiling of additional market players (up to five)
Key Questions Addressed by the Report
What will the superconducting wire market size be in terms of value in 2025?
The superconducting wire market size will be worth USD 1.32 billion in 2025.
What are the major drivers for the superconducting wire market?
Rising implementation of superconducting wire over conventional wires and the expansion of offshore wind farms using superconducting technologies are the major driving factors for the superconducting wire market.
Which is the largest region during the forecast period in the superconducting wire market?
Europe is expected to dominate the superconducting wire market between 2025 and 2030, followed by North America and Asia Pacific. Increasing investments in nuclear fusion-based research and growing efforts on the decarbonization of the transportation sector, especially in the European region, are driving the market in this region.
Which will be the largest segment, by type, during the forecast period in the superconducting wire market?
The low-temperature superconductor is expected to be the largest market during the forecast period. The growing demand for superconductor-based magnetic resonance imaging (MRI) systems is expected to drive the market for low-temperature superconductors.
Need a Tailored Report?
Customize this report to your needs
Get 10% FREE Customization
Customize This ReportPersonalize This Research
- Triangulate with your Own Data
- Get Data as per your Format and Definition
- Gain a Deeper Dive on a Specific Application, Geography, Customer or Competitor
- Any level of Personalization
Let Us Help You
- What are the Known and Unknown Adjacencies Impacting the Superconducting Wire Market
- What will your New Revenue Sources be?
- Who will be your Top Customer; what will make them switch?
- Defend your Market Share or Win Competitors
- Get a Scorecard for Target Partners

Custom Market Research Services
We Will Customise The Research For You, In Case The Report Listed Above Does Not Meet With Your Requirements
Get 10% Free CustomisationTESTIMONIALS

Kimberly Murphy
GLOBAL MARKETING DIRECTOR
Bently Nevada,
Leading Condition Monitoring & Asset Protectionwww.bakerhughesds.com/bently-nevada

MarketsandMarkets™ showed consistent rigor for success and relentlessly worked with Bently Nevada stakeholders to positively impact go-to-market strategy. Their proactiveness and flexibility has been instrumental in achieving the objectives to grow our sales pipeline in key industrial markets.

DARRICK HUEBER
Business Development Leader
Nexus Controls LLC,
Leading Manufacturer of Automation System & Electrical Panelswww.bakerhughesds.com/nexus-controls

We partnered with MarketsandMarkets to expand our business further by tapping into new industrial segments. It was critical for us to gather crucial business insights about specific markets to achieve this goal. MarketsandMarkets engagement model and client services helped us provide those insights, it was really impressive and valuable for my business. The team was extremely flexible and helpful.

Mike Schoff
Global Industrial Commercial Strategy Leader
Nexus Controls LLC
Leading Manufacturer of Automation System & Electrical Panelswww.bakerhughesds.com/nexus-controls
We consulted MarketsandMarkets for potential Partner Identification. Overall, it was a good experience. The insights provided through interviews conducted by the team helped us put together the questionnaire required for discussion with the selected partners. Their ability to provide insights through interviews with customers in a timely manner was quite impressive.


Growth opportunities and latent adjacency in Superconducting Wire Market