Tensiometer Market by Product (Optical, Force, Volumetric, Bubble Pressure Tensiometer, Accessories), Industry (Chemical, Oil & Gas, Energy, Pharmaceutical, Medical Devices, Cosmetics, Research Laboratory) & Region - Global Forecast to 2024


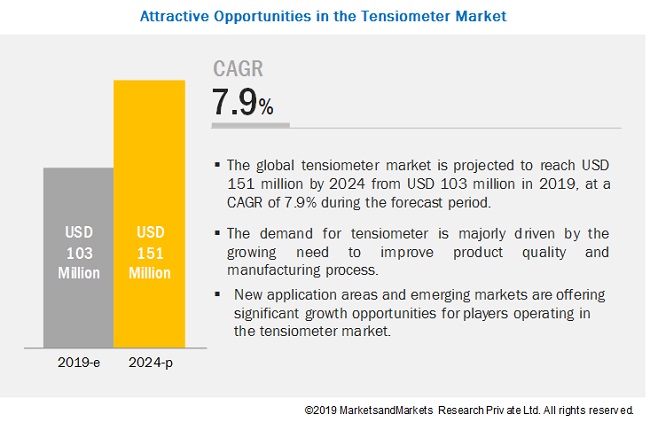
The global tensiometer market is expected to reach USD 151 million by 2024, growing at a CAGR of 7.9% during the forecast period. The global market for tensiometer is primarily driven by the need to improve product quality and manufacturing processes, increasing pharmaceutical and biopharmaceutical R&D expenditure, and technological advancements. However, the reluctance to switch from conventional methods and a dearth of skilled personnel will challenge market growth.
The optical tensiometers segment is projected to grow at the highest CAGR during the forecast period
On the basis of product, the tensiometer market is segmented into optical tensiometers, force tensiometers, volumetric tensiometers, bubble pressure tensiometers, and accessories. The optical tensiometers segment accounted for the largest market share in 2018. The large share of this segment is mainly attributed to the large adoption of optical tensiometers in the chemical, oil & gas, energy, pharmaceutical, and material & coating industries in the R&D and quality control of products.
The chemicals industry segment accounted for the largest share of the market
On the basis of industry, the tensiometer market is segmented into chemical, oil & gas, energy, pharmaceutical & biopharmaceutical, medical device, cosmetic, and other industries (food & beverage, materials & composite, textile, and paper & packaging industries). The chemical industry segment accounted for the largest share of the tensiometers market in 2018. The large share of this segment is primarily attributed to the need to ensure high-quality products and the increasing demand for the characterization of surface interaction analysis of chemical compounds.
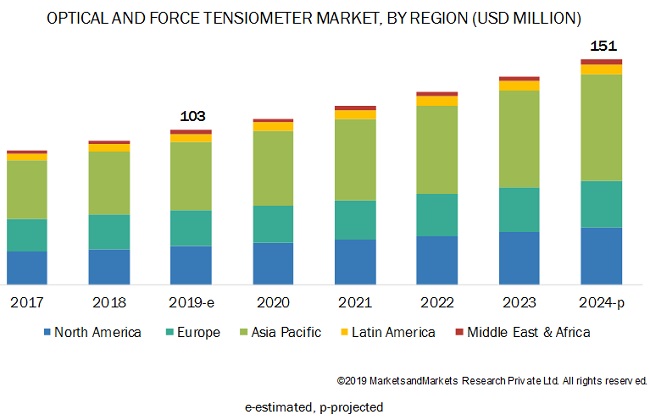
Asia Pacific accounted for the largest share of the tensiometer market
The market is segmented into five major regions, namely, North America, Europe, the Asia Pacific (APAC), Latin America, and the Middle East & Africa. In 2018, Asia Pacific accounted for the largest share of the tensiometer market. The factors such as chemical production growth in China, growth in Indian oil & gas industry, increasing demand for primary energy in India, and growth in medical device & pharmaceutical market in Asia are driving the growth of the tensiometer industry in this region.
Tensiometer Market Key Players
The key players in the global tensiometer market are KRÜSS GmbH (Germany), DataPhysics Instruments GmbH (Germany), Biolin Scientific AB (Sweden), Kyowa Interface Science Co. Ltd. (Japan), LAUDA Scientific GmbH (Germany), TECLIS Scientific (France), Apex Instruments Co. Pvt. Ltd. (India), Pro-Pack Materials (Singapore), USA KINO Industry Co. Ltd. (US), and Kibron Inc. Oy (Finland).
KRÜSS GmbH (Germany) is one of the leading players in the tensiometer market and accounted for the largest share in 2018. KRÜSS is one of the leading providers of optical and force tensiometers to the companies involved in adhesion & coating, spraying & printing, cleaning, food & beverages, medical & pharma surface treatment, and wetting & coating of textiles. To strengthen its market position and to broaden its product offerings, the company majorly focuses on partnerships. For example, in November 2017, the company entered into a partnership with the University of Chicago (US) that enabled KRÜSS to offer surface science instruments for the purpose of academic research at the university.
DataPhysics Instruments GmbH (Germany) held the second-largest share in the market in 2018. The company offers a robust portfolio of tensiometers. To sustain its strong position in the market, the company focuses on strengthening its contact angle measuring device offerings through organic strategies, such as product launches and expansions. For instance, in June 2018, the company recently founded a new subsidiary in the US, named Data Physics Instruments USA Corp, to serve the surface chemistry market in the US and Canada.
Scope of the Report:
|
Report Metric |
Details |
|
Market size available for years |
2017–2024 |
|
Base year considered |
2018 |
|
Forecast period |
2019–2024 |
|
Forecast units |
Value (USD) |
|
Segments covered |
Product, Industry, and Region |
|
Geographies covered |
North America, Europe, Asia Pacific, Latin America, and the Middle East & Africa |
|
Companies covered |
KRÜSS GmbH (Germany) Biolin Scientific AB (Sweden), DataPhysics Instruments GmbH (Germany), Kyowa Interface Science Co. Ltd. (Japan), LAUDA Scientific GmbH (Germany), TECLIS Scientific (France), Apex Instruments Co. Pvt. Ltd. (India), Pro-Pack Materials (Singapore), USA KINO Industry Co. Ltd. (US), and Kibron Inc. Oy (Finland). |
The research report categorizes the market into the following segments and subsegments:
By Product
- Optical Tensiometers
- Force Tensiometers
- Volumetric Tensiometers
- Bubble Pressure Tensiometers
- Accessories
By Industry
- Chemical
- Oil & Gas
- Energy
- Pharmaceutical & Biopharmaceutical
- Medical Device
- Cosmetic
- Other Industries
By Region
-
North America
- US
- Canada
-
Europe
- Germany
- UK
- France
- Rest of Europe (RoE)
-
Asia Pacific
- Japan
- China
- India
- Rest of Asia Pacific (RoAPAC)
-
Latin America
- Middle East & Africa
Critical questions the report answers:
- Where will all the developments take the industry in the mid-to-long term?
- What are the major industries and the benefits they avail by using tensiometers?
- What are the trends going on in the global tensiometer market?
- What are the major market dynamics and their impact on market growth?
- What is the global scenario of the tensiometer market?
To speak to our analyst for a discussion on the above findings, click Speak to Analyst
 Exclusive indicates content/data unique to MarketsandMarkets and not available with any competitors.
Table of Contents
1 Introduction (Page No. - 15)
1.1 Objectives of the Study
1.2 Market Definition
1.3 Market Scope
1.3.1 Markets Covered
1.3.2 Years Considered for the Study
1.4 Currency
1.5 Limitations
1.6 Stakeholders
2 Research Methodology (Page No. - 18)
2.1 Research Approach
2.1.1 Secondary Data
2.1.1.1 Key Data From Secondary Sources
2.1.2 Primary Data
2.1.2.1 Key Data From Primary Sources
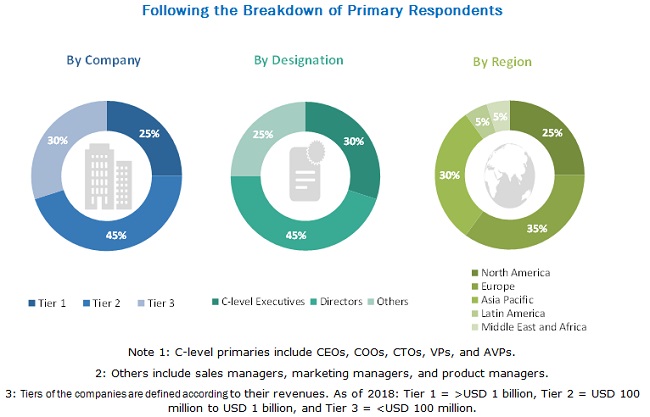
2.1.2.2 Breakdown of Primaries
2.1.2.3 Key Industry Insights
2.2 Market Size Estimation
2.3 Market Breakdown and Data Triangulation
3 Executive Summary (Page No. - 25)
4 Premium Insights (Page No. - 28)
4.1 Optical and Force Tensiometers Market Overview
4.2 APAC: Optical and Force Tensiometers Market, By Industry (2018)
4.3 Geographical Snapshot of the Optical and Force Tensiometers Market
4.4 Regional Mix: Optical and Force Tensiometers Market
4.5 Optical and Force Tensiometers Market: Developing Vs.Developed Countries
5 Market Overview (Page No. - 33)
5.1 Introduction
5.2 Market Dynamics
5.2.1 Drivers
5.2.1.1 Need to Improve Product Quality and Manufacturing Processes
5.2.1.2 Technological Advancements
5.2.1.3 Increasing Pharmaceutical and Biopharmaceutical R&D Expenditure
5.2.2 Opportunities
5.2.2.1 Growth Opportunities in Emerging Markets
5.2.2.2 New Application Areas
5.2.3 Challenges
5.2.3.1 Reluctance to Switch From Conventional Methods
5.2.3.2 Dearth of Skilled Personnel
6 Optical and Force Tensiometers Market, By Product (Page No. - 38)
6.1 Introduction
6.2 Optical Tensiometers
6.2.1 Optical Tensiometers Dominated the Market in 2018
6.3 Force Tensiometers
6.3.1 Capability to Analyze Single Fibers and Loose Powders are Driving the Use of Force Tensiometers
6.4 Volumetric Tensiometers
6.4.1 Rising Need for Quality Checks and Routine Measurement of Surface Tension in Liquid Samples is Driving the Market Growth
6.5 Bubble Pressure Tensiometers
6.5.1 Technological Advancements in Bubble Pressure Tensiometers Will Increase Their Adoption Among End Users
6.6 Accessories
7 Optical and Force Tensiometers Market, By Industry (Page No. - 49)
7.1 Introduction
7.2 Chemical Industry
7.2.1 Chemical Industry Segment Accounted for the Largest Share of the Optical and Force Tensiometers Market
7.3 Oil & Gas Industry
7.3.1 Growth in the Number of New Oil & Gas Fields to Drive Market Growth
7.4 Energy Industry
7.4.1 Growing Demand for Energy-Saving Technologies to Drive the Adoption of Optical and Force Tensiometers
7.5 Pharmaceutical & Biopharmaceutical Industry
7.5.1 Stringent Safety Regulations & Increasing R&D Expenditure are the Key Factors Driving Market Growth
7.6 Medical Device Industry
7.6.1 Growing Focus on Wettability and Biocompatibility of Medical Implants to Support Market Growth
7.7 Cosmetic Industry
7.7.1 Need to Maintain Compliance With Regulatory Guidelines is Expected to Drive Market Growth
7.8 Other Industries
8 Optical and Force Tensiometers Market, By Region (Page No. - 61)
8.1 Introduction
8.2 Asia Pacific
8.2.1 China
8.2.1.1 China Dominates the APAC Optical and Force Tensiometers Market
8.2.2 Japan
8.2.2.1 Rising Adoption of Tensiometers in Manufacturing Industries—Major Factor Driving Market Growth
8.2.3 India
8.2.3.1 Growing Focus on Regulatory Requirements for Healthcare Products to Drive Market Growth
8.2.4 Rest of Asia Pacific
8.3 North America
8.3.1 US
8.3.1.1 Increasing Acceptance of New Technologies is Driving the Market for Optical and Force Tensiometers in the US
8.3.2 Canada
8.3.2.1 Growing Chemical and Energy Industries in Canada to Drive Market Growth
8.4 Europe
8.4.1 Germany
8.4.1.1 Germany is the Largest Market for Optical and Force Tensiometers in Europe
8.4.2 France
8.4.2.1 Rising Focus of the Government on Research Funding to Support Market Growth
8.4.3 UK
8.4.3.1 Increasing Awareness About Tensiometers and the Need for Quality Control in the Manufacturing Industry are Driving Market Growth
8.4.4 Rest of Europe
8.5 Latin America
8.5.1 Favorable Government Investments to Support Research Activities in Various Manufacturing Sectors in Latin America
8.6 Middle East & Africa
8.6.1 Growing Research Funding to Support Market Growth in the Middle East & Africa
9 Competitive Landscape (Page No. - 90)
9.1 Overview
9.2 Market Ranking Analysis
9.3 Competitive Leadership Mapping
9.3.1 Visionary Leaders
9.3.2 Innovators
9.3.3 Dynamic Differentiators
9.3.4 Emerging Companies
9.4 Competitive Situation and Trends
9.4.1 Product Launches and Enhancements
9.4.2 Agreements, Partnerships, and Collaborations
9.4.3 Expansions
10 Company Profiles (Page No. - 96)
(Business Overview, Products Offered, Recent Developments, MnM View)*
10.1 Krüss GmbH
10.2 Biolin Scientific AB
10.3 Dataphysics Instruments GmbH
10.4 Kyowa Interface Science Co, LTD.
10.5 Teclis Scientific
10.6 Henniker Plasma
10.7 Lauda Scientific
10.8 Rame-Hart Instrument Co.
10.9 USA Kino Industry Co., LTD.
10.10 Nanoscience Instruments
10.11 Dyne Technology LTD.
10.12 APEX Instruments Co. Pvt. LTD.
10.13 ATA Scientific Pty. LTD.
10.14 Cheminstruments, Inc.
10.15 Holmarc Opto-Mechatronics Pvt. LTD.
10.16 Pro-Pack Materials PTE LTD.
10.17 Sita Messtechnik GmbH
10.18 First Ten Angstroms, Inc.
10.19 CSC Scientific Company, Inc.
10.20 Kibron Inc. Oy
*Business Overview, Products Offered, Recent Developments, MnM View Might Not Be Captured in Case of Unlisted Companies.
11 Appendix (Page No. - 124)
11.1 Discussion Guide
11.2 Knowledge Store: Marketsandmarkets’ Subscription Portal
11.3 Available Customizations
11.4 Related Reports
11.5 Author Details
List of Tables (73 Tables)
Table 1 Optical and Force Tensiometers Market Snapshot, 2019 vs 2024
Table 2 Market Dynamics: Impact Analysis
Table 3 Tensiometers Launched Between July 2017 and March 2019
Table 4 Optical and Force Tensiometers Market, By Product, 2017–2024 (USD Million)
Table 5 Key Players Providing Optical Tensiometers
Table 6 Optical Tensiometers Market, By Region, 2017–2024 (USD Million)
Table 7 Optical Tensiometers Market, By Country, 2017–2024 (USD Million)
Table 8 Key Players Providing Force Tensiometers
Table 9 Force Tensiometers Market, By Region, 2017–2024 (USD Million)
Table 10 Force Tensiometers Market, By Country, 2017–2024 (USD Million)
Table 11 Key Players Providing Volumetric Tensiometers
Table 12 Volumetric Tensiometers Market, By Region, 2017–2024 (USD Million)
Table 13 Volumetric Tensiometers Market, By Country, 2017–2024 (USD Million)
Table 14 Key Players Providing Bubble Pressure Tensiometers
Table 15 Bubble Pressure Tensiometers Market, By Region, 2017–2024 (USD Million)
Table 16 Bubble Pressure Tensiometers Market, By Country, 2017–2024 (USD Million)
Table 17 Key Players Providing Accessories
Table 18 Optical and Force Tensiometers Market for Accessories, By Region, 2017–2024 (USD Million)
Table 19 Optical and Force Tensiometers Market for Accessories, By Country, 2017–2024 (USD Million)
Table 20 Optical and Force Tensiometers Market, By Industry, 2017–2024 (USD Million)
Table 21 Optical and Force Tensiometers Market for Chemical Industry, By Region, 2017–2024 (USD Million)
Table 22 Optical and Force Tensiometers Market for Chemical Industry, By Country, 2017–2024 (USD Million)
Table 23 Optical and Force Tensiometers Market for Oil & Gas Industry, By Region, 2017–2024 (USD Million)
Table 24 Optical and Force Tensiometers Market for Oil & Gas Industry, By Country, 2017–2024 (USD Million)
Table 25 Optical and Force Tensiometers Market for Energy Industry, By Region, 2017–2024 (USD Million)
Table 26 Optical and Force Tensiometers Market for Energy Industry, By Country, 2017–2024 (USD Million)
Table 27 Optical and Force Tensiometers Market for Pharmaceutical & Biopharmaceutical Industry, By Region, 2017–2024 (USD Million)
Table 28 Optical and Force Tensiometers Market for Pharmaceutical and Biopharmaceutical Industry, By Country, 2017–2024 (USD Million)
Table 29 Optical and Force Tensiometers Market for Medical Device Industry, By Region, 2017–2024 (USD Million)
Table 30 Optical and Force Tensiometers Market for Medical Device Industry, By Country, 2017–2024 (USD Million)
Table 31 Optical and Force Tensiometers Market for Cosmetic Industry, By Region, 2017–2024 (USD Million)
Table 32 Optical and Force Tensiometers Market for Cosmetic Industry, By Country, 2017–2024 (USD Million)
Table 33 Optical and Force Tensiometers Market for Other Industries, By Region, 2017–2024 (USD Million)
Table 34 Optical and Force Tensiometers Market for Other Industries, By Country, 2017–2024 (USD Million)
Table 35 Optical and Force Tensiometers Market, By Region, 2017–2024 (USD Million)
Table 36 Optical and Force Tensiometers Market, By Country, 2017–2024 (USD Million)
Table 37 Optical and Force Tensiometers Market, By Region, 2017–2024 (Units)
Table 38 APAC: Optical and Force Tensiometers Market, By Country, 2017–2024 (USD Million)
Table 39 APAC: Optical and Force Tensiometers Market, By Product, 2017–2024 (USD Million)
Table 40 APAC: Optical and Force Tensiometers Market, By Industry, 2017–2024 (USD Million)
Table 41 China: Optical and Force Tensiometers Market, By Product, 2017–2024 (USD Million)
Table 42 China: Optical and Force Tensiometers Market, By Industry, 2017–2024 (USD Million)
Table 43 Japan: Optical and Force Tensiometers Market, By Product, 2017–2024 (USD Million)
Table 44 Japan: Optical and Force Tensiometers Market, By Industry, 2017–2024 (USD Million)
Table 45 India: Optical and Force Tensiometers Market, By Product, 2017–2024 (USD Million)
Table 46 India: Optical and Force Tensiometers Market, By Industry, 2017–2024 (USD Million)
Table 47 RoAPAC: Optical and Force Tensiometers Market, By Product, 2017–2024 (USD Million)
Table 48 RoAPAC: Optical and Force Tensiometers Market, By Industry, 2017–2024 (USD Million)
Table 49 North America: Optical and Force Tensiometers Market, By Country, 2017–2024 (USD Million)
Table 50 North America: Optical and Force Tensiometers Market, By Product, 2017–2024 (USD Million)
Table 51 North America: Optical and Force Tensiometers Market, By Industry, 2017–2024 (USD Million)
Table 52 US: Optical and Force Tensiometers Market, By Product, 2017–2024 (USD Million)
Table 53 US: Optical and Force Tensiometers Market, By Industry, 2017–2024 (USD Million)
Table 54 Canada: Optical and Force Tensiometers Market, By Product, 2017–2024 (USD Million)
Table 55 Canada: Optical and Force Tensiometers Market, By Industry, 2017–2024 (USD Million)
Table 56 Europe: Optical and Force Tensiometers Market, By Country, 2017–2024 (USD Million)
Table 57 Europe: Optical and Force Tensiometers Market, By Product, 2017–2024 (USD Million)
Table 58 Europe: Optical and Force Tensiometers Market, By Industry, 2017–2024 (USD Million)
Table 59 Germany: Optical and Force Tensiometers Market, By Product, 2017–2024 (USD Million)
Table 60 Germany: Optical and Force Tensiometers Market, By Industry, 2017–2024 (USD Million)
Table 61 France: Optical and Force Tensiometers Market, By Product, 2017–2024 (USD Million)
Table 62 France: Optical and Force Tensiometers Market, By Industry, 2017–2024 (USD Million)
Table 63 UK: Optical and Force Tensiometers Market, By Product, 2017–2024 (USD Million)
Table 64 UK: Optical and Force Tensiometers Market, By Industry, 2017–2024 (USD Million)
Table 65 RoE: Optical and Force Tensiometers Market, By Product, 2017–2024 (USD Million)
Table 66 RoE: Optical and Force Tensiometers Market, By Industry, 2017–2024 (USD Million)
Table 67 Latin America: Optical and Force Tensiometers Market, By Product, 2017–2024 (USD Million)
Table 68 Latin America: Optical and Force Tensiometers Market, By Industry, 2017–2024 (USD Million)
Table 69 Middle East & Africa: Optical and Force Tensiometers Market, By Product, 2017–2024 (USD Million)
Table 70 Middle East & Africa: Optical and Force Tensiometers Market, By Industry, 2017–2024 (USD Million)
Table 71 Product Launches and Enhancements, 2017–2019
Table 72 Agreements, Partnerships, and Collaborations, 2017–2019
Table 73 Expansions, 2017–2019
List of Figures (21 Figures)
Figure 1 Research Design
Figure 2 Market Sizing Approach
Figure 3 Top-Down Approach
Figure 4 Data Triangulation Methodology
Figure 5 Assumptions for the Study
Figure 6 Optical and Force Tensiometers Market, By Product, 2019 vs 2024 (USD Million)
Figure 7 Optical and Force Tensiometers Market, By Industry, 2019 vs 2024 (USD Million)
Figure 8 Geographical Snapshot of the Optical and Force Tensiometers Market
Figure 9 Need to Improve Product Quality and Manufacturing Processes is Driving the Growth of the Optical and Force Tensiometers Market
Figure 10 Optical Tensiometers Segment Accounted for the Largest Share of the APAC Optical and Force Tensiometers Market in 2018
Figure 11 India to Witness the Highest Growth in the Optical and Force Tensiometers Market During the Forecast Period
Figure 12 Asia Pacific is the Fastest-Growing Market for Optical and Force Tensiometers
Figure 13 Developing Countries to Register Higher Growth Rates During the Forecast Period
Figure 14 Optical Tensiometers Segment to Witness the Highest Growth Rate During the Forecast Period
Figure 15 Pharmaceutical & Biopharmaceutical Industry Segment to Register the Highest Growth Rate During the Forecast Period
Figure 16 APAC: Optical and Force Tensiometers Market Snapshot
Figure 17 North America: Optical and Force Tensiometers Market Snapshot
Figure 18 Europe: Optical and Force Tensiometers Market Snapshot
Figure 19 Key Growth Strategies Adopted By Market Players From 2017 to 2019
Figure 20 Global Optical and Force Tensiometers Market Ranking Analysis, By Player, 2018
Figure 21 Global Optical and Force Tensiometers Market: Competitive Leadership Mapping, 2018
This study on the global tensiometer market involved the extensive use of both primary and secondary sources. The research process involved the study of various factors affecting the industry to identify the segmentation types, industry trends, key players, competitive landscape, key market dynamics, and key player strategies.
Secondary Research
The secondary research process involves the widespread use of secondary sources, directories, databases (such as Bloomberg Businessweek, Factiva, and D&B), white papers, companies house documents, investor presentations, and SEC filings of companies. Secondary research was used to identify and collect information useful for the extensive, technical, market-oriented, and commercial study of the tensiometer market. It was also used to obtain important information about the key players and market classification & segmentation according to industry trends to the bottom-most level, and key developments related to market and technology perspectives. A database of the key industry leaders was also prepared using secondary research.
Primary Research
In the primary research process, industry experts from both the supply and demand sides were interviewed to obtain qualitative and quantitative information for this report. Industry experts from the supply side include CEOs, vice presidents, marketing and sales directors, product managers, business development managers, technology and innovation directors of companies providing tensiometers, key opinion leaders, and suppliers and distributors. The industry experts from the demand side include chemical manufacturers, pharmaceutical and medical device companies, research organizations, oil & gas companies, and academic institutes.
To know about the assumptions considered for the study, download the pdf brochure
Market Size Estimation
The market size estimates and forecasts provided in this study are derived through a mix of the bottom-up approach (revenue share analysis of leading players) and top-down approach (assessment of utilization/adoption/penetration trends, by product, industry, and region).
Data Triangulation
After arriving at the market size, the total tensiometer market was divided into several segments and subsegments. To complete the overall market engineering process and arrive at the exact statistics for all segments & subsegments, data triangulation and market breakdown procedures were employed, wherever applicable.
Objectives of the Study
- To define, describe, and forecast the global tensiometer market by product, industry, and region
- To provide detailed information about the factors influencing the market growth (drivers, restraints, opportunities, and challenges)
- To analyze micro markets with respect to individual growth trends, prospects, and contributions to the overall market
- To analyze market opportunities for stakeholders and provide details of the competitive landscape for key players
- To forecast the size of the tensiometer market in five regions (along with major countries)—North America, Europe, the Asia Pacific, Latin America, and the Middle East & Africa.
- To profile key players in the tensiometer market and comprehensively analyze their core competencies and market shares
- To track and analyze competitive developments such as new product/technology launches; collaborations, partnerships, and agreements; expansions; and R&D activities of the leading players in the global tensiometer market
Available Customizations
With the given market data, MarketsandMarkets offers customizations as per the company’s specific needs. The following customization options are available for the report:
Company Information
- Detailed analysis and profiling of additional market players
Geographic Analysis
- Further breakdown of the Rest of Asia Pacific tensiometer market into South Korea, Australia, New Zealand, and other countries
- Further breakdown of the Rest of Europe tensiometer market into Belgium, Russia, the Netherlands, Switzerland, and other countries

 Generating Response ...


Growth opportunities and latent adjacency in Tensiometer Market