Underwater Concrete Market by Raw material (Concrete, Precast Concrete), Application (Dams & Reservoirs, Marine Constructions, Underwater repairs, Offshore Wind Power Generation, Tunnel), Laying Techniques, and Region - Global Forecast to 2028
Updated on : November 11, 2025
Underwater Concrete Market
The global underwater concrete market was valued at USD 135.7 billion in 2023 and is projected to reach USD 175.8 billion by 2028, growing at 5.3% cagr from 2023 to 2028. Underwater concrete is extensively used in the construction of offshore energy installations like oil and gas platforms, wind farms, and tidal energy structures. As the demand for clean energy sources grows, there is an increasing focus on developing offshore renewable energy projects, which require substantial underwater concrete construction. Further, underwater concrete is crucial for the construction and maintenance of various infrastructure projects such as ports & harbors, bridges, tunnels, and offshore structures. As countries invest in expanding their infrastructure to facilitate trade, transportation, and offshore energy production, the demand for underwater concrete increases.
Underwater Concrete Market Forecast & Trends
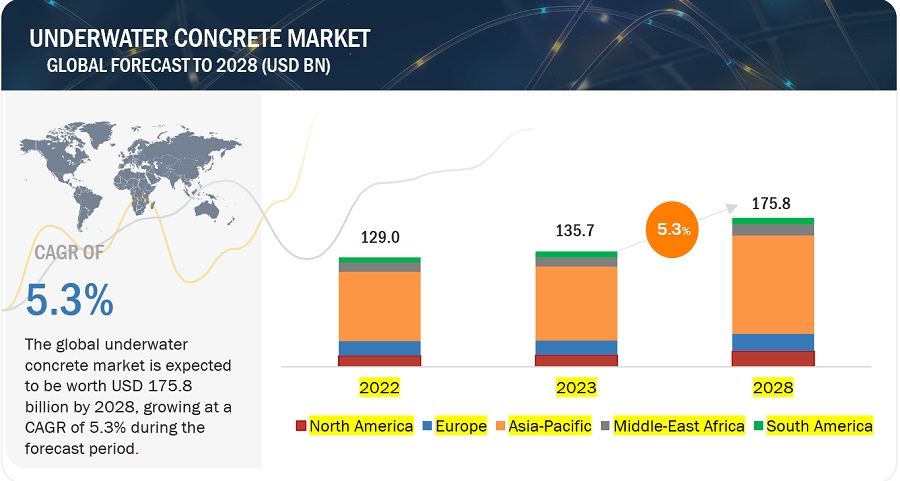
To know about the assumptions considered for the study, Request for Free Sample Report
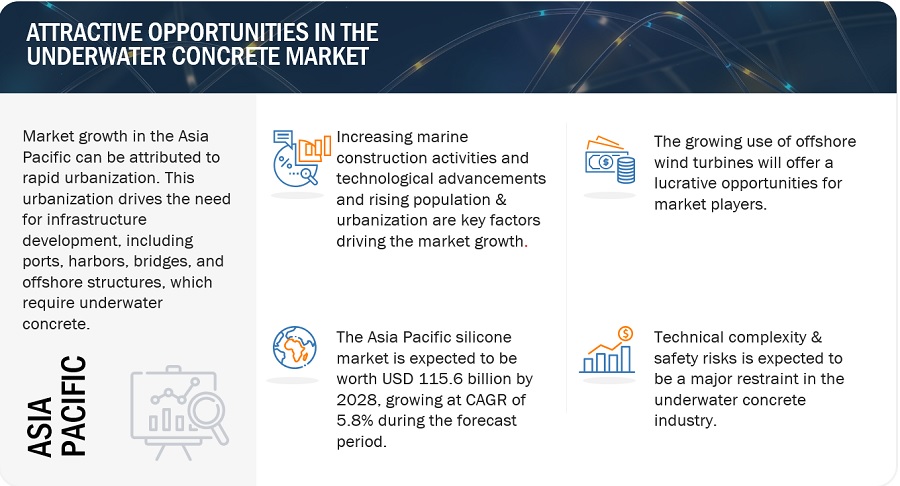
Attractive Opportunities in the Underwater Concrete Market
Underwater Concrete Market Dynamics
Driver: Increasing marine construction activities and rising urbanization & population growth
The growth of the underwater concrete market is being fueled by several factors, including increasing underwater construction activities and rising urbanization. The demand for underwater concrete is rising due to the need for infrastructure development in urban areas, including bridges, tunnels, ports, harbors, and offshore structures. Additionally, as coastal areas become more populated, there is a growing requirement for coastal protection measures such as seawalls, breakwaters, and groynes, all of which utilize underwater concrete. The expansion of ports and harbors to accommodate larger vessels and handle increased trade volumes also drives the demand for underwater concrete.
Restraint: Technical complexity and safety risks
Technical complexity and safety risks act as significant restraints in the underwater concrete market. The complex nature of underwater concrete placement, including limited visibility and water pressure, increases costs and project timelines. Safety risks such as strong currents and underwater hazards pose challenges and require extensive safety protocols. Specialized expertise and training are necessary, and the limited availability of skilled personnel can hinder market growth..
Opportunities: Scaling up the use of offshore wind turbines
The scaling up of offshore wind turbines presents significant opportunities for the underwater concrete market. As the demand for offshore wind farms increases, there is a growing need for sturdy foundations, which rely on underwater concrete. Technological advancements and regional development initiatives further fuel the market's growth. The expanding offshore wind industry creates a larger supply chain ecosystem, requiring a reliable supply of underwater concrete. International collaboration and sustainability considerations also play a role in driving market opportunities. Overall, the offshore wind sector's expansion provides a favorable landscape for the underwater concrete market to flourish.
Challenges: Curing challenge
Curing poses a major challenge in the underwater concrete market due to limited access, water displacement, difficulty in temperature control, extended curing periods, compatibility with water chemistry, adverse environmental conditions, and monitoring complexities. These factors make it difficult to ensure proper curing conditions and maintain the quality and performance of underwater concrete. However, ongoing developments in specialized admixtures, placement techniques, and understanding of curing mechanisms are helping to address these challenges and improve the durability and strength of underwater concrete.
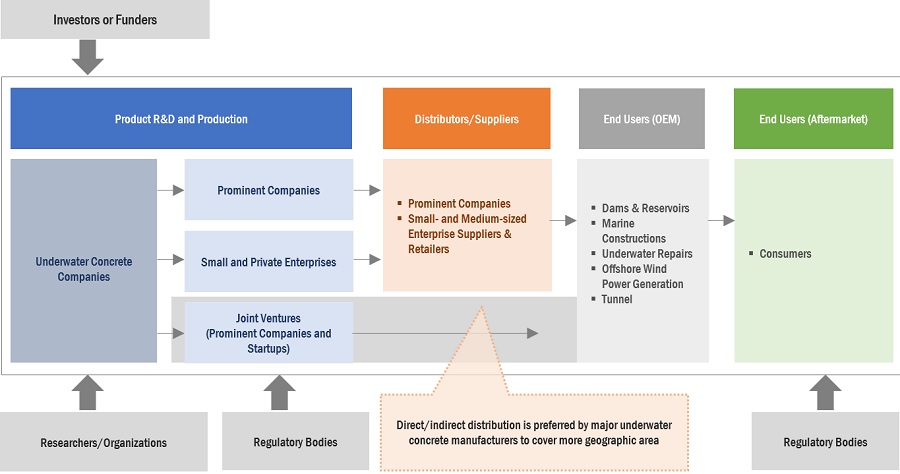
Underwater Concrete Market Ecosystem
By Raw Material, Precast concrete accounted for the highest CAGR during the forecast period
Precast concrete refers to concrete components that are manufactured in a controlled environment, usually a factory or precast plant, before being transported and installed at the construction site. It involves casting concrete in reusable molds or forms, allowing for standardized production and quality control. The growth of precast concrete can be attributed to the increasing infrastructural projects such as offshore energy projects, port and harbor construction, and bridge and tunnel projects.
By Laying Techniques, Tremie method accounted for the largest share in 2022
The tremie method is versatile and used in many underwater construction projects, such as marine foundations, bridge piers, and other submerged structures. It can be used in various different depths and locations, making it suitable for a wide range of applications. The tremie method also minimizes water contamination of the concrete mix. By submerging the discharge end of the pipe, it prevents water from entering the concrete, maintaining its desired properties and strength. These factors make the tremie method, reliable and effective laying techniques for underwater constructions.
By Application, Marine constructions accounted for the largest share in 2022
Marine construction projects drive the growth of the underwater concrete market due to various factors. These projects involve the development of coastal infrastructure, offshore energy installations, underwater transportation infrastructure, coastal protection measures, and repair and rehabilitation work. The demand for underwater concrete arises from the need to construct durable and resilient structures in marine environments. Additionally, government investments and initiatives in maritime infrastructure further contribute to the market's expansion. Overall, the demand for underwater concrete is fueled by the increasing focus on coastal development, offshore energy projects, connectivity, and the need to protect coastal areas from erosion and other natural hazards.
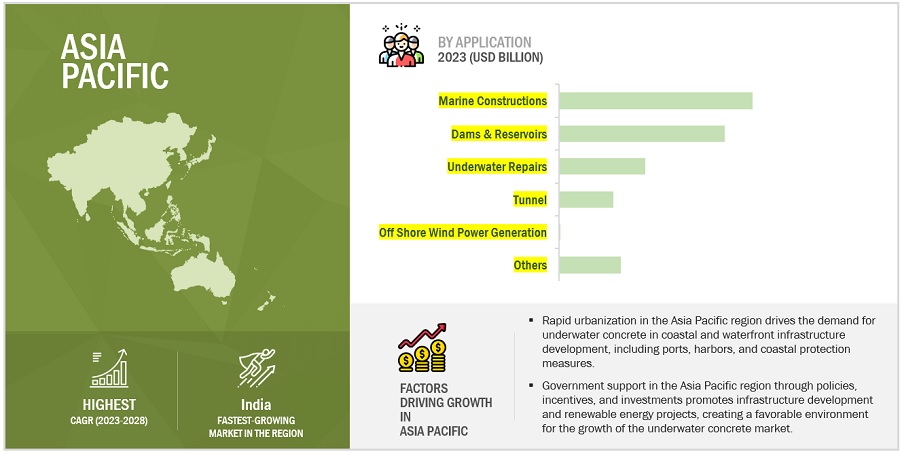
Asia Pacific is projected to account for the highest CAGR in the underwater concrete market during the forecast period
The Asia Pacific region is experiencing significant investments in offshore energy projects, including offshore wind farms and oil and gas platforms, which fuel the demand for underwater concrete in constructing foundations, support structures, and pipelines. Moreover, the region's growing emphasis on renewable energy and offshore exploration further drives the need for underwater concrete. Additionally, with its extensive coastlines and numerous islands, the Asia Pacific region requires extensive development of coastal infrastructure and coastal protection measures. This contributes to the demand for underwater concrete in projects like seawalls, breakwaters, and revetments.
To know about the assumptions considered for the study, download the pdf brochure
Underwater Concrete Market Players
Underwater Concrete market comprises key manufacturers such as Cemex, S.A.B. de C.V.(Mexico), Heidelberg Materials (Germany), Sika AG (Switzerland), Conmix (UAE), RPM International Inc. (US), and others. Expansions, acquisitions, joint ventures, and new product developments are some of the major strategies adopted by these key players to enhance their positions in the underwater concrete market. The major focus was given to the new product development due to the changing requirements of transportation and electronics product consumers across the world.
Underwater Concrete Market Report Scope
|
Report Metric |
Details |
|
Market Size Value in 2023 |
USD 135.7 billion |
|
Revenue Forecast in 2028 |
USD 175.8 billion |
|
CAGR |
5.3% |
|
Years Considered |
2021–2028 |
|
Base year |
2022 |
|
Forecast period |
2023–2028 |
|
Unit considered |
Value (USD Million), Volume (Million Meter Cube) |
|
Segments |
Raw Material, Laying techniques, Application, and Region |
|
Regions |
Asia-Pacific, North America, Europe, South America, and Middle East & Africa |
|
Companies |
The major players are Cemex, S.A.B. de C.V.(Mexico), Heidelberg Materials (Germany), Sika AG (Switzerland), Conmix (UAE), RPM International Inc. (US), and others covered in the underwater concrete market. |
This research report categorizes the global Underwater concrete market on the basis of Type, Application, and Region.
Underwater Concrete Market, By Laying Techniques
- Tremie Method
- Bucket Placing
- Pump Method
- Others
Underwater Concrete Market, By Application
- Dams & Reservoirs
- Marine Constructions
- Underwater Repairs
- Offshore Wind Power Generation
- Tunnel
- Others
Underwater Concrete Market, By Raw Material
- Concrete
- Precast Concrete
Underwater Concrete Market, By Region
- Asia Pacific (APAC)
- North America
- Europe
- South America
- Middle East & Africa
The market has been further analyzed for the key countries in each of these regions.
Recent Developments
- In May 2023, Sika AG acquired the MBCC Group to strengthen its footprint across all regions and reinforce its range of products and services across the entire construction industry.
- In March 2022, Sika AG has acquired Sable Marco Inc., a manufacturer of cementitious products and mortars in Canada.
- In June 2022, Sika AG opened a new manufacturing site for concrete admixtures in stafford, virginia. with this, the company will be able to cater to the demand from the construction industry in north america..
- In July 2021, RPM International Inc. acquired a US-based chemical manufacturing plant from ChampionX Corporation. This plant was owned and operated by RPM’s Tremco Construction Products Group.
- In November 2022, Mapei S.P.A. has recently invested in opening a new headquarters in Germany and upgrading the existing research and development center.
Frequently Asked Questions (FAQ):
What are the major drivers driving the growth of the underwater concrete market?
The underwater concrete market is expected to witness significant growth in the future due to the growing marine construction activities, technological advancements and infrastructure development and reconstruction projects.
What are the major challenges in the underwater concrete market?
The major challenges in the underwater concrete market are curing, construction costs and intense competition in the market.
What are the restraining factors in the underwater concrete market?
The major restraining factor faced by the underwater concrete market are technical complexity & safety risks, and environmental implications.
What is the key opportunity in the underwater concrete market?
Scaling up the use of offshore wind turbines is the key opportunity in the underwater concrete market.
What are the end-use industries where underwater concrete are used?
The underwater concrete is majorly used in dams & reservoirs, marine constructions, underwater repairs, offshore wind power generation, and tunnel.
How is underwater concrete different from regular concrete?
Underwater concrete is designed to prevent washout, using specific additives like retarders or accelerators. It often has a higher viscosity, enabling it to stay in place when poured underwater, unlike regular concrete that might disperse.
Why is underwater concrete different from regular concrete?
Underwater concrete is designed to withstand the challenges of being submerged, such as water pressure, erosion, and chemical exposure. It often includes admixtures that prevent washout during placement.
Who are the major players in the underwater concrete market?
Major companies include Lafarge Holcim, Heidelberg Cement, Cemex, and Sika, which are involved in developing specialized concrete solutions for underwater applications.
What are the environmental considerations for underwater concrete?
Environmental regulations impact the underwater concrete market by necessitating sustainable practices that minimize disruption to marine ecosystems while ensuring effective construction methods.
To speak to our analyst for a discussion on the above findings, click Speak to Analyst


- 5.1 INTRODUCTION
-
5.2 MARKET DYNAMICSDRIVERS- Increased marine construction activities- Use of advanced curing methods with water-saturated blankets and membranes- Reconstruction of ports and harbors- Rising population and urbanizationRESTRAINTS- Technical complexity and safety risks- Adverse environmental effects on marine ecosystemOPPORTUNITIES- Scaling up use of offshore wind turbinesCHALLENGES- Low curing rates and leaching of cementitious materials- High cost and intense competition
-
5.3 PORTER’S FIVE FORCES ANALYSISBARGAINING POWER OF SUPPLIERSTHREAT OF NEW ENTRANTSTHREAT OF SUBSTITUTESBARGAINING POWER OF BUYERSINTENSITY OF COMPETITIVE RIVALRY
- 5.4 VALUE CHAIN ANALYSIS
-
5.5 TRENDS AND DISRUPTIONS IMPACTING CUSTOMER BUSINESSREVENUE SHIFT FOR UNDERWATER CONCRETE PLAYERS
-
5.6 REGULATORY LANDSCAPEAMERICAN CONCRETE INSTITUTEINTERNATIONAL ORGANIZATION FOR STANDARDIZATIONBRITISH STANDARDS INSTITUTIONREGULATORY BODIES, GOVERNMENT AGENCIES, AND OTHER ORGANIZATIONS
-
5.7 SUPPLY CHAIN ANALYSISRAW MATERIAL & TRANSPORTATIONPRODUCTIONDISTRIBUTIONEND USE APPLICATIONAFTER-SALES SUPPORT
- 5.8 TECHNOLOGY ANALYSIS
-
5.9 ECOSYSTEM MAPPING
-
5.10 KEY STAKEHOLDERS AND BUYING CRITERIAKEY STAKEHOLDERS IN BUYING PROCESSBUYING CRITERIA
- 5.11 KEY CONFERENCES AND EVENTS, 2023–2024
- 5.12 IMPORT–EXPORT SCENARIO
-
5.13 PATENT ANALYSISDOCUMENT TYPESJURISDICTION ANALYSISTOP APPLICANTS
-
5.14 CASE STUDY ANALYSISHONG KONG–ZHUHAI–MACAO BRIDGE PROJECT TO CONSTRUCT UNDERWATER FOUNDATION FOR BRIDGE PIERS- Challenge- SolutionTHAMES TIDEWAY TUNNEL PROJECT TO BUILD RESILIENT CONCRETE TUNNEL- Challenge- Solution
-
5.15 MACROECONOMIC INDICATORSGDP TRENDS AND FORECAST
-
5.16 PRICING ANALYSISFLUCTUATING UNDERWATER CONCRETE PRICES
- 5.17 RECESSION IMPACT ANALYSIS
- 6.1 INTRODUCTION
-
6.2 CONCRETECEMENT- Efficient binding and durability to fuel demand for concrete mixturesADMIXTURES- Waterproofing admixtures- Accelerating admixtures- Superplasticizer admixtures- Other admixturesOTHER CONCRETE
-
6.3 PRECAST CONCRETEMETICULOUS QUALITY CONTROL MEASURES TO DRIVE MARKET
- 7.1 INTRODUCTION
-
7.2 TREMIE METHODREDUCES SEGREGATION AND MINIMIZES WATER CONTAMINATION
-
7.3 BUCKET PLACINGSUITABLE FOR SMALL-SCALE UNDERWATER CONSTRUCTION PROJECTS
-
7.4 PUMP METHODOFFERS HOMOGENOUS MIX AND BETTER STRUCTURAL INTEGRITY
- 7.5 OTHER METHODS
- 8.1 INTRODUCTION
-
8.2 DAMS & RESERVOIRSCONSTRUCTION OF DAMS & RESERVOIRS TO BOOST HYDROPOWER CAPACITY
-
8.3 MARINE CONSTRUCTIONCONSTRUCTION OF STRUCTURES IN OR NEAR WATER TO DRIVE MARKETPORTS & HARBORS- Durability and strength of underwater concrete to facilitate safe and efficient maritime operationsBRIDGE PIERS- Resistance to water and chemical exposure to fuel demand for underwater concreteOTHERS
-
8.4 UNDERWATER REPAIRSMAINTENANCE OF EXISTING SEA BRIDGES TO DRIVE MARKET
-
8.5 OFFSHORE WIND POWER GENERATIONGOVERNMENT INITIATIVES TO BUILD OFFSHORE WIND FARMS TO DRIVE MARKET
-
8.6 TUNNELSCONSTRUCTION OF WORLD’S LARGEST UNDERWATER TUNNEL TO DRIVE MARKET
- 8.7 OTHER APPLICATIONS
- 9.1 INTRODUCTION
-
9.2 ASIA PACIFICRECESSION IMPACT ON ASIA PACIFICCHINA- High wind power generation to boost marketINDIA- Coastal and riverine projects to drive marketJAPAN- Coastal infrastructure development and marine renewable energy to drive marketREST OF ASIA PACIFIC
-
9.3 EUROPERECESSION IMPACT ON EUROPEGERMANY- Development of cutting-edge technologies to drive marketUK- Growth of construction sector to boost marketFRANCE- Increasing demand for underwater concrete in construction industry to fuel marketITALY- High demand for offshore wind power generation to drive marketREST OF EUROPE
-
9.4 NORTH AMERICARECESSION IMPACT ON NORTH AMERICAUS- Port expansion and development of coastal infrastructure to drive marketCANADA- Hydroelectric power project to fuel demand for underwater concreteMEXICO- Increase in offshore oil & gas reserves to fuel market
-
9.5 SOUTH AMERICARECESSION IMPACT ON SOUTH AMERICABRAZIL- Use of renewable energy to drive marketARGENTINA- Increasing demand for underwater concrete in power applications to drive marketREST OF SOUTH AMERICA
-
9.6 MIDDLE EAST & AFRICARECESSION IMPACT ON MIDDLE EAST & AFRICASAUDI ARABIA- Increase in offshore oil & gas reserves to drive marketSOUTH AFRICA- Refurbishment of ports to fuel marketTURKEY- Rehabilitation of dams & reservoirs to propel marketREST OF MIDDLE EAST & AFRICA

- 10.1 OVERVIEW
- 10.2 MARKET SHARE ANALYSIS
-
10.3 COMPANY EVALUATION QUADRANTSTARSEMERGING LEADERSPARTICIPANTSPERVASIVE PLAYERS
- 10.4 COMPETITIVE BENCHMARKING
-
10.5 SME/STARTUP MATRIX, 2022PROGRESSIVE COMPANIESRESPONSIVE COMPANIESDYNAMIC COMPANIESSTARTING BLOCKS
-
10.6 COMPETITIVE SCENARIODEALSPRODUCT LAUNCHES
-
11.1 KEY PLAYERSSIKA AG- Business overview- Products/Solutions/Services offered- Recent developments- MnM viewRPM INTERNATIONAL INC.- Business overview- Products/Solutions/Services offered- Recent developments- MnM viewMAPEI S.P.A.- Business overview- Products/Solutions/Services offered- Recent developments- MnM viewBUZZI S.P.A.- Business overview- Products/Solutions/Services offered- Recent developments- MnM viewASHLAND- Business overview- Products/Solutions/Services offered- Recent developments- MnM viewCEMEX, S.A.B. DE C.V.- Business overview- Products/Solutions/Services offered- Recent developments- MnM viewCONMIX- Business overview- Products/Solutions/Services offered- Recent developments- MnM viewROCKBOND SCP LTD.- Business overview- Products/Solutions/Services offered- MnM viewUNIBETON READY MIX- Business overview- Products/Solutions/Services offered- MnM viewTARMAC- Business overview- Products/Solutions/Services offered- Recent developments- MnM viewHEIDELBERG MATERIALS- Business overview- Products/Solutions/Services offered- Recent developments- MnM view
-
11.2 OTHER PLAYERSEVONIK INDUSTRIES AGWIESER CONCRETEFOSROC, INC.QANBAR READYMIXGCP APPLIED TECHNOLOGIES INC.FIVE STAR PRODUCTS, INC.KEOHANE READYMIXFRITZ-PAK CORPORATIONMUHU (CHINA) CONSTRUCTION MATERIALS CO. LTD.TITAN AMERICA LLCKRYTON INTERNATIONAL INC.CHRYSOXYPEX CHEMICAL CORPORATIONSCHOMBURGRUSSTECH, INC.
- 13.1 DISCUSSION GUIDE
- 13.2 KNOWLEDGESTORE: MARKETSANDMARKETS’ SUBSCRIPTION PORTAL
- 13.3 CUSTOMIZATION OPTIONS
- 13.4 RELATED REPORTS
- 13.5 AUTHOR DETAILS
- TABLE 1 UNDERWATER CONCRETE MARKET: PORTER’S FIVE FORCE ANALYSIS
- TABLE 2 UNDERWATER CONCRETE MARKET: SUPPLY CHAIN
- TABLE 3 UNDERWATER CONCRETE MARKET ECOSYSTEM
- TABLE 4 IMPACT OF STAKEHOLDERS ON BUYING PROCESS (%)
- TABLE 5 KEY BUYING CRITERIA FOR MAJOR APPLICATIONS
- TABLE 6 UNDERWATER CONCRETE MARKET: KEY CONFERENCES AND EVENTS
- TABLE 7 ARTICLES OF CEMENT, CONCRETE, OR ARTIFICIAL STONE, WHETHER OR NOT REINFORCED, EXPORT DATA, HS CODE: 6810, 2022 (USD MILLION)
- TABLE 8 ARTICLES OF CEMENT, CONCRETE, OR ARTIFICIAL STONE, WHETHER OR NOT REINFORCED, IMPORT DATA, HS CODE: 6810, 2022 (USD MILLION)
- TABLE 9 PATENTS BY YUJOO CO., LTD.
- TABLE 10 PATENTS BY CHINA RAILWAY MAJOR BRIDGE ENGINEERING GROUP CO., LTD.
- TABLE 11 PATENTS BY CCCC SECOND HARBOR ENGINEERING COMPANY LTD.
- TABLE 12 US: PATENT OWNERS BETWEEN 2013 AND 2022
- TABLE 13 WORLD GDP GROWTH PROJECTION, 2021–2028 (USD TRILLION)
- TABLE 14 AVERAGE SELLING PRICE OF RAW MATERIALS, 2022
- TABLE 15 AVERAGE SELLING PRICE OF UNDERWATER CONCRETE, 2022
- TABLE 16 UNDERWATER CONCRETE MARKET, BY RAW MATERIAL, 2021–2028 (USD MILLION)
- TABLE 17 UNDERWATER CONCRETE MARKET, BY RAW MATERIAL, 2021–2028 (MILLION METER CUBE)
- TABLE 18 UNDERWATER CONCRETE MARKET, BY LAYING TECHNIQUE, 2021–2028 (USD MILLION)
- TABLE 19 UNDERWATER CONCRETE MARKET, BY LAYING TECHNIQUE, 2021–2028 (MILLION METER CUBE)
- TABLE 20 UNDERWATER CONCRETE MARKET, BY APPLICATION, 2021–2028 (USD MILLION)
- TABLE 21 UNDERWATER CONCRETE MARKET, BY APPLICATION, 2021–2028 (MILLION METER CUBE)
- TABLE 22 TOP 10 PORTS IN CHINA
- TABLE 23 UNDERWATER CONCRETE MARKET, BY REGION, 2021–2028 (USD MILLION)
- TABLE 24 UNDERWATER CONCRETE MARKET, BY REGION, 2021–2028 (MILLION METER CUBE)
- TABLE 25 ASIA PACIFIC: UNDERWATER CONCRETE MARKET, BY COUNTRY, 2021–2028 (USD MILLION)
- TABLE 26 ASIA PACIFIC: UNDERWATER CONCRETE MARKET, BY COUNTRY, 2021–2028 (MILLION METER CUBE)
- TABLE 27 ASIA PACIFIC: UNDERWATER CONCRETE MARKET, BY RAW MATERIAL, 2021–2028 (USD MILLION)
- TABLE 28 ASIA PACIFIC: UNDERWATER CONCRETE MARKET, BY RAW MATERIAL, 2021–2028 (MILLION METER CUBE)
- TABLE 29 ASIA PACIFIC: UNDERWATER CONCRETE MARKET, BY LAYING TECHNIQUE, 2021–2028 (USD MILLION)
- TABLE 30 ASIA PACIFIC: UNDERWATER CONCRETE MARKET, BY LAYING TECHNIQUE, 2021–2028 (MILLION METER CUBE)
- TABLE 31 ASIA PACIFIC: UNDERWATER CONCRETE MARKET, BY APPLICATION, 2021–2028 (USD MILLION)
- TABLE 32 ASIA PACIFIC: UNDERWATER CONCRETE MARKET, BY APPLICATION, 2021–2028 (MILLION METER CUBE)
- TABLE 33 CHINA: UNDERWATER CONCRETE MARKET, BY RAW MATERIAL, 2021–2028 (USD MILLION)
- TABLE 34 CHINA: UNDERWATER CONCRETE MARKET, BY RAW MATERIAL, 2021–2028 (MILLION METER CUBE)
- TABLE 35 CHINA: UNDERWATER CONCRETE MARKET, BY LAYING TECHNIQUE, 2021–2028 (USD MILLION)
- TABLE 36 CHINA: UNDERWATER CONCRETE MARKET, BY LAYING TECHNIQUE, 2021–2028 (MILLION METER CUBE)
- TABLE 37 CHINA: UNDERWATER CONCRETE MARKET, BY APPLICATION, 2021–2028 (USD MILLION)
- TABLE 38 CHINA: UNDERWATER CONCRETE MARKET, BY APPLICATION, 2021–2028 (MILLION METER CUBE)
- TABLE 39 INDIA: UNDERWATER CONCRETE MARKET, BY RAW MATERIAL, 2021–2028 (USD MILLION)
- TABLE 40 INDIA: UNDERWATER CONCRETE MARKET, BY RAW MATERIAL, 2021–2028 (MILLION METER CUBE)
- TABLE 41 INDIA: UNDERWATER CONCRETE MARKET, BY LAYING TECHNIQUE, 2021–2028 (USD MILLION)
- TABLE 42 INDIA: UNDERWATER CONCRETE MARKET, BY LAYING TECHNIQUE, 2021–2028 (MILLION METER CUBE)
- TABLE 43 INDIA: UNDERWATER CONCRETE MARKET, BY APPLICATION, 2021–2028 (USD MILLION)
- TABLE 44 INDIA: UNDERWATER CONCRETE MARKET, BY APPLICATION, 2021–2028 (MILLION METER CUBE)
- TABLE 45 JAPAN: UNDERWATER CONCRETE MARKET, BY RAW MATERIAL, 2021–2028 (USD MILLION)
- TABLE 46 JAPAN: UNDERWATER CONCRETE MARKET, BY RAW MATERIAL, 2021–2028 (MILLION METER CUBE)
- TABLE 47 JAPAN: UNDERWATER CONCRETE MARKET, BY LAYING TECHNIQUE, 2021–2028 (USD MILLION)
- TABLE 48 JAPAN: UNDERWATER CONCRETE MARKET, BY LAYING TECHNIQUE, 2021–2028 (MILLION METER CUBE)
- TABLE 49 JAPAN: UNDERWATER CONCRETE MARKET, BY APPLICATION, 2021–2028 (USD MILLION)
- TABLE 50 JAPAN: UNDERWATER CONCRETE MARKET, BY APPLICATION, 2021–2028 (MILLION METER CUBE)
- TABLE 51 REST OF ASIA PACIFIC: UNDERWATER CONCRETE MARKET, BY RAW MATERIAL, 2021–2028 (USD MILLION)
- TABLE 52 REST OF ASIA PACIFIC: UNDERWATER CONCRETE MARKET, BY RAW MATERIAL, 2021–2028 (MILLION METER CUBE)
- TABLE 53 REST OF ASIA PACIFIC: UNDERWATER CONCRETE MARKET, BY LAYING TECHNIQUE, 2021–2028 (USD MILLION)
- TABLE 54 REST OF ASIA PACIFIC: UNDERWATER CONCRETE MARKET, BY LAYING TECHNIQUE, 2021–2028 (MILLION METER CUBE)
- TABLE 55 REST OF ASIA PACIFIC: UNDERWATER CONCRETE MARKET, BY APPLICATION, 2021–2028 (USD MILLION)
- TABLE 56 REST OF ASIA PACIFIC: UNDERWATER CONCRETE MARKET, BY APPLICATION, 2021–2028 (MILLION METER CUBE)
- TABLE 57 EUROPE: UNDERWATER CONCRETE MARKET, BY COUNTRY, 2021–2028 (USD MILLION)
- TABLE 58 EUROPE: UNDERWATER CONCRETE MARKET, BY COUNTRY, 2021–2028 (MILLION METER CUBE)
- TABLE 59 EUROPE: UNDERWATER CONCRETE MARKET, BY LAYING TECHNIQUE, 2021–2028 (USD MILLION)
- TABLE 60 EUROPE: UNDERWATER CONCRETE MARKET, BY LAYING TECHNIQUE, 2021–2028 (MILLION METER CUBE)
- TABLE 61 EUROPE: UNDERWATER CONCRETE MARKET, BY APPLICATION, 2021–2028 (USD MILLION)
- TABLE 62 EUROPE: UNDERWATER CONCRETE MARKET, BY APPLICATION, 2021–2028 (MILLION METER CUBE)
- TABLE 63 EUROPE: UNDERWATER CONCRETE MARKET, BY RAW MATERIAL, 2021–2028 (USD MILLION)
- TABLE 64 EUROPE: UNDERWATER CONCRETE MARKET, BY RAW MATERIAL, 2021–2028 (MILLION METER CUBE)
- TABLE 65 GERMANY: UNDERWATER CONCRETE MARKET, BY LAYING TECHNIQUE, 2021–2028 (USD MILLION)
- TABLE 66 GERMANY: UNDERWATER CONCRETE MARKET, BY LAYING TECHNIQUE, 2021–2028 (MILLION METER CUBE)
- TABLE 67 GERMANY: UNDERWATER CONCRETE MARKET, BY APPLICATION, 2021–2028 (USD MILLION)
- TABLE 68 GERMANY: UNDERWATER CONCRETE MARKET, BY APPLICATION, 2021–2028 (MILLION METER CUBE)
- TABLE 69 GERMANY: UNDERWATER CONCRETE MARKET, BY RAW MATERIAL, 2021–2028 (USD MILLION)
- TABLE 70 GERMANY: UNDERWATER CONCRETE MARKET, BY RAW MATERIAL, 2021–2028 (MILLION METER CUBE)
- TABLE 71 UK: UNDERWATER CONCRETE MARKET, BY LAYING TECHNIQUE, 2021–2028 (USD MILLION)
- TABLE 72 UK: UNDERWATER CONCRETE MARKET, BY LAYING TECHNIQUE, 2021–2028 (MILLION METER CUBE)
- TABLE 73 UK: UNDERWATER CONCRETE MARKET, BY APPLICATION, 2021–2028 (USD MILLION)
- TABLE 74 UK: UNDERWATER CONCRETE MARKET, BY APPLICATION, 2021–2028 (MILLION METER CUBE)
- TABLE 75 UK: UNDERWATER CONCRETE MARKET, BY RAW MATERIAL, 2021–2028 (USD MILLION)
- TABLE 76 UK: UNDERWATER CONCRETE MARKET, BY RAW MATERIAL, 2021–2028 (MILLION METER CUBE)
- TABLE 77 FRANCE: UNDERWATER CONCRETE MARKET, BY LAYING TECHNIQUE, 2021–2028 (USD MILLION)
- TABLE 78 FRANCE: UNDERWATER CONCRETE MARKET, BY LAYING TECHNIQUE, 2021–2028 (MILLION METER CUBE)
- TABLE 79 FRANCE: UNDERWATER CONCRETE MARKET, BY APPLICATION, 2021–2028 (USD MILLION)
- TABLE 80 FRANCE: UNDERWATER CONCRETE MARKET, BY APPLICATION, 2021–2028 (MILLION METER CUBE)
- TABLE 81 FRANCE: UNDERWATER CONCRETE MARKET, BY RAW MATERIAL, 2021–2028 (USD MILLION)
- TABLE 82 FRANCE: UNDERWATER CONCRETE MARKET, BY RAW MATERIAL, 2021–2028 (MILLION METER CUBE)
- TABLE 83 ITALY: UNDERWATER CONCRETE MARKET, BY LAYING TECHNIQUE, 2021–2028 (USD MILLION)
- TABLE 84 ITALY: UNDERWATER CONCRETE MARKET, BY LAYING TECHNIQUE, 2021–2028 (MILLION METER CUBE)
- TABLE 85 ITALY: UNDERWATER CONCRETE MARKET, BY APPLICATION, 2021–2028 (USD MILLION)
- TABLE 86 ITALY: UNDERWATER CONCRETE MARKET, BY APPLICATION, 2021–2028 (MILLION METER CUBE)
- TABLE 87 ITALY: UNDERWATER CONCRETE MARKET, BY RAW MATERIAL, 2021–2028 (USD MILLION)
- TABLE 88 ITALY: UNDERWATER CONCRETE MARKET, BY RAW MATERIAL, 2021–2028 (MILLION METER CUBE)
- TABLE 89 REST OF EUROPE: UNDERWATER CONCRETE MARKET, BY LAYING TECHNIQUE, 2021–2028 (USD MILLION)
- TABLE 90 REST OF EUROPE: UNDERWATER CONCRETE MARKET, BY LAYING TECHNIQUE, 2021–2028 (MILLION METER CUBE)
- TABLE 91 REST OF EUROPE: UNDERWATER CONCRETE MARKET, BY APPLICATION, 2021–2028 (USD MILLION)
- TABLE 92 REST OF EUROPE: UNDERWATER CONCRETE MARKET, BY APPLICATION, 2021–2028 (MILLION METER CUBE)
- TABLE 93 REST OF EUROPE: UNDERWATER CONCRETE MARKET, BY RAW MATERIAL, 2021–2028 (USD MILLION)
- TABLE 94 REST OF EUROPE: UNDERWATER CONCRETE MARKET, BY RAW MATERIAL, 2021–2028 (MILLION METER CUBE)
- TABLE 95 NORTH AMERICA: UNDERWATER CONCRETE MARKET, BY COUNTRY, 2021–2028 (USD MILLION)
- TABLE 96 NORTH AMERICA: UNDERWATER CONCRETE MARKET, BY COUNTRY, 2021–2028 (MILLION METER CUBE)
- TABLE 97 NORTH AMERICA: UNDERWATER CONCRETE MARKET, BY RAW MATERIAL, 2021–2028 (USD MILLION)
- TABLE 98 NORTH AMERICA: UNDERWATER CONCRETE MARKET, BY RAW MATERIAL, 2021–2028 (MILLION METER CUBE)
- TABLE 99 NORTH AMERICA: UNDERWATER CONCRETE MARKET, BY LAYING TECHNIQUE, 2021–2028 (USD MILLION)
- TABLE 100 NORTH AMERICA: UNDERWATER CONCRETE MARKET, BY LAYING TECHNIQUE, 2021–2028 (MILLION METER CUBE)
- TABLE 101 NORTH AMERICA: UNDERWATER CONCRETE MARKET, BY APPLICATION, 2021–2028 (USD MILLION)
- TABLE 102 NORTH AMERICA: UNDERWATER CONCRETE MARKET, BY APPLICATION, 2021–2028 (MILLION METER CUBE)
- TABLE 103 US: UNDERWATER CONCRETE MARKET, BY RAW MATERIAL, 2021–2028 (USD MILLION)
- TABLE 104 US: UNDERWATER CONCRETE MARKET, BY RAW MATERIAL, 2021–2028 (MILLION METER CUBE)
- TABLE 105 US: UNDERWATER CONCRETE MARKET, BY LAYING TECHNIQUE, 2021–2028 (USD MILLION)
- TABLE 106 US: UNDERWATER CONCRETE MARKET, BY LAYING TECHNIQUE, 2021–2028 (MILLION METER CUBE)
- TABLE 107 US: UNDERWATER CONCRETE MARKET, BY APPLICATION, 2021–2028 (USD MILLION)
- TABLE 108 US: UNDERWATER CONCRETE MARKET, BY APPLICATION, 2021–2028 (MILLION METER CUBE)
- TABLE 109 CANADA: UNDERWATER CONCRETE MARKET, BY RAW MATERIAL, 2021–2028 (USD MILLION)
- TABLE 110 CANADA: UNDERWATER CONCRETE MARKET, BY RAW MATERIAL, 2021–2028 (MILLION METER CUBE)
- TABLE 111 CANADA: UNDERWATER CONCRETE MARKET, BY LAYING TECHNIQUE, 2021–2028 (USD MILLION)
- TABLE 112 CANADA: UNDERWATER CONCRETE MARKET, BY LAYING TECHNIQUE, 2021–2028 (MILLION METER CUBE)
- TABLE 113 CANADA: UNDERWATER CONCRETE MARKET, BY APPLICATION, 2021–2028 (USD MILLION)
- TABLE 114 CANADA: UNDERWATER CONCRETE MARKET, BY APPLICATION, 2021–2028 (MILLION METER CUBE)
- TABLE 115 MEXICO: UNDERWATER CONCRETE MARKET, BY RAW MATERIAL, 2021–2028 (USD MILLION)
- TABLE 116 MEXICO: UNDERWATER CONCRETE MARKET, BY RAW MATERIAL, 2021–2028 (MILLION METER CUBE)
- TABLE 117 MEXICO: UNDERWATER CONCRETE MARKET, BY LAYING TECHNIQUE, 2021–2028 (USD MILLION)
- TABLE 118 MEXICO: UNDERWATER CONCRETE MARKET, BY LAYING TECHNIQUE, 2021–2028 (MILLION METER CUBE)
- TABLE 119 MEXICO: UNDERWATER CONCRETE MARKET, BY APPLICATION, 2021–2028 (USD MILLION)
- TABLE 120 MEXICO: UNDERWATER CONCRETE MARKET, BY APPLICATION, 2021–2028 (MILLION METER CUBE)
- TABLE 121 SOUTH AMERICA: UNDERWATER CONCRETE MARKET, BY COUNTRY, 2021–2028 (USD MILLION)
- TABLE 122 SOUTH AMERICA: UNDERWATER CONCRETE MARKET, BY COUNTRY, 2021–2028 (MILLION METER CUBE)
- TABLE 123 SOUTH AMERICA: UNDERWATER CONCRETE MARKET, BY LAYING TECHNIQUE, 2021–2028 (USD MILLION)
- TABLE 124 SOUTH AMERICA: UNDERWATER CONCRETE MARKET, BY LAYING TECHNIQUE, 2021–2028 (MILLION METER CUBE)
- TABLE 125 SOUTH AMERICA: UNDERWATER CONCRETE MARKET, BY APPLICATION, 2021–2028 (USD MILLION)
- TABLE 126 SOUTH AMERICA: UNDERWATER CONCRETE MARKET, BY APPLICATION, 2021–2028 (MILLION METER CUBE)
- TABLE 127 SOUTH AMERICA: UNDERWATER CONCRETE MARKET, BY RAW MATERIAL, 2021–2028 (USD MILLION)
- TABLE 128 SOUTH AMERICA: UNDERWATER CONCRETE MARKET, BY RAW MATERIAL, 2021–2028 (MILLION METER CUBE)
- TABLE 129 BRAZIL: UNDERWATER CONCRETE MARKET, BY LAYING TECHNIQUE, 2021–2028 (USD MILLION)
- TABLE 130 BRAZIL: UNDERWATER CONCRETE MARKET, BY LAYING TECHNIQUE, 2021–2028 (MILLION METER CUBE)
- TABLE 131 BRAZIL: UNDERWATER CONCRETE MARKET, BY APPLICATION, 2021–2028 (USD MILLION)
- TABLE 132 BRAZIL: UNDERWATER CONCRETE MARKET, BY APPLICATION, 2021–2028 (MILLION METER CUBE)
- TABLE 133 BRAZIL: UNDERWATER CONCRETE MARKET, BY RAW MATERIAL, 2021–2028 (USD MILLION)
- TABLE 134 BRAZIL: UNDERWATER CONCRETE MARKET, BY RAW MATERIAL, 2021–2028 (MILLION METER CUBE)
- TABLE 135 ARGENTINA: UNDERWATER CONCRETE MARKET, BY LAYING TECHNIQUE, 2021–2028 (USD MILLION)
- TABLE 136 ARGENTINA: UNDERWATER CONCRETE MARKET, BY LAYING TECHNIQUE, 2021–2028 (MILLION METER CUBE)
- TABLE 137 ARGENTINA: UNDERWATER CONCRETE MARKET, BY APPLICATION, 2021–2028 (USD MILLION)
- TABLE 138 ARGENTINA: UNDERWATER CONCRETE MARKET, BY APPLICATION, 2021–2028 (MILLION METER CUBE)
- TABLE 139 ARGENTINA: UNDERWATER CONCRETE MARKET, BY RAW MATERIAL, 2021–2028 (USD MILLION)
- TABLE 140 ARGENTINA: UNDERWATER CONCRETE MARKET, BY RAW MATERIAL, 2021–2028 (MILLION METER CUBE)
- TABLE 141 REST OF SOUTH AMERICA: UNDERWATER CONCRETE MARKET, BY LAYING TECHNIQUE, 2021–2028 (USD MILLION)
- TABLE 142 REST OF SOUTH AMERICA: UNDERWATER CONCRETE MARKET, BY LAYING TECHNIQUE, 2021–2028 (MILLION METER CUBE)
- TABLE 143 REST OF SOUTH AMERICA: UNDERWATER CONCRETE MARKET, BY APPLICATION, 2021–2028 (USD MILLION)
- TABLE 144 REST OF SOUTH AMERICA: UNDERWATER CONCRETE MARKET, BY APPLICATION, 2021–2028 (MILLION METER CUBE)
- TABLE 145 REST OF SOUTH AMERICA: UNDERWATER CONCRETE MARKET, BY RAW MATERIAL, 2021–2028 (USD MILLION)
- TABLE 146 REST OF SOUTH AMERICA: UNDERWATER CONCRETE MARKET, BY RAW MATERIAL, 2021–2028 (MILLION METER CUBE)
- TABLE 147 MIDDLE EAST & AFRICA: UNDERWATER CONCRETE MARKET, BY COUNTRY, 2021–2028 (USD MILLION)
- TABLE 148 MIDDLE EAST & AFRICA: UNDERWATER CONCRETE MARKET, BY COUNTRY, 2021–2028 (MILLION METER CUBE)
- TABLE 149 MIDDLE EAST & AFRICA: UNDERWATER CONCRETE MARKET, BY RAW MATERIAL, 2021–2028 (USD MILLION)
- TABLE 150 MIDDLE EAST & AFRICA: UNDERWATER CONCRETE MARKET, BY RAW MATERIAL, 2021–2028 (MILLION METER CUBE)
- TABLE 151 MIDDLE EAST & AFRICA: UNDERWATER CONCRETE MARKET, BY LAYING TECHNIQUE, 2021–2028 (USD MILLION)
- TABLE 152 MIDDLE EAST & AFRICA: UNDERWATER CONCRETE MARKET, BY LAYING TECHNIQUE, 2021–2028 (MILLION METER CUBE)
- TABLE 153 MIDDLE EAST & AFRICA: UNDERWATER CONCRETE MARKET, BY APPLICATION, 2021–2028 (USD MILLION)
- TABLE 154 MIDDLE EAST & AFRICA: UNDERWATER CONCRETE MARKET, BY APPLICATION, 2021–2028 (MILLION METER CUBE)
- TABLE 155 SAUDI ARABIA: UNDERWATER CONCRETE MARKET, BY RAW MATERIAL, 2021–2028 (USD MILLION)
- TABLE 156 SAUDI ARABIA: UNDERWATER CONCRETE MARKET, BY RAW MATERIAL, 2021–2028 (MILLION METER CUBE)
- TABLE 157 SAUDI ARABIA: UNDERWATER CONCRETE MARKET, BY LAYING TECHNIQUE, 2021–2028 (USD MILLION)
- TABLE 158 SAUDI ARABIA: UNDERWATER CONCRETE MARKET, BY LAYING TECHNIQUE, 2021–2028 (MILLION METER CUBE)
- TABLE 159 SAUDI ARABIA: UNDERWATER CONCRETE MARKET, BY APPLICATION, 2021–2028 (USD MILLION)
- TABLE 160 SAUDI ARABIA: UNDERWATER CONCRETE MARKET, BY APPLICATION, 2021–2028 (MILLION METER CUBE)
- TABLE 161 SOUTH AFRICA: UNDERWATER CONCRETE MARKET, BY RAW MATERIAL, 2021–2028 (USD MILLION)
- TABLE 162 SOUTH AFRICA: UNDERWATER CONCRETE MARKET, BY RAW MATERIAL, 2021–2028 (MILLION METER CUBE)
- TABLE 163 SOUTH AFRICA: UNDERWATER CONCRETE MARKET, BY LAYING TECHNIQUE, 2021–2028 (USD MILLION)
- TABLE 164 SOUTH AFRICA: UNDERWATER CONCRETE MARKET, BY LAYING TECHNIQUE, 2021–2028 (MILLION METER CUBE)
- TABLE 165 SOUTH AFRICA: UNDERWATER CONCRETE MARKET, BY APPLICATION, 2021–2028 (USD MILLION)
- TABLE 166 SOUTH AFRICA: UNDERWATER CONCRETE MARKET, BY APPLICATION, 2021–2028 (MILLION METER CUBE)
- TABLE 167 TURKEY: UNDERWATER CONCRETE MARKET, BY RAW MATERIAL, 2021–2028 (USD MILLION)
- TABLE 168 TURKEY: UNDERWATER CONCRETE MARKET, BY RAW MATERIAL, 2021–2028 (MILLION METER CUBE)
- TABLE 169 TURKEY: UNDERWATER CONCRETE MARKET, BY LAYING TECHNIQUE, 2021–2028 (USD MILLION)
- TABLE 170 TURKEY: UNDERWATER CONCRETE MARKET, BY LAYING TECHNIQUE, 2021–2028 (MILLION METER CUBE)
- TABLE 171 TURKEY: UNDERWATER CONCRETE MARKET, BY APPLICATION, 2021–2028 (USD MILLION)
- TABLE 172 TURKEY: UNDERWATER CONCRETE MARKET, BY APPLICATION, 2021–2028 (MILLION METER CUBE)
- TABLE 173 REST OF MIDDLE EAST & AFRICA: UNDERWATER CONCRETE MARKET, BY RAW MATERIAL, 2021–2028 (USD MILLION)
- TABLE 174 REST OF MIDDLE EAST & AFRICA: UNDERWATER CONCRETE MARKET, BY RAW MATERIAL, 2021–2028 (MILLION METER CUBE)
- TABLE 175 REST OF MIDDLE EAST & AFRICA: UNDERWATER CONCRETE MARKET, BY LAYING TECHNIQUE, 2021–2028 (USD MILLION)
- TABLE 176 REST OF MIDDLE EAST & AFRICA: UNDERWATER CONCRETE MARKET, BY LAYING TECHNIQUE, 2021–2028 (MILLION METER CUBE)
- TABLE 177 REST OF MIDDLE EAST & AFRICA: UNDERWATER CONCRETE MARKET, BY APPLICATION, 2021–2028 (USD MILLION)
- TABLE 178 REST OF MIDDLE EAST & AFRICA: UNDERWATER CONCRETE MARKET, BY APPLICATION, 2021–2028 (MILLION METER CUBE)
- TABLE 179 GROWTH STRATEGIES ADOPTED BY KEY MARKET PLAYERS
- TABLE 180 MANUFACTURERS IN UNDERWATER CONCRETE MARKET
- TABLE 181 UNDERWATER CONCRETE MARKET: COMPETITIVE BENCHMARKING OF KEY PLAYERS
- TABLE 182 DEALS, 2019–2023
- TABLE 183 PRODUCT LAUNCHES, 2019–2023
- TABLE 184 SIKA AG: COMPANY OVERVIEW
- TABLE 185 SIKA AG: DEALS
- TABLE 186 SIKA AG: OTHER DEVELOPMENTS
- TABLE 187 RPM INTERNATIONAL INC.: COMPANY OVERVIEW
- TABLE 188 RPM INTERNATIONAL INC.: DEALS
- TABLE 189 MAPEI S.P.A.: COMPANY OVERVIEW
- TABLE 190 MAPEI S.P.A.: DEALS
- TABLE 191 MAPEI S.P.A.: OTHER DEVELOPMENTS
- TABLE 192 BUZZI S.P.A.: COMPANY OVERVIEW
- TABLE 193 BUZZI S.P.A.: DEALS
- TABLE 194 BUZZI S.P.A.: OTHER DEVELOPMENTS
- TABLE 195 ASHLAND: COMPANY OVERVIEW
- TABLE 196 ASHLAND: OTHER DEVELOPMENTS
- TABLE 197 CEMEX, S.A.B. DE C.V.: COMPANY OVERVIEW
- TABLE 198 CEMEX, S.A.B. DE C.V.: DEALS
- TABLE 199 CEMEX, S.A.B. DE C.V.: PRODUCT LAUNCHES
- TABLE 200 CONMIX: COMPANY OVERVIEW
- TABLE 201 CONMIX: DEALS
- TABLE 202 CONMIX: OTHER DEVELOPMENTS
- TABLE 203 ROCKBOND SCP LTD.: COMPANY OVERVIEW
- TABLE 204 UNIBETON READY MIX: COMPANY OVERVIEW
- TABLE 205 TARMAC: COMPANY OVERVIEW
- TABLE 206 TARMAC: OTHER DEVELOPMENTS
- TABLE 207 HEIDELBERG MATERIALS: COMPANY OVERVIEW
- TABLE 208 HEIDELBERG MATERIALS: DEALS
- TABLE 209 EVONIK INDUSTRIES AG: COMPANY OVERVIEW
- TABLE 210 WIESER CONCRETE: COMPANY OVERVIEW
- TABLE 211 FOSROC, INC.: COMPANY OVERVIEW
- TABLE 212 QANBAR READYMIX: COMPANY OVERVIEW
- TABLE 213 GCP APPLIED TECHNOLOGIES INC.: COMPANY OVERVIEW
- TABLE 214 FIVE STAR PRODUCTS, INC.: COMPANY OVERVIEW
- TABLE 215 KEOHANE READYMIX: COMPANY OVERVIEW
- TABLE 216 FRITZ-PAK CORPORATION: COMPANY OVERVIEW
- TABLE 217 MUHU (CHINA) CONSTRUCTION MATERIALS CO. LTD.: COMPANY OVERVIEW
- TABLE 218 TITAN AMERICA LLC: COMPANY OVERVIEW
- TABLE 219 KRYTON INTERNATIONAL INC.: COMPANY OVERVIEW
- TABLE 220 CHRYSO: COMPANY OVERVIEW
- TABLE 221 XYPEX CHEMICAL CORPORATION: COMPANY OVERVIEW
- TABLE 222 SCHOMBURG: COMPANY OVERVIEW
- TABLE 223 RUSSTECH, INC.: COMPANY OVERVIEW
- TABLE 224 CONCRETE ADMIXTURES MARKET, BY REGION, 2017–2024 (KILOTON)
- TABLE 225 CONCRETE ADMIXTURES MARKET, BY REGION, 2017–2024 (USD MILLION)
- FIGURE 1 UNDERWATER CONCRETE MARKET SEGMENTATION
- FIGURE 2 UNDERWATER CONCRETE MARKET: RESEARCH DESIGN
- FIGURE 3 STAKEHOLDERS INVOLVED AND BREAKDOWN OF PRIMARY INTERVIEWS
- FIGURE 4 MARKET SIZE ESTIMATION: BOTTOM-UP APPROACH
- FIGURE 5 MARKET SIZE ESTIMATION: TOP-DOWN APPROACH
- FIGURE 6 MARKET SIZE ESTIMATION: SUPPLY SIDE
- FIGURE 7 UNDERWATER CONCRETE MARKET: DATA TRIANGULATION
- FIGURE 8 TREMIE METHOD TO LEAD MARKET DURING FORECAST PERIOD
- FIGURE 9 ASIA PACIFIC TO RECORD HIGHEST GROWTH DURING FORECAST PERIOD
- FIGURE 10 EMERGING ECONOMIES TO OFFER LUCRATIVE OPPORTUNITIES IN UNDERWATER CONCRETE MARKET
- FIGURE 11 ASIA PACIFIC: CHINA ACCOUNTED FOR LARGEST SHARE IN 2022
- FIGURE 12 CONCRETE SEGMENT TO ACCOUNT FOR LARGEST SHARE IN 2028
- FIGURE 13 OFFSHORE WIND POWER GENERATION TO RECORD FASTEST GROWTH DURING FORECAST PERIOD
- FIGURE 14 UNDERWATER CONCRETE MARKET TO REGISTER HIGHEST CAGR DURING FORECAST PERIOD
- FIGURE 15 DRIVERS, RESTRAINTS, OPPORTUNITIES, AND CHALLENGES
- FIGURE 16 PORTER’S FIVE FORCES ANALYSIS: UNDERWATER CONCRETE MARKET
- FIGURE 17 PRODUCTION PROCESS TO ADD VALUE TO OVERALL PRICE OF UNDERWATER CONCRETE
- FIGURE 18 REVENUE SHIFT & NEW REVENUE POCKETS FOR UNDERWATER CONCRETE MANUFACTURERS
- FIGURE 19 SUPPLY CHAIN OF UNDERWATER CONCRETE MARKET
- FIGURE 20 ECOSYSTEM MAP
- FIGURE 21 INFLUENCE OF STAKEHOLDERS ON BUYING PROCESS FOR KEY APPLICATIONS
- FIGURE 22 KEY BUYING CRITERIA FOR TOP APPLICATIONS
- FIGURE 23 GRANTED PATENTS ACCOUNTED FOR MAJOR SHARE, 2013–2022
- FIGURE 24 PATENTS PUBLISHED, 2013–2022
- FIGURE 25 PATENT COUNT, BY JURISDICTION
- FIGURE 26 TOP TEN APPLICANTS WITH HIGHEST PATENT COUNT
- FIGURE 27 CONCRETE SEGMENT TO CAPTURE LARGEST MARKET SHARE IN 2028
- FIGURE 28 TREMIE METHOD TO ACCOUNT FOR LARGEST SHARE DURING FORECAST PERIOD
- FIGURE 29 MARINE CONSTRUCTIONS TO ACCOUNT FOR LARGEST SHARE DURING FORECAST PERIOD
- FIGURE 30 INDIA TO RECORD HIGHEST GROWTH DURING FORECAST PERIOD
- FIGURE 31 ASIA PACIFIC: UNDERWATER CONCRETE MARKET SNAPSHOT
- FIGURE 32 EUROPE: UNDERWATER CONCRETE MARKET SNAPSHOT
- FIGURE 33 UNDERWATER CONCRETE MARKET: MARKET SHARE ANALYSIS
- FIGURE 34 COMPANY EVALUATION MATRIX: UNDERWATER CONCRETE MARKET, 2022
- FIGURE 35 SME/STARTUP MATRIX: UNDERWATER CONCRETE MARKET, 2022
- FIGURE 36 SIKA AG: COMPANY SNAPSHOT
- FIGURE 37 RPM INTERNATIONAL INC.: COMPANY SNAPSHOT
- FIGURE 38 MAPEI S.P.A.: COMPANY SNAPSHOT
- FIGURE 39 BUZZI S.P.A.: COMPANY SNAPSHOT
- FIGURE 40 ASHLAND: COMPANY SNAPSHOT
- FIGURE 41 CEMEX, S.A.B. DE C.V.: COMPANY SNAPSHOT
- FIGURE 42 HEIDELBERG MATERIALS: COMPANY SNAPSHOT
This research involved the use of extensive secondary sources and databases, such as Factiva and Bloomberg, to identify and collect information useful for a technical and market-oriented study of the Underwater concrete market. Primary sources included industry experts from related industries and preferred suppliers, manufacturers, distributors, technologists, standards & certification organizations, and organizations related to all segments of the value chain of this industry. In-depth interviews have been conducted with various primary respondents, such as key industry participants, subject matter experts (SMEs), executives of key companies, and industry consultants, to obtain and verify critical qualitative and quantitative information as well as to assess growth prospects.
Secondary Research
In the secondary research process, various sources such as annual reports, press releases, and investor presentations of companies; white papers; and publications from recognized websites and databases have been referred to for identifying and collecting information. Secondary research has been used to obtain key information about the industry's supply chain, the total pool of key players, market classification and segmentation according to the industry trends to the bottom-most level, regional markets, and key developments from both market-and technology-oriented perspectives.
Primary Research
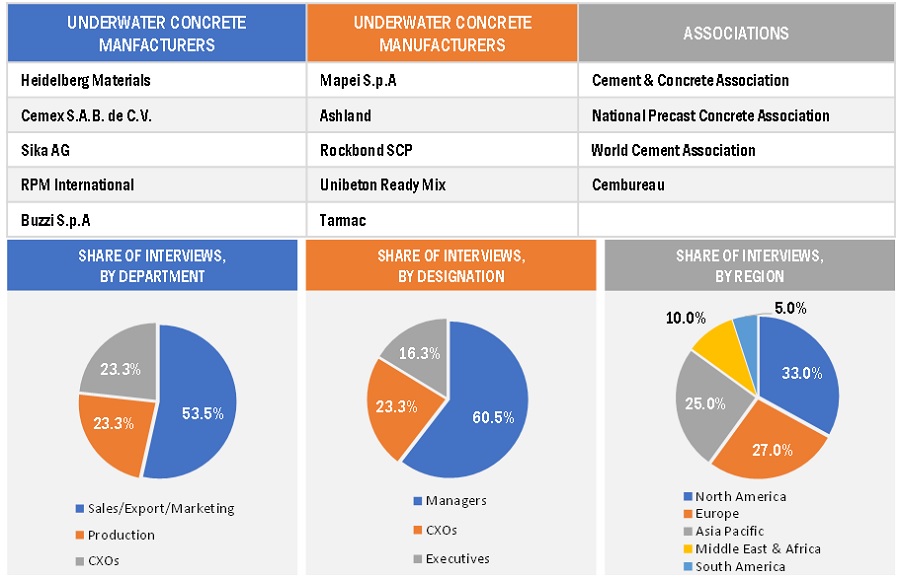
The Underwater concrete market comprises several stakeholders in the supply chain, which include suppliers, processors, and end-product manufacturers. Various primary sources from the supply and demand sides of the markets have been interviewed to obtain qualitative and quantitative information. The primary participants from the demand side include key opinion leaders, executives, managers, and CXOs of companies in the Underwater concrete market. Primary sources from the supply side include associations and institutions involved in the Underwater concrete industry, key opinion leaders, and processing players.
Following is the breakdown of primary respondents—
To know about the assumptions considered for the study, download the pdf brochure
Market Size Estimation
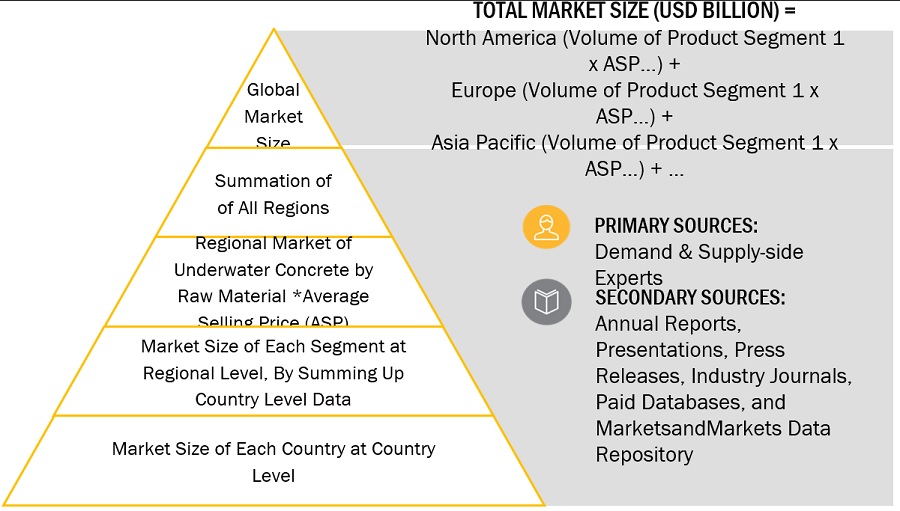
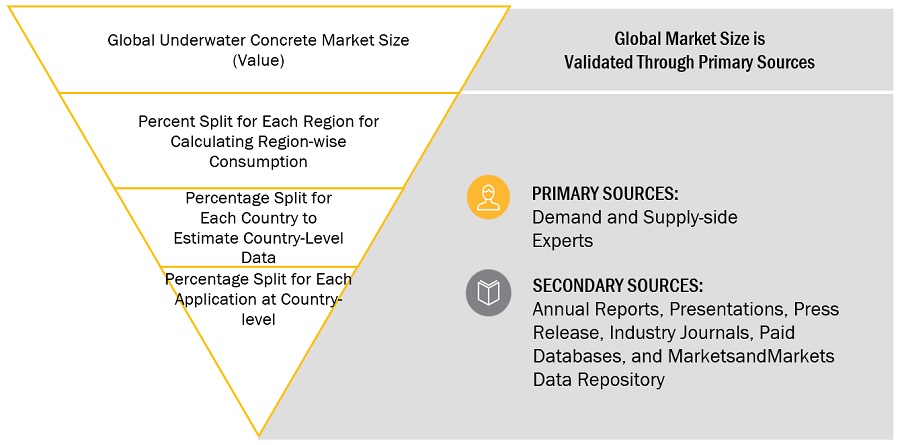
Both top-down and bottom-up approaches were used to estimate and validate the size of the global Underwater concrete market. The research methodology used to estimate the market size includes the following:
- The key players in the industry were identified through extensive secondary research.
- The supply chain of the industry and market size, in terms of value, were determined through primary and secondary research.
- All percentage shares split, and breakdowns were determined using secondary sources and verified through primary sources.
- All possible parameters that affect the markets covered in this research study were accounted for, viewed in extensive detail, verified through primary research, and analyzed to obtain the final quantitative and qualitative data.
- The research includes the study of reports, reviews, and newsletters of key industry players along with extensive interviews with key officials, such as directors and marketing executives.
Market Size Estimation: Bottom-Up Approach
To know about the assumptions considered for the study, Request for Free Sample Report
Market Size Estimation: Top-Down Approach
Data Triangulation
After arriving at the total market size from the estimation process explained above, the overall market was split into several segments and subsegments. To complete the overall market size estimation process and arrive at the exact statistics for all segments and subsegments, the data triangulation and market breakdown procedures have been employed, wherever applicable. The data have been triangulated by studying various factors and trends from both the demand and supply sides. In addition, the market size has been validated by using both the top-down and bottom-up approaches.
Market Definition
Underwater concrete, also known as subaqueous concrete or undersea concrete, refers to a specially designed concrete mixture that is placed and cured underwater or in saturated conditions. It is formulated to achieve proper setting and hardening even when submerged, allowing for the construction, repair, or maintenance of structures in aquatic environments. The underwater concrete is used in several applications such as Dams & reservoirs, Marine Constructions, Tunnel, Offshore Wind Power Generation, Underwater Repair, etc.
Key StakeHolders
- Raw Material Suppliers and Producers
- Regulatory Bodies
- End User
- Research and Development Organizations
- Industrial Associations
- Underwater concrete manufacturers, dealers, traders, and suppliers.
Report Objectives
- To define, describe, and forecast the global underwater concrete market in terms of value and volume.
- To provide insights regarding the significant factors influencing the growth of the market (drivers, restraints, opportunities, and challenges)
- To analyze and forecast the market based on laying techniques, raw materials, region, and application.
- To forecast the market size, in terms of value and volume, with respect to five main regions: North America, Europe, Asia Pacific, South America, and Middle East & Africa.
- To analyze the opportunities in the market for stakeholders and provide details of the competitive landscape.
- To strategically profile key players in the market.
- To analyze competitive developments in the market, such as new product launches, capacity expansions, and mergers & acquisitions.
- To strategically profile the leading players and comprehensively analyze their key developments in the market.
Available Customizations:
Along with the given market data, MarketsandMarkets offers customizations as per the specific needs of the companies. The following customization options are available for the report:
Product Analysis:
- Product Matrix which gives a detailed comparison of the product portfolio of each company
Regional Analysis:
- Further breakdown of the Rest of the APAC Underwater concrete market
- Further breakdown of the Rest of Europe’s Underwater concrete market
Company Information:
- Detailed analysis and profiling of additional market players (up to 5)


Growth opportunities and latent adjacency in Underwater Concrete Market