Urgent Care Apps Market by Type (Emergency Care Triage Apps, In-hospital Communication Apps, Post-hospital Apps (Nurse Communication Apps, Rehab Apps, Medication Management Apps)), Clinical Area (Stroke, Trauma, STEMI) - Global Forecasts to 2023


The urgent care apps market is projected to reach USD 2,515.1 million by 2023, growing at a CAGR of 41.3%.
Objectives of the Study
- To define, describe, segment, and forecast the global urgent care apps industry by type, clinical area, and region.
- To forecast the size of the urgent care apps market in North America, Europe, Asia Pacific (APAC), Latin America, and the Middle East & Africa.
- To provide detailed information about factors influencing market growth (drivers, restraints, opportunities, and industry-specific challenges).
- To analyze micromarkets with respect to individual growth trends, prospects, and contributions to the overall market.
- To analyze market opportunities for stakeholders and provide details of the competitive landscape for key players.
- To profile key players in the urgent care apps market and comprehensively analyze their core competencies2 and market rankings.
- To track and analyze competitive developments such as acquisitions, product launches, collaborations, partnerships, and agreements in the market.
Research Methodology
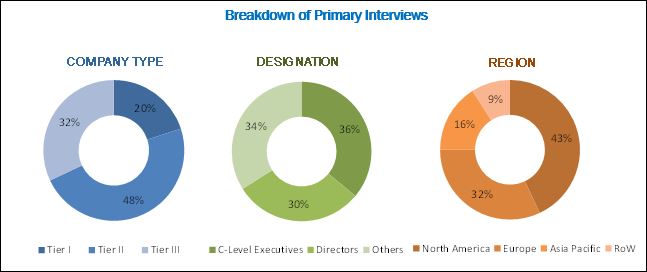
Top-down and bottom-up approaches were used to validate the size of the urgent care apps market and estimate the size of other dependent submarkets. Various secondary sources such as directories, industry journals, databases such as Bloomberg Business, Factiva, and Dun & Bradstreet; white papers; annual reports; company house documents; and SEC filings of the companies have been used to identify and collect information useful for the study of this market. Primary sources such as experts from both supply and demand sides have been interviewed to obtain and validate information as well as to assess the dynamics of this market. The breakdown of profiles of primaries is shown in the figure below:
To know about the assumptions considered for the study, download the pdf brochure
Some of the prominent players in this market are Allm (Japan), Pulsara (US), Vocera Communications (US), PatientSafe Solutions (US), Voalte (US), Twiage (US), TigerConnect (US), Imprivata (US), Siilo (Netherlands), Forward Health (UK), Hospify (UK), Argusoft (US), Alayacare (US), Pivot Design Group (Canada), Medisafe (US), Smartpatient (Germany), and Johnson & Johnson (US).
Target Audience
- Government agencies
- Mobile app vendors
- Independent software vendors
- Payment gateway providers
- Value-added resellers
- Venture capitalists and start-ups
- Acute care continuum app end users
- Business research and consulting firms
By Type
- Pre-hospital Emergency Care & Triaging Apps
- In-hospital Communication & Collaboration Apps
-
Post-hospital Apps
- Medication Management Apps
- Rehabilitation Apps
- Care Provider Communication & Collaboration Apps
By Clinical Area
- Trauma
- Stroke
- Cardiac Conditions
- Other Clinical Areas
By Region
-
North America
- US
- Canada
-
Europe
- Germany
- UK
- Rest of Europe
-
Asia Pacific
- Japan
- China
- India
- Rest of Asia Pacific
-
Latin America
- Brazil
- Rest of Latin America
- Middle East & Africa
Available Customization
With the given market data, MarketsandMarkets offers customizations as per the company’s specific needs. The following customization options are available for the report:
Product Analysis
- Product matrix which gives a detailed comparison of the product portfolios of the top companies
Geographic Analysis
- Further breakdown of the European urgent care apps market into France, the Netherlands, and Italy
Company Information
- Detailed analysis and profiling of additional market players (Up to 5)
The growth of this market is influenced by a number of factors, such as the increasing penetration of smartphones, growing penetration of 3G and 4G networks, rising focus on patient-centric healthcare delivery, and the benefits offered by urgent care apps.
The report analyzes the urgent care apps market by type, clinical area, and region. On the basis of type, the market is segmented into pre-hospital emergency care & triaging apps, in-hospital communication & collaboration apps, and post-hospital apps. In 2017, the post-hospital apps segment accounted for the largest share of the market. The large share of this segment is mainly attributed the rising awareness of mobile apps to manage medications among patients and increasing demand for medication management & rehabilitation apps due to increasing number of stroke, trauma, and cardiac patients who need rehab support during post-hospital care.
Based on clinical area, the market is classified into trauma, stroke, cardiac conditions, and other clinical areas. The trauma segment is expected to account for the largest share of the urgent care apps market in 2018. The increasing number of road accident across the globe is driving the growth of this segment. As the awareness to address trauma is increasing due to continuous efforts by health organizations, such as WHO, the adoption of apps to manage trauma and casualty among paramedics and emergency centers is also growing.
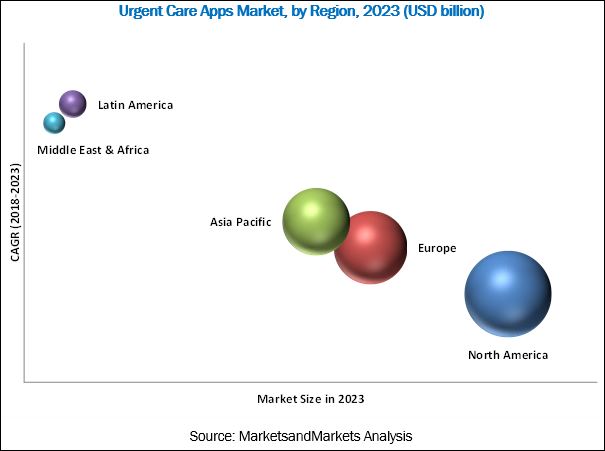
In 2018, North America accounted for the largest share of the market, followed by Europe. The large share of North America is attributed to the implementation of patient data safety regulations in the region, improving quality of care, increasing internet speeds, the need to reduce escalating healthcare costs, and a growing focus on patient-centric healthcare delivery.
However, the usage of consumer instant messaging apps and high volume of miscategorized apps on Android and Apple stores are the key challenges for the growth of this market.
Prominent players in this market are Allm (Japan), Pulsara (US), Vocera Communications (US), PatientSafe Solutions (US), Voalte (US), Twiage (US), TigerConnect (US), Imprivata (US), Siilo (Netherlands), Forward Health (UK), Hospify (UK), Argusoft (US), Alayacare (US), Pivot Design Group (Canada), Medisafe (US), Smartpatient (Germany), and Johnson & Johnson (US).
Frequently Asked Questions (FAQs):
What is the size of Urgent Care Apps Market?
The urgent care apps market is projected to reach USD 2,515.1 million by 2023, growing at a CAGR of 41.3%.
What are the major growth factors of Urgent Care Apps Market?
The growth of this market is influenced by a number of factors, such as the increasing penetration of smartphones, growing penetration of 3G and 4G networks, rising focus on patient-centric healthcare delivery, and the benefits offered by urgent care apps. However, the wide usage of consumer instant messaging apps, poor internet connectivity in several countries, and the high volume of miscategorized apps on Android and Apple stores are the major factors that are expected to restrain the growth of this market during the forecast period.
Who all are the prominent players of Urgent Care Apps Market?
Prominent players in this market are Allm (Japan), Pulsara (US), Vocera Communications (US), PatientSafe Solutions (US), Voalte (US), Twiage (US), TigerConnect (US), Imprivata (US), Siilo (Netherlands), Forward Health (UK), Hospify (UK), Argusoft (US), Alayacare (US), Pivot Design Group (Canada), Medisafe (US), Smartpatient (Germany), and Johnson & Johnson (US).
To speak to our analyst for a discussion on the above findings, click Speak to Analyst
 Exclusive indicates content/data unique to MarketsandMarkets and not available with any competitors.
Table of Contents
1 Introduction (Page No. - 12)
1.1 Objectives of the Study
1.2 Market Definition
1.3 Market Scope
1.3.1 Markets Covered
1.3.2 Years Considered for the Study
1.4 Limitations
1.5 Currency
1.6 Stakeholders
2 Research Methodology (Page No. - 16)
2.1 Research Data
2.1.1 Secondary Data
2.1.2 Primary Data
2.1.2.1 Breakdown of Primary Interviews
2.1.2.2 Key Industry Insights
2.2 Market Size Estimation
2.2.1 Bottom-Up Approach
2.2.2 Top-Down Approach
2.3 Market Breakdown and Data Triangulation
2.4 Assumptions for the Study
3 Executive Summary (Page No. - 24)
4 Premium Insights (Page No. - 28)
4.1 Urgent Care Apps: Market Overview
4.2 Europe Urgent Care Apps Market, By Country & Type
4.3 Geographical Snapshot of the Urgent Care Apps Market
4.4 Urgent Care Apps Market: Regional Mix
5 Market Overview (Page No. - 32)
5.1 Introduction
5.2 Market Dynamics
5.2.1 Drivers
5.2.1.1 Ease of Communication
5.2.1.2 Cost-Containment in Healthcare Delivery
5.2.1.3 Increasing Penetration of Smartphones
5.2.1.4 Growing Penetration of 3G and 4G Networks
5.2.1.5 Rising Focus on Patient-Centric Healthcare Delivery
5.2.2 Restraints
5.2.2.1 Usage of Consumer Instant Messaging Apps
5.2.2.2 Poor Internet Connectivity in Several Countries
5.2.3 Opportunities
5.2.3.1 Emerging Markets
5.2.4 Challenges
5.2.4.1 High Volume of Miscategorized Apps on Android and Apple Stores
6 Industry Insights (Page No. - 38)
6.1 Introduction
6.2 End-User Demand Analysis
6.2.1 Demand Analysis for Emergency Care/Triaging Apps
6.2.2 Demand Analysis for In-Hospital Communication & Collaboration Apps
6.2.3 Demand Analysis for Post-Hospital Urgent Care Apps
6.3 Regulatory Analysis
6.4 Pricing Analysis
7 Urgent Care Apps Market, By Type (Page No. - 42)
7.1 Introduction
7.2 Pre-Hospital Emergency Care & Triaging Apps
7.3 In-Hospital Communication & Collaboration Apps
7.4 Post-Hospital Apps
7.4.1 Medication Management Apps
7.4.2 Rehabilitation Apps
7.4.3 Care Provider Communication & Collaboration Apps
8 Urgent Care Apps Market, By Clinical Area (Page No. - 54)
8.1 Introduction
8.2 Trauma
8.3 Stroke
8.4 Cardiac Conditions
8.5 Other Clinical Areas
9 Urgent Care Apps Market, By Region (Page No. - 63)
9.1 Introduction
9.2 North America
9.2.1 US
9.2.2 Canada
9.3 Europe
9.3.1 Germany
9.3.2 UK
9.3.3 Rest of Europe
9.4 Asia Pacific
9.4.1 Japan
9.4.2 China
9.4.3 India
9.4.4 Rest of APAC
9.5 Latin America
9.5.1 Brazil
9.5.2 Rest of Latin America
9.6 Middle East & Africa
10 Competitive Landscape (Page No. - 105)
10.1 Overview
10.2 Vendors Apps Comparison: Urgent Care Apps Market
10.3 In-Hospital Communication & Collaboration Apps Market Ranking Analysis, By Key Players
11 Company Profiles (Page No. - 114)
(Business Overview, Products Offered, Recent Developments, SWOT Analysis, MnM View)*
11.1 Allm Inc.
11.2 Pulsara
11.3 Vocera Communications
11.4 Tigerconnect
11.5 Twiage
11.6 Voalte
11.7 Patientsafe Solutions
11.8 Johnson & Johnson (Johnson & Johnson Health & Wellness Solutions, Inc.)
11.9 Imprivata
11.10 Siilo
11.11 Forward
11.12 Argusoft (Triagetrace)
11.13 Alayacare
11.14 Hospify
11.15 Pivot Design Group (Viatherapy)
11.16 Medisafe
11.17 Smartpatient (Mytherapy)
*Details on Business Overview, Products Offered, Recent Developments, SWOT Analysis, MnM View Might Not Be Captured in Case of Unlisted Companies.
12 Appendix (Page No. - 133)
12.1 Insights of Industry Experts
12.2 Discussion Guide
12.3 Knowledge Store: Marketsandmarkets’ Subscription Portal
12.4 Available Customizations
12.5 Related Reports
12.6 Author Details
List of Tables (93 Tables)
Table 1 Urgent Care Apps Market Snapshot
Table 2 Drivers, Restraints, Opportunities, and Challenges: Impact Analysis
Table 3 Countries With Low Internet Penetration Rate in 2014
Table 4 Pricing Structure: In-Hospital Communication & Collaboration Apps, By Region
Table 5 Urgent Care Apps Market, By Type, 2016–2023 (USD Million)
Table 6 Pre-Hospital Emergency Care & Triaging Apps Offered By Key Market Players
Table 7 Pre-Hospital Emergency Care & Triaging Apps Market, By Country/Region, 2016–2023 (USD Thousand)
Table 8 In-Hospital Communication & Collaboration Apps Offered By Key Market Players
Table 9 In-Hospital Communication & Collaboration Apps Market, By Country/Region, 2016–2023 (USD Million)
Table 10 Post-Hospital Apps Market, By Type, 2016–2023 (USD Million)
Table 11 Post-Hospital Apps Market, By Country/Region, 2016–2023 (USD Million)
Table 12 Medication Management Apps Offered By Key Market Players
Table 13 Medication Management Apps Market, By Country/Region, 2016–2023 (USD Million)
Table 14 Rehabilitation Apps Offered By Key Market Players
Table 15 Rehabilitation Apps Market, By Country/Region, 2016–2023 (USD Million)
Table 16 Care Provider Communication & Collaboration Apps Offered By Key Market Players
Table 17 Care Provider Communication & Collaboration Apps Market, By Country/Region, 2016–2023 (USD Million)
Table 18 Urgent Care Apps Market, By Clinical Area, 2016–2023 (USD Million)
Table 19 Urgent Care Apps Market for Trauma, By Country/Region, 2016–2023 (USD Million)
Table 20 Urgent Care Apps Market for Stroke, By Country/Region, 2016–2023 (USD Million)
Table 21 Urgent Care Apps Market for Cardiac Conditions, By Country/Region, 2016–2023 (USD Million)
Table 22 Urgent Care Apps Market for Other Clinical Areas, By Country/Region, 2016–2023 (USD Million)
Table 23 Urgent Care Apps Market, By Region, 2016–2023 (USD Million)
Table 24 North America: Urgent Care Apps Market, By Country, 2016–2023 (USD Million)
Table 25 North America: Urgent Care Apps Market, By Type, 2016–2023 (USD Million)
Table 26 North America: Post-Hospital Urgent Care Apps Market, 2016–2023 (USD Million)
Table 27 North America: Urgent Care Apps Market, By Clinical Area, 2016–2023 (USD Million)
Table 28 US: Major Players in the Urgent Care Apps Market
Table 29 US: Key Macroindicators
Table 30 US: Urgent Care Apps Market, By Type, 2016–2023 (USD Million)
Table 31 US: Post-Hospital Urgent Care Apps Market, 2016–2023 (USD Million)
Table 32 US: Urgent Care Apps Market, By Clinical Area, 2016–2023 (USD Million)
Table 33 Canada: Major Players in the Urgent Care Apps Market
Table 34 Canada: Key Macroindicators
Table 35 Canada: Urgent Care Apps Market, By Type, 2016–2023 (USD Million)
Table 36 Canada: Post-Hospital Urgent Care Apps Market, 2016–2023 (USD Million)
Table 37 Canada: Urgent Care Apps Market, By Clinical Area, 2016–2023 (USD Million)
Table 38 Europe: Urgent Care Apps Market, By Country/ Region, 2016–2023 (USD Million)
Table 39 Europe: Urgent Care Apps Market, By Type, 2016–2023 (USD Million)
Table 40 Europe: Post-Hospital Urgent Care Apps Market, By Type 2016–2023 (USD Million)
Table 41 Europe: Urgent Care Apps Market, By Clinical Area, 2016–2023 (USD Million)
Table 42 Germany: Major Players in the Urgent Care Apps Market
Table 43 Germany: Key Macroindicators
Table 44 Germany: Urgent Care Apps Market, By Type, 2016–2023 (USD Million)
Table 45 Germany: Post-Hospital Urgent Care Apps Market, 2016–2023 (USD Million)
Table 46 Germany: Urgent Care Apps Market, By Clinical Area, 2016–2023 (USD Million)
Table 47 UK: Major Players in the Urgent Care Apps Market
Table 48 UK: Key Macroindicators
Table 49 UK: Urgent Care Apps Market, By Type, 2016–2023 (USD Million)
Table 50 UK: Post-Hospital Urgent Care Apps Market, 2016–2023 (USD Million)
Table 51 UK: Urgent Care Apps Market, By Clinical Area, 2016–2023 (USD Million)
Table 52 RoE: Urgent Care Apps Market, By Type, 2016–2023 (USD Million)
Table 53 RoE: Post-Hospital Urgent Care Apps Market, 2016–2023 (USD Million)
Table 54 RoE: Urgent Care Apps Market, By Clinical Area, 2016–2023 (USD Million)
Table 55 APAC: Urgent Care Apps Market, By Country, 2016–2023 (USD Million)
Table 56 APAC: Urgent Care Apps Market, By Type, 2016–2023 (USD Million)
Table 57 APAC: Post-Hospital Urgent Care Apps Market, By Type, 2016–2023 (USD Million)
Table 58 APAC: Urgent Care Apps Market, By Clinical Area, 2016–2023 (USD Million)
Table 59 Japan: Major Players in the Urgent Care Apps Market
Table 60 Japan: Key Macroindicators
Table 61 Japan: Urgent Care Apps Market, By Type, 2016–2023 (USD Million)
Table 62 Japan: Post-Hospital Urgent Care Apps Market, 2016–2023 (USD Million)
Table 63 Japan: Urgent Care Apps Market, By Clinical Area, 2016–2023 (USD Million)
Table 64 China: Key Macroindicators
Table 65 China: Post-Hospital Urgent Care Apps Market, 2016–2023 (USD Million)
Table 66 China: Urgent Care Apps Market, By Clinical Area, 2016–2023 (USD Million)
Table 67 India: Key Macroindicators
Table 68 India: Post-Hospital Urgent Care Apps Market, 2016–2023 (USD Million)
Table 69 India: Urgent Care Apps Market, By Clinical Area, 2016–2023 (USD Million)
Table 70 RoAPAC: Urgent Care Apps Market, By Type, 2016–2023 (USD Million)
Table 71 RoAPAC: Post-Hospital Urgent Care Apps Market, 2016–2023 (USD Million)
Table 72 RoAPAC: Urgent Care Apps Market, By Clinical Area, 2016–2023 (USD Million)
Table 73 Latin America: Urgent Care Apps Market, By Country, 2016–2023 (USD Million)
Table 74 Latin America: Urgent Care Apps Market, By Type, 2016–2023 (USD Million)
Table 75 Latin America: Post-Hospital Urgent Care Apps Market, 2016–2023 (USD Million)
Table 76 Latin America: Urgent Care Apps Market, By Clinical Area, 2016–2023 (USD Million)
Table 77 Brazil: Macroeconomic Indicators
Table 78 Brazil: Urgent Care Apps Market, By Type, 2016–2023 (USD Million)
Table 79 Brazil: Post-Hospital Urgent Care Apps Market, 2016–2023 (USD Million)
Table 80 Brazil: Urgent Care Apps Market, By Clinical Area, 2016–2023 (USD Million)
Table 81 RoLA: Urgent Care Apps Market, By Type, 2016–2023 (USD Million)
Table 82 RoLA: Post-Hospital Urgent Care Apps Market, 2016–2023 (USD Million)
Table 83 RoLA: Urgent Care Apps Market, By Clinical Area, 2016–2023 (USD Million)
Table 84 Middle East & Africa: Urgent Care Apps Market, By Type, 2016–2023 (USD Million)
Table 85 Middle East & Africa: Post-Hospital Urgent Care Apps Market, 2016–2023 (USD Million)
Table 86 Middle East & Africa: Urgent Care Apps Market, By Clinical Area, 2016–2023 (USD Million)
Table 87 Growth Strategy Matrix (2015–2018)
Table 88 Features Comparison: Pre-Hospital Emergency Care & Triaging Apps Offered By Market Players
Table 89 Features Comparison: In-Hospital Communication and Collaboration Apps Offered By Key Market Players
Table 90 Features Comparison: Post-Hospital Care Provider Apps for Communication and Collaboration Offered By Key Market Players
Table 91 Features Comparison: Post-Hospital Rehabilitation Apps Offered By Key Market Players
Table 92 Features Comparison: Medication Management Apps Offered By Key Market Players
Table 93 In-Hospital Communication & Collaboration Apps Provider Ranking Analysis
List of Figures (32 Figures)
Figure 1 Urgent Care Apps Market Segmentation
Figure 2 Research Design
Figure 3 Secondary Research Approach
Figure 4 Primary Research Approach
Figure 5 Market Sizing Approach
Figure 6 Data Triangulation Methodology
Figure 7 Urgent Care Apps Market, By Type, 2018 vs 2023 (USD Million)
Figure 8 Post-Hospital Apps Market, By Type, 2018 vs 2023 (USD Million)
Figure 9 Urgent Care Apps Market, By Clinical Area, 2018 vs 2023 (USD Million)
Figure 10 North America Dominated the Urgent Care Apps Market in 2017
Figure 11 Ease of Communication and Cost-Containment in Healthcare Delivery are the Key Drivers for This Market
Figure 12 Germany Accounted for the Largest Market Share in 2017
Figure 13 US Commanded the Largest Share of the Urgent Care Apps Market in 2017
Figure 14 Latin America to Register the Highest CAGR During the Forecast Period
Figure 15 Smartphone Users and Penetration Worldwide, 2013 to 2018
Figure 16 Number of High-Speed Mobile Broadband Subscribers (Million)
Figure 17 In-Hospital Communication & Collaboration Apps: Feature Demand Assessment
Figure 18 Post-Hospital Apps Segment to Witness the Highest Growth Rate During the Forecast Period
Figure 19 Urgent Care Apps Market for Stroke to Witness the Highest Growth Rate During the Forecast Period
Figure 20 Distribution of Global Injury Mortality, By Cause
Figure 21 Age-Adjusted Death Rate Due to Stroke, By Country, 2017 (Estimated)
Figure 22 Number of Liver Transplants, By Country, 2015–2017
Figure 23 Number of Kidney Transplants, By Country, 2015–2017
Figure 24 Urgent Care Apps Market: Growth Rates, By Country/Region
Figure 25 Number of Smartphone Users in North America, 2014–2019 (Million)
Figure 26 North America: Urgent Care Apps Market Snapshot
Figure 27 Europe: Urgent Care Apps Market Snapshot
Figure 28 Asia Pacific: Urgent Care Apps Market Snapshot
Figure 29 Road Traffic Injury Death, (Per 100,000 Population)
Figure 30 Key Developments in the Urgent Care Apps Market Between January 2015 and July 2018
Figure 31 Vocera Communications: Company Snapshot (2017)
Figure 32 Johnson & Johnson: Company Snapshot (2017)

 Generating Response ...


Growth opportunities and latent adjacency in Urgent Care Apps Market