Water Clarifiers Market by Type (Flocculants, Organic Coagulants, Inorganic Coagulants, pH stabilizers), End-use Industry (Municipal, Pulp & Paper, Textiles, Petrochemicals, Metals & Mining), and Region - Global Forecast to 2022


[129 Pages Report] Water Clarifiers Market was valued at USD 4.89 Billion in 2016 and is projected to reach USD 7.43 Billion by 2022, at a CAGR of 6.6% during the forecast period. The base year considered for the study is 2016 while the forecast period is between 2017 and 2022. The water clarifiers market is driven by declining freshwater resources, and stringent regulatory and sustainability mandates concerning the environment.
The main objective of the study is to define, describe, and forecast the water clarifiers market on the basis of type, end-use industry, and region. The report includes detailed information about the major factors (drivers, restraints, and opportunities) influencing the growth of the market. The report strategically analyzes market segments with respect to individual growth trends, prospects, and contribution to the total market. The report includes analysis of the water clarifiers market on the basis of type (flocculant, organic and inorganic coagulant), end-use industry (municipal, pulp & paper, textile, petrochemicals, metals & mining, and other industrials), and region (APAC, Europe, North America, Middle East & Africa, and South America). The market size of water clarifiers was estimated in terms of both, value and volume.
Both, top-down and bottom-up approaches were used to estimate and validate the size of the global water clarifiers market, and to estimate the size of various other dependent submarkets. Extensive secondary sources, directories, and databases, such as World Bank, MineralsUK, International Atomic Energy Agency, World Nuclear Associations, Association Pulp Dan Kertas Indonesia, Bloomberg, Factiva, Organization for Economic Co-operation and Development (OECD), Securities and Exchange Commission (SEC), and other government and private websites were involved in identifying and collecting information useful for this technical, market-oriented, and commercial study of the water clarifiers market.

Some of the major market players active in the global water clarifiers market include SNF Floerger (France), Kemira OYJ (Finland), BASF SE (Germany), Ecolab Inc. (US), Solenis LLC (US), Buckman Laboratories, Inc. (US), Feralco AB (Sweden), Suez S.A. (France), Ixom Operations Pty Ltd. (Australia), and Kurita Water Industries Ltd. (Japan).
Key Target Audience:
- Manufacturers of Water Clarifiers
- Traders, Distributors, and Suppliers of Water Clarifiers
- Water Treatment Companies
- Raw Material Suppliers
- Government and Research Organizations
- Oil & Gas Companies
- Water Quality Associations
- Regional Manufacturers� Associations, and General Flocculant and Coagulant Associations
- Investment Research Firms
�The study answers several questions for the stakeholders, primarily which market segments to focus on in the next two-to-five years for prioritizing efforts and investments.�
Scope of the report:
This research report categorizes the global water clarifiers market based on type, end-use industry, and region.
Based on Type:
- Coagulant
- Organic Coagulant
- Polyamine
- PolyDADMAC
- Inorganic Coagulant
- Aluminum Sulfate
- Polyaluminum Chloride
- Ferric Chloride
- Others
- Organic Coagulant
- Flocculant
- Anionic
- Cationic
- Non-Ionic
- Amphoteric
- pH Stabilizers
Based on End-use Industry:
- Municipal
- Pulp & Paper
- Textile
- Petrochemicals
- Metals & Mining
- Other Industrials
Based on Region:
- APAC
- Europe
- North America
- Middle East & Africa
- South America
The market has been further analyzed for key countries in each of these regions.
Available Customizations:
Along with the market data, MarketsandMarkets offers customizations according to the company�s specific needs. The following customization options are available for the report:
End-use Industry Analysis
- Product matrix that gives a detailed analysis of various types of water clarifiers in each end-use industry
Regional Analysis
- A further breakdown of a region with respect to a country
Company Information
- Detailed analysis and profiling of additional market players (up to 5)
The global water clarifiers market is estimated to reach USD 7.43 Billion by 2022, at a CAGR of 6.6% from USD 5.39 Billion in 2017. The water clarifiers market has witnessed significant growth in recent years, owing to stringent regulations related to environment and water treatment. Increasing population and industrialization, coupled with declining freshwater resources has compelled governments of several countries to implement water treatment regulations, which, in turn, are driving the consumption of water clarifiers around the world.
Based on type, the water clarifiers market is segmented into coagulant, flocculant, and pH stabilizers. The coagulant segment is further classified into organic and inorganic. The inorganic subsegment led the coagulant segment in 2016, in terms of value and volume due to its wide applicability.
Water clarifiers are used in various end-use industries, such as municipal water treatment, pulp & paper, textile, petrochemicals, metals & mining, and others. On the basis of end-use industry, the municipal segment is projected to lead the water clarifiers market during the forecast period, in terms of both, volume and value. This can be attributed to the high volume of water required in countries such as China, India, Indonesia, Brazil, and the US.
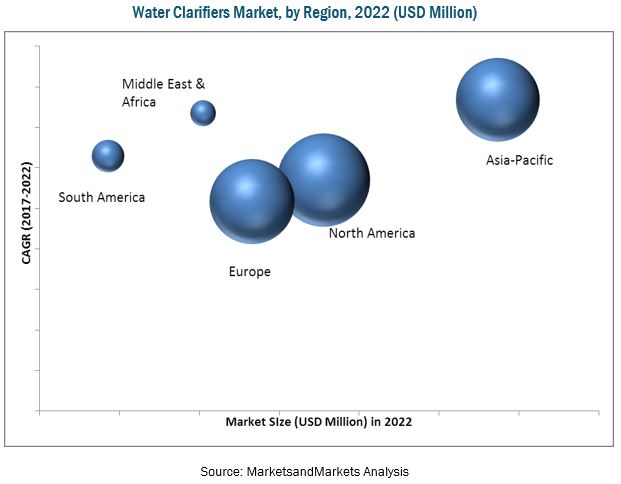
North America, Europe, Asia Pacific, Middle East & Africa, and South America have been considered as key markets for water clarifiers in the report. Asia Pacific is estimated to be the fastest-growing market for water clarifiers during the forecast period. The growth of this region can be attributed to huge consumption of water clarifiers in large industrial infrastructures in China, India, Japan, Indonesia, and several other Asia Pacific countries.

The water clarifiers market is expected to witness significant growth in the coming years. However, increasing adoption of alternative technologies, such as UV technologies and RO filtration could hinder the growth of this market.
SNF Floerger (France), Kemira OYJ (Finland), BASF SE (Germany), Ecolab Inc. (US), Solenis LLC (US), Buckman Laboratories, Inc. (US), Feralco AB (Sweden), Suez S.A. (France), Ixom Operations Pty Ltd. (Australia), and Kurita Water Industries Ltd. (Japan) are key companies operating in the water clarifiers market.
To speak to our analyst for a discussion on the above findings, click Speak to Analyst
 Exclusive indicates content/data unique to MarketsandMarkets and not available with any competitors.
Table of Contents
1 Introduction (Page No. - 13)
1.1 Objectives of the Study
1.2 Market Definition
1.3 Market Scope
1.3.1 Years Considered for the Study
1.4 Currency
1.5 Unit Considered
1.6 Stakeholders
1.7 Limitations
2 Research Methodology (Page No. - 16)
2.1 Research Data
2.1.1 Secondary Data
2.1.1.1 Key Data From Secondary Sources
2.1.1.2 Primary Data
2.1.1.3 Key Industry Insights
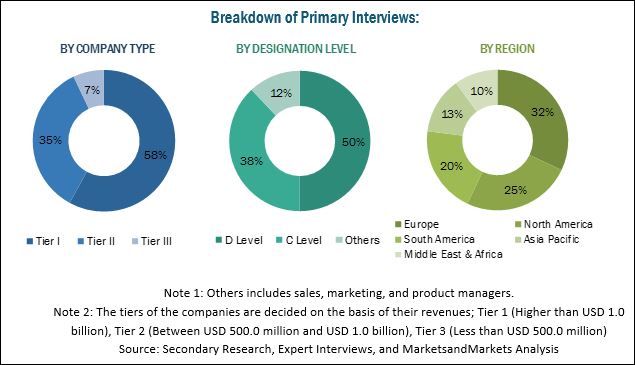
2.1.1.4 Breakdown of Primary Interviews
2.2 Market Size Estimation
2.3 Data Triangulation
2.4 Research Assumptions
3 Executive Summary (Page No. - 24)
4 Premium Insights (Page No. - 27)
4.1 Significant Opportunities in the Water Clarifiers Market
4.2 Water Clarifiers Market, By Type
4.3 Water Clarifiers Market, By End-Use Industry
4.4 Water Clarifiers Market Share, By Region
4.5 Water Clarifiers Market, By End-Use Industry and Region
5 Market Overview (Page No. - 30)
5.1 Introduction
5.2 Market Dynamics
5.2.1 Drivers
5.2.1.1 Depleting Freshwater Resources
5.2.1.2 Stringent Regulatory and Sustainability Mandates for Environment Safety
5.2.2 Restraints
5.2.2.1 Growing Demand for Alternate Water Treatment Technologies
5.2.3 Opportunities
5.2.3.1 Increasing Demand for Specific Formulations
5.2.3.2 Growing Population and Rapid Urbanization in the Emerging Economies
5.3 Porter�s Five Forces
5.3.1 Bargaining Power of Buyers
5.3.2 Bargaining Power of Suppliers
5.3.3 Threat of New Entrants
5.3.4 Threat of Substitutes
5.3.5 Intensity of Competitive Rivalry
6 Water Clarifiers Market, By Type (Page No. - 37)
6.1 Introduction
6.2 Coagulant
6.2.1 Organic Coagulant
6.2.1.1 Polyamine
6.2.1.2 Polydadmac
6.2.2 Inorganic Coagulant
6.2.2.1 Aluminum Sulfate
6.2.2.2 Polyaluminum Chloride
6.2.2.3 Ferric Chloride
6.2.2.4 Others
6.3 Flocculants
6.3.1 Anionic Flocculants
6.3.2 Cationic Flocculants
6.3.3 Non-Ionic Flocculants
6.3.4 Amphoteric Flocculants
6.4 Ph Stabilizers
7 Water Clarifiers Market, By End-Use Industry (Page No. - 43)
7.1 Introduction
7.2 Municipal
7.3 Pulp & Paper
7.4 Textile
7.5 Petrochemicals
7.6 Metals & Mining
7.7 Others
8 Water Clarifiers Market, By Region (Page No. - 48)
8.1 Introduction
8.2 North America
8.2.1 US
8.2.2 Canada
8.2.3 Mexico
8.3 APAC
8.3.1 China
8.3.2 Japan
8.3.3 India
8.3.4 South Korea
8.3.5 Indonesia
8.3.6 Australia & New Zealand
8.3.7 Rest of APAC
8.4 Europe
8.4.1 Germany
8.4.2 Russia
8.4.3 France
8.4.4 Italy
8.4.5 UK
8.4.6 Spain
8.4.7 Rest of Europe
8.5 Middle East & Africa
8.5.1 Saudi Arabia
8.5.2 South Africa
8.5.3 UAE
8.5.4 Rest of Middle East & Africa
8.6 South America
8.6.1 Brazil
8.6.2 Chile
8.6.3 Rest of South America
9 Competitive Landscape (Page No. - 92)
9.1 Introduction
9.2 Competitive Scenario
9.2.1 Expansion
9.2.2 Acquisition
9.2.3 New Product Launch
9.2.4 Agreement
9.3 Market Ranking of Key Players
9.3.1 Flocculants Market Ranking
9.3.2 Coagulant Market Ranking
10 Company Profiles (Page No. - 97)
(Business Overview, Products Offered, Recent Developments, SWOT Analysis, MnM View)*
10.1 Snf Floerger
10.2 Kemira Oyj
10.3 BASF SE
10.4 Ecolab Inc.
10.5 Solenis LLC
10.6 Buckman Laboratories, Inc.
10.7 Feralco AB
10.8 Ixom Operations Pty Ltd.
10.9 Kurita Water Industries Ltd.
10.10 Suez S.A.
*Details on Business Overview, Products Offered, Recent Developments, SWOT Analysis, MnM View Might Not Be Captured in Case of Unlisted Companies.
10.11 Other Key Players
10.11.1 Akferal Su Kimyasallari
10.11.2 Aries Chemical Inc.
10.11.3 Bauminas Quimica
10.11.4 Chemifloc
10.11.5 Chemtrade Logistics
10.11.6 Cytec Industries
10.11.7 Dew Speciality Chemicals
10.11.8 Donau Chemie Ag
10.11.9 GEO Specialty Chemicals, Inc.
10.11.10 Holland Company Inc.
10.11.11 Kronos Ecochem
10.11.12 Shandong Shuiheng Chemical
10.11.13 Usalco LLC
10.11.14 Wetico
10.11.15 Yixing Bluwat Chemicals Co. Ltd.
11 Appendix (Page No. - 120)
11.1 Insights From Industry Experts
11.2 Discussion Guide
11.3 Knowledge Store: Marketsandmarkets Subscription Portal
11.4 Introducing RT: Real-Time Market Intelligence
11.5 Available Customizations
11.6 Related Reports
11.7 Author Details
List of Tables (83 Tables)
Table 1 Water Clarifiers Market Size, By Type, 2015�2022 (Kiloton)
Table 2 Water Clarifiers Market Size, By Type, 2015�2022 (USD Million)
Table 3 Water Clarifiers Market Size, By End-Use Industry, 2015�2022 (USD Million)
Table 4 Water Clarifiers Market Size, By End-Use Industry, 2015�2022 (Kiloton)
Table 5 Water Clarifiers Market Size, By Region, 2015�2022 (USD Million)
Table 6 Water Clarifiers Market Size, By Region, 2015�2022 (Kiloton)
Table 7 North America: By Market Size, By Country, 2015�2022 (USD Million)
Table 8 North America: By Market Size, By Country, 2015�2022 (Kiloton)
Table 9 North America: By Market Size, By End-Use Industry, 2015�2022 (USD Million)
Table 10 North America: By Market Size, By End-Use Industry, 2015�2022 (Kiloton)
Table 11 Macroeconomic Indicators of Key North American Countries
Table 12 US: Water Clarifiers Market Size, By End-Use Industry, 2015�2022 (USD Million)
Table 13 US: By Market Size, By End-Use Industry, 2015�2022 (Kiloton)
Table 14 Canada: By Market Size, By End-Use Industry, 2015�2022 (USD Million)
Table 15 Canada: By Market Size, By End-Use Industry, 2015�2022 (Kiloton)
Table 16 Mexico: By Market Size, By End-Use Industry, 2015�2022 (USD Million)
Table 17 Mexico: By Market Size, By End-Use Industry, 2015�2022 (Kiloton)
Table 18 APAC: By Market Size, By Country, 2015�2022 (USD Million)
Table 19 APAC: By Market Size, By Country, 2015�2022 (Kiloton)
Table 20 APAC: By Market Size, By End-Use Industry, 2015�2022 (USD Million)
Table 21 APAC: By Market Size, By End-Use Industry, 2015�2022 (Kiloton)
Table 22 Macroeconomic Indicators of Key APAC Countries
Table 23 China: By Market Size, By End-Use Industry, 2015�2022 (USD Million)
Table 24 China: By Market Size, By End-Use Industry, 2015�2022 (Kiloton)
Table 25 Japan: By Market Size, By End-Use Industry, 2015�2022 (USD Million)
Table 26 Japan: By Market Size, By End-Use Industry, 2015�2022 (Kiloton)
Table 27 India: By Market Size, By End-Use Industry, 2015�2022 (USD Million)
Table 28 India: By Market Size, By End-Use Industry, 2015�2022 (Kiloton)
Table 29 South Korea: Water Clarifiers Market Size, By End-Use Industry, 2015�2022 (USD Million)
Table 30 South Korea: Water Clarifiers Market Size, By End-Use Industry, 2015�2022 (Kiloton)
Table 31 Indonesia: Water Clarifiers Market Size, By End-Use Industry, 2015�2022 (USD Million)
Table 32 Indonesia: Water Clarifiers Market Size, By End-Use Industry, 2015�2022 (Kiloton)
Table 33 Australia & New Zealand: Water Clarifiers Market Size, By End-Use Industry, 2015�2022 (USD Million)
Table 34 Australia & New Zealand: Water Clarifiers Market Size, By End-Use Industry, 2015�2022 (Kiloton)
Table 35 Rest of APAC: Water Clarifiers Market Size, By End-Use Industry, 2015�2022 (USD Million)
Table 36 Rest of APAC: Water Clarifiers Market Size, By End-Use Industry, 2015�2022 (Kiloton)
Table 37 Europe: Water Clarifiers Market Size, By Country, 2015�2022 (USD Million)
Table 38 Europe: By Market Size, By Country, 2015�2022 (Kiloton)
Table 39 Europe: By Market Size, By End-Use Industry, 2015�2022 (USD Million)
Table 40 Europe: By Market Size, By End-Use Industry, 2015�2022 (Kiloton)
Table 41 Macroeconomic Indicators of Key European Countries
Table 42 Germany: By Market Size, By End-Use Industry, 2015�2022 (USD Million)
Table 43 Germany: By Market Size, By End-Use Industry, 2015�2022 (Kiloton)
Table 44 Russia: By Market Size, By End-Use Industry, 2015�2022 (USD Million)
Table 45 Russia: By Market Size, By End-Use Industry, 2015�2022 (Kiloton)
Table 46 France: By Market Size, By End-Use Industry, 2015�2022 (USD Million)
Table 47 France: By Market Size, By End-Use Industry, 2015�2022 (Kiloton)
Table 48 Italy: By Market Size, By End-Use Industry, 2015�2022 (USD Million)
Table 49 Italy: By Market Size, By End-Use Industry, 2015�2022 (Kiloton)
Table 50 UK: By Market Size, By End-Use Industry, 2015�2022 (USD Million)
Table 51 UK: By Market Size, By End-Use Industry, 2015�2022 (Kiloton)
Table 52 Spain: By Market Size, By End-Use Industry, 2015�2022 (USD Million)
Table 53 Spain: By Market Size, By End-Use Industry, 2015�2022 (Kiloton)
Table 54 Rest of Europe: By Market Size, By End-Use Industry, 2015�2022 (USD Million)
Table 55 Rest of Europe: By Market Size, By End-Use Industry, 2015�2022 (Kiloton)
Table 56 Middle East & Africa: By Market Size, By Country, 2015�2022 (USD Million)
Table 57 Middle East & Africa: By Market Size, By Country, 2015�2022 (Kiloton)
Table 58 Middle East & Africa: By Market Size, By End-Use Industry, 2015�2022 (USD Million)
Table 59 Middle East & Africa: By Market Size, By End-Use Industry, 2015�2022 (Kiloton)
Table 60 Macroeconomic Indicators of Key Middle East & Africa Countries
Table 61 Saudi Arabia: By Market Size, By End-Use Industry, 2015�2022 (USD Million)
Table 62 Saudi Arabia: By Market Size, By End-Use Industry, 2015�2022 (Kiloton)
Table 63 South Africa: By Market Size, By End-Use Industry, 2015�2022 (USD Million)
Table 64 South Africa: By Market Size, By End-Use Industry, 2015�2022 (Kiloton)
Table 65 UAE: By Market Size, By End-Use Industry, 2015�2022 (USD Million)
Table 66 UAE: By Market Size, By End-Use Industry, 2015�2022 (Kiloton)
Table 67 Rest of Middle East & Africa: By Market Size, By End-Use Industry, 2015�2022 (USD Million)
Table 68 Rest of Middle East & Africa: By Market Size, By End-Use Industry, 2015�2022 (Kiloton)
Table 69 South America: By Market Size, By Country, 2015�2022 (USD Million)
Table 70 South America: By Market Size, By Country, 2015�2022 (Kiloton)
Table 71 South America: By Market Size, By End-Use Industry, 2015�2022 (USD Million)
Table 72 South America: By Market Size, By End-Use Industry, 2015�2022 (Kiloton)
Table 73 Macroeconomic Indicators of Key South American Countries
Table 74 Brazil: By Market Size, By End-Use Industry, 2015�2022 (USD Million)
Table 75 Brazil: By Market Size, By End-Use Industry, 2015�2022 (Kiloton)
Table 76 Chile: By Market Size, By End-Use Industry, 2015�2022 (USD Million)
Table 77 Chile: By Market Size, By End-Use Industry, 2015�2022 (Kiloton)
Table 78 South America: By Market Size, By End-Use Industry, 2015�2022 (USD Million)
Table 79 South America: By Market Size, By End-Use Industry, 2015�2022 (Kiloton)
Table 80 Expansions, 2013�2017
Table 81 Acquisitions, 2013�2017
Table 82 New Product Launches, 2013�2017
Table 83 Agreements, 2013�2017
List of Figures (28 Figures)
Figure 1 Water Clarifiers Market: Research Design
Figure 2 Key Data From Primary Sources
Figure 3 Market Size Estimation: Bottom-Up Approach
Figure 4 Market Size Estimation: Top-Down Approach
Figure 5 Water Clarifiers Market: Data Triangulation
Figure 6 Flocculants to Lead the Water Clarifiers Market.
Figure 7 Municipal to Be the Largest End-Use Industry in the Water Clarifiers Market
Figure 8 APAC to Lead the Water Clarifiers Market
Figure 9 Coagulant to Dominate the Water Clarifiers Market
Figure 10 Metals & Mining to Be the Fastest-Growing End-Use Industry
Figure 11 APAC Accounted for the Largest Market Share in 2016
Figure 12 Municipal Was the Largest End-Use Industry in APAC Water Clarifiers Market, in 2016
Figure 13 Drivers, Restraints, and Opportunities in the Water Clarifiers Market
Figure 14 Water Clarifiers Market: Porter�s Five Forces Analysis
Figure 15 Coagulant to Be the Fastest-Growing Type During the Forecast Period
Figure 16 Municipal to Be the Largest End-Use Industry in Water Clarifiers Market
Figure 17 India to Register Highest CAGR in Water Clarifiers Market Between 2017 and 2022
Figure 18 Municipal to Be the Largest Consumer of Water Clarifiers in North America
Figure 19 Municipal is the Largest End-Use Industry in APAC
Figure 20 Germany to Be the Leading Water Clarifiers Market in Europe
Figure 21 Companies Adopted Expansion as the Key Growth Strategy, 2013�2017
Figure 22 Snf Floerger: Company Snapshot
Figure 23 Kemira: Company Snapshot
Figure 24 BASF: Company Snapshot
Figure 25 BASF: SWOT Analysis
Figure 26 Ecolab: Company Snapshot
Figure 27 Kurita Water Industries: Company Snapshot
Figure 28 Suez: Company Snapshot


Growth opportunities and latent adjacency in Water Clarifiers Market