Welding Gas/Shielding Gas Market by Type (Argon, Carbon dioxide), by Storage, Distribution & Transportation (Cylinder & Packaged Gas, Merchant Liquid/Bulk), by Application (Gas Metal Arc Welding, Tungsten Gas Arc Welding), by End-Use Industry - Global Forecast to 2020


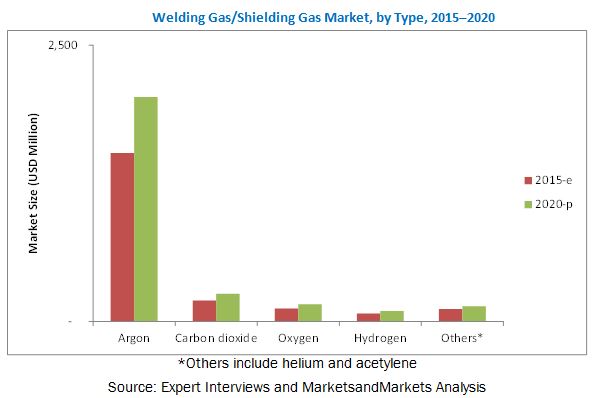
[242 Pages Report] The welding gas/shielding gas is estimated to grow from USD 2.02 Billion in 2015 to reach USD 2.66 Billion by 2020, at an estimated CAGR of 5.70%. The segments considered for this report are based on type, application, end-use industry, storage, distribution & transportation, and region. On the basis of type, argon accounted for the largest market share, in terms of value, and is also projected to witness the highest growth rate. The metal manufacturing & fabrication end-use industry segment accounted for the largest share of the market, in terms of both, volume and value, among all end-use industries. The storage, distribution & transportation segment was dominated by the cylinder & packaged gas distribution. In terms of application, the market is segmented into gas metal arc welding, gas tungsten arc welding, and others. The final segment, that is, region, consists of North America, Europe, Asia-Pacific, and Rest of the World (RoW). The base year considered for the study is 2014 and the market size is projected from 2015 to 2020.
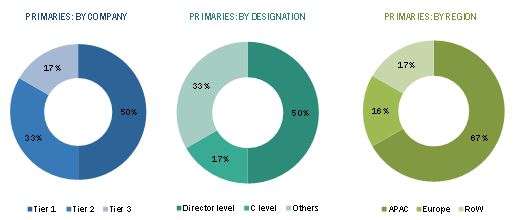
The research methodology used to estimate and forecast the market size was achieved through the top-down approach. The total market size of industrial gases was calculated. Accordingly, a certain percentage of the total market was allotted for welding gas/shielding gas. This allotment and calculation were done on the basis of extensive primary interviews and secondary research. Primary research involved in this report includes extensive interviews with key people such as CEOs, VPs, directors, and executives. After arriving at the overall market size, the total market was split into several segments and subsegments. These data triangulation and market breakdown procedures were employed to complete the overall market engineering process and arrive at the exact statistics for all segments and subsegments. The breakdown of profiles of the primaries is depicted in the below figure:
To know about the assumptions considered for the study, download the pdf brochure
The welding gas/shielding gas market is dominated by large players such as Air Products & Chemicals, Inc. (U.S.), The Linde Group (Germany), Praxair, Inc. (U.S.), Taiyo Nippon Sanso Corporation (Japan), and Air Liquide SA (France).
Target audience
- Welding gas/shielding gas manufacturers
- Industrial gas manufacturers
Scope of the Report
- The research report segments wedling gas/shielding gas into the following submarkets:
By Type:
- Argon
- Carbon dioxide
- Oxygen
- Hydrogen
- Others (Helium, Acetylene)
By End-Use Industry:
- Metal Manufacturing & Fabrication
- Construction
- Energy
- Aerospace
- Others (Automotive & transportation equipment)
By Application:
- Gas metal arc welding
- Gas tungsten arc welding
- Others (oxy-acetylene welding)
By Storage, Transportation & Distribution Mode:
- Cylinder & Packaged Gas Distribution
- Merchant Liquid/bulk Distribution
By Region:
- North America
- Europe
- Asia-Pacific
- RoW
Available Customizations
With the given market data, MarketsandMarkets offers customizations as per the company�s specific needs. The following customization options are available for the report:
Product Analysis
- Product Matrix which gives a detailed comparison of market for different recycled product types
Geographic Analysis
- Further analysis of the welding gas/shielding gas market for additional countries
Company Information
- Detailed analysis and profiling of additional market players (Up to 5).
MarketsandMarkets projects that the welding gas/shielding gas market is to grow from USD 2.02 Billion in 2015 to USD 2.66 Billion by 2020, at a CAGR of 5.70%. The market for welding gas/shieling gas industry is growing, courtesy of increasing applications of welding gas/shielding gas in the construction sector, growth in the aerospace industry, and rising demand for metal manufacturing & fabrication. Growing demand from the automotive industry also provides an opportunity to the market to further grow, especially in the emerging Asia-Pacific and Latin American regions.
The welding gas/shielding gas market is segmented on the basis of type, application, end-use industry, storage, transportation & distribution, and region. On the basis of type, the argon segment held the largest market share, in terms of value, and it is also projected to witness the highest growth rate. The metal manufacturing & fabrication segment accounted for the largest share of the market, in terms of both, volume and value, among all end-use industries. The storage, transportation & distribution segment was dominated by the cylinder & packaged gas distribution segment. In terms of application, the market is segmented into gas metal arc welding, gas tungsten arc welding, and others. The gas metal arc welding segment is projected to grow at the highest rate, during the forecast period.
On the basis of key regions, the market for welding gas/shielding gas is segmented into North America, Europe, Asia-Pacific, and Rest of the World (RoW). The Asia-Pacific region held the largest share among all regions in 2014. This is mainly due to emerging economies in China and India, coupled with growing applications of welding gas/shielding gas in the construction, energy, and automotive industries.
Mergers & acquisitions was the major strategy adopted by most players in the market. Companies such as Air Products & Chemicals, Inc. (U.S.), The Linde Group (Germany), Praxair, Inc. (U.S.), Taiyo Nippon Sanso Corporation (Japan), Air Liquide SA (France), Gulf Cryo (Bahrain), Iwatani Corporation (Japan), Taiyo Nippon Sanso Corporation (Japan), SIG Gases Berhad (Malaysia), and Messer Group GmbH (Germany) were the key players who adopted this strategy to increase the reach of their offerings, improve their production capacity, and establish focus on core operations. Companies aim to serve the market efficiently by investing in manufacturing facilities and acquiring distribution centers in the fast-growing regions.
To speak to our analyst for a discussion on the above findings, click Speak to Analyst
 Exclusive indicates content/data unique to MarketsandMarkets and not available with any competitors.
Table of Contents
1 Introduction (Page No. - 18)
1.1 Objectives of the Study
1.2 Market Definition
1.3 Study Scope
1.3.1 Periodization Considered for the Welding Gas/Shielding Gas Market
1.4 Currency Considered for the Welding Gas/Shielding Gas Market
1.5 Unit Considered for the Welding Gas/Shielding Gas Market
1.6 Stakeholders
2 Research Methodology (Page No. - 21)
2.1 Research Data
2.1.1 Secondary Data
2.1.1.1 Key Data From Secondary Sources
2.1.2 Primary Data
4 Premium Insights
2.1.2.2 Breakdown of Primary Interviews
2.2 Factor Analysis
2.2.1 Introduction
2.2.2 Demand-Side Analysis
2.2.2.1 Rising Population
2.2.2.2 Increasing Income and Spending Capacity
2.2.2.3 Industrialization
2.2.3 Supply-Side Analysis
2.2.3.1 Industry Regulations
2.2.3.2 Fluctuations in Fuel Prices
2.3 Market Size Estimation
2.4 Market Breakdown and Data Triangulation
2.5 Market Share Estimation
2.6 Research Assumptions and Limitations
2.6.1 Assumptions
2.6.2 Assumptions Made for This Study
2.6.3 Limitations
3 Executive Summary (Page No. - 36)
3.1 Metal Manufacturing & Fabrication is Projected to Account for the Largest Share By 2020
3.2 Asia-Pacific is Projected to Dominate the Global Welding Gas/Shielding Gas Market By 2020
3.3 China is Projected to Have the Highest CSGR From 2015 to 2020
4 Premium Insights (Page No. - 42)
4.1 Attractive Market Opportunities in the Welding Gas/Shielding Gas Market
4.2 Welding Gas/Shielding Gas Market in the Asia-Pacific Region
4.3 Emerging vs Developed Markets for Welding Gas/Shielding Gas, 2015 to 2020
5 Market Overview (Page No. - 48)
5.1 Introduction
5.2 Market Evolution
5.3 Market Dynamics
5.3.1 Drivers
5.3.1.1 Growth in the Metal and Manufacturing Industries
5.3.1.2 Growing Demand for Aluminum
5.3.1.3 Growing Energy Industry
5.3.2 Restraints
5.3.2.1 Environmental Impacts of Welding Gas/Shielding Gas
5.3.2.2 Structural and Regulatory Restrictions
5.3.2.3 Uncerta in Economic Conditions and Declining Demand in Steel Industry
5.3.3 Opportunities
5.3.3.1 High Demand in the Automotive Industry
5.3.4 Challenges
5.3.4.1 Intricate Manufacturing Process
6 Industry Trends (Page No. - 58)
6.1 Introduction
6.2 Value Chain
6.3 Porter�s Five Forces Analysis
6.3.1 Threat of New Entrants
6.3.2 Threats of Substitutes
6.3.3 Bargaining Power of Suppliers
6.3.4 Bargaining Power of Buyers
6.3.5 Intensity of Competitive Rivalry
7 Welding Gas/Shielding Gas Market, By End-Use Industry (Page No. - 64)
7.1 Introduction
7.2 Metal Manufacturing & Fabrication
7.3 Construction
7.4 Energy
7.5 Aerospace
7.6 Others
8 Welding Gas/Shielding Gas Market, By Storage, Distribution & Transportation (Page No. - 68)
8.1 Introduction
8.2 Cylinder & Packaged Gas
8.3 Merchant Liquid/Bulk
9 Welding Gas/Shielding Gas Market, By Type (Page No. - 73)
9.1 Introduction
9.2 Argon
9.3 Oxygen
9.4 Hydrogen
9.5 Carbon Dioxide
9.6 Other Gas Types
10 Welding Gas/Shielding Gas Market, By Application (Page No. - 79)
10.1 Introduction
10.2 Gas Metal Arc Welding
10.3 Gas Tungsten Arc Welding
10.4 Others
11 Welding Gas/Shielding Gas Market, By Region (Page No. - 83)
11.1 Introduction
11.2 Asia-Pacific
11.2.1 China
11.2.2 India
11.2.3 South Korea
11.2.4 Japan
11.2.5 Rest of Asia-Pacific
11.3 North America
11.3.1 U.S.
11.3.2 Canada
11.3.3 Mexico
11.4 Europe
11.4.1 Germany
11.4.2 France
11.4.3 Italy
11.4.4 U.K.
11.4.5 Rest of Europe
11.5 Rest of the World (RoW)
11.5.1 Brazil
11.5.2 South Africa
11.5.3 Argentina
11.5.4 Other RoW Countries
12 Competitive Landscape (Page No. - 177)
12.1 Overview
12.2 Development Analysis
12.3 Competitive Situations & Trends
12.4 Key Growth Strategies, 2011�2015
12.4.1 Mergers & Acquisitions
12.4.2 Expansions
12.4.3 Agreements, Partnerships, Contracts, and Joint Ventures, 2011-2015
12.4.4 New Product Launches
13 Company Profile (Page No. - 185)
13.1 Introduction
13.2 Air Liquide S.A.
13.2.1 Business Overview
13.2.2 Products Offered
13.2.3 Recent Developments
13.2.4 MnM View
13.2.4.1 SWOT Analysis
13.3 Air Products and Chemicals, Inc.
13.3.1 Business Overview
13.3.2 Products Offered
13.3.3 Recent Developments
13.3.4 MnM View
13.3.4.1 SWOT Analysis
13.4 Iwatani Corporation
13.4.1 Business Overview
13.4.2 Products Offered
13.4.3 Recent Developments
13.5 Praxair Inc.
13.5.1 Business Overview
13.5.2 Products Offered
13.5.3 Recent Developments
13.5.4 MnM View
13.5.5 SWOT Analysis
13.6 The Linde Group
13.6.1 Business Overview
13.6.2 Products Offered
13.6.3 Recent Developments
13.6.4 MnM View
13.6.5 SWOT Analysis
13.7 Southern Industrial Gas
13.7.1 Business Overview
13.7.2 Products Offered
13.7.3 Recent Developments
13.8 Taiyo Nippon Sanso Corporation
13.8.1 Business Overview
13.8.2 Products Offered
13.8.3 Recent Developments
13.8.4 SWOT Analysis
13.8.5 MnM View
13.9 Messer Group
13.9.1 Business Overview
13.9.2 Products Offered
13.9.3 Recent Developments
13.10 Gulf Cryo
13.10.1 Business Overview
13.10.2 Products Offered
13.10.3 Recent Developments
13.11 Iceblick Ltd.
13.11.1 Business Overview
13.11.2 Products Offered
14 Appendix (Page No. - 212)
14.1 Insights of Industry Experts
14.2 Discussion Guide
14.3 Company Developments
14.3.1 Agreements, Partnerships, Contracts & Joint Ventures
14.3.2 New Product Launches
14.3.3 Expansions
14.3.4 Mergers & Acquisitions
14.4 Introducing RT: Real-Time Market Intelligence
14.5 Available Customizations
List of Tables (192 Tables)
Table 1 Regulations for Welding Gas/Shielding Gas Storage, Distribution & Transportation
Table 2 Welding Gas/Shielding Gas Market Size, By End-Use Industry, 2013�2020 (USD Million)
Table 3 Welding Shielding Gas Market Size, By End-Use Industry, 2013�2020 (Kilo Tons)
Table 4 Welding Gas Market Size, By Storage, Distribution & Transportation, 2013�2020 (USD Million)
Table 5 Market Size, By Storage, Distribution & Transportation, 2013�2020 (Kilo Tons)
Table 6 Regulations on Transportation and Storage of Gas Cylinders
Table 7 Market Size, By Type, 2013�2020 (USD Million)
Table 8 Market Size, By Type, 2013�2020 (Kilo Tons)
Table 9 Market Size, By Application, 2013�2020 (USD Million)
Table 10 Market Size, By Application, 2013�2020 (Kilo Tons)
Table 11 Market Size, By Region, 2013�2020 (USD Million)
Table 12 Market Size, By Region, 2013�2020 (Kilo Tons)
Table 13 Asia-Pacific: Welding Gas/Shielding Gas Market Size, By Country, 2013�2020 (USD Million)
Table 14 Asia-Pacific: Welding Shielding Gas Market Size, By Country, 2013�2020 (Kilo Tons)
Table 15 Asia-Pacific: Welding Gas Market Size, By End-Use Industry, 2013�2020 (USD Million)
Table 16 Asia-Pacific: Market Size, By End-Use Industry, 2013�2020 (Kilo Tons)
Table 17 Asia-Pacific: Market Size, By Storage, Distribution & Transportation, 2013�2020 (USD Million)
Table 18 Asia-Pacific: Market Size, By Storage, Distribution & Transportation, 2013�2020 (Kilo Tons)
Table 19 Asia-Pacific: Market Size, By Type, 2013�2020 (USD Million)
Table 20 Asia-Pacific: Market Size, By Type, 2013�2020 (Million Tons)
Table 21 Asia-Pacific: Market Size, By Application, 2013�2020 (USD Million)
Table 22 Asia-Pacific: Market Size, By Application, 2013�2020 (Kilo Tons)
Table 23 China: Welding Gas/Shielding Gas Market Size, By End-Use Industry, 2013�2020 (USD Million)
Table 24 China: Welding Shielding Gas Market Size, By End-Use Industry, 2013�2020 (Kilo Tons)
Table 25 China: Welding Gas Market Size, By Storage, Distribution & Transportation, 2013�2020 (USD Million)
Table 26 China: Market Size, By Storage, Distribution & Transportation, 2013�2020 (Million Tons)
Table 27 China: Market Size, By Type, 2013�2020 (USD Million)
Table 28 China: Market Size, By Type, 2013�2020 (Kilo Tons)
Table 29 China: Market Size, By Application, 2013�2020 (USD Million)
Table 30 China: Market Size, By Application, 2013�2020 (Kilo Tons)
Table 31 India: Welding Gas/Shielding Gas Market Size, By End-Use Industry, 2013�2020 (USD Million)
Table 32 India: Welding Shielding Gas Market Size, By End-Use Industry, 2013�2020 (Kilo Tons)
Table 33 India: Welding Gas Market Size, By Storage, Distribution & Transportation, 2013�2020 (USD Million)
Table 34 India: Market Size, By Storage, Distribution & Transportation, 2013�2020 (Million Tons)
Table 35 India: Market Size, By Type, 2013�2020 (USD Million)
Table 36 India: Market Size, By Type, 2013�2020 (Kilo Tons)
Table 37 India: Market Size, By Application, 2013�2020 (USD Million)
Table 38 India: Market Size, By Application, 2013�2020 (Kilo Tons)
Table 39 South Korea: Welding Gas/Shielding Gas Market Size, By End-Use Industry, 2013�2020 (USD Million)
Table 40 South Korea: Welding Shielding Gas Market Size, By End-Use Industry, 2013�2020 (Kilo Tons)
Table 41 South Korea: Welding Gas Market Size, By Storage, Distribution & Transportation, 2013�2020 (USD Million)
Table 42 South Korea: Market Size, By Storage, Distribution & Transportation, 2013�2020 (Kilo Tons)
Table 43 South Korea: Market Size, By Type, 2013�2020 (USD Million)
Table 44 South Korea: Market Size, By Type, 2013�2020 (Kilo Tons)
Table 45 South Korea: Market Size, By Application, 2013�2020 (USD Million)
Table 46 South Korea: Market Size, By Application, 2013�2020 (Kilo Tons)
Table 47 Japan: Welding Gas/Shielding Gas Market Size, By End-Use Industry, 2013�2020 (USD Million)
Table 48 Japan: Welding Shielding Gas Market Size, By End-Use Industry, 2013�2020 (Kilo Tons)
Table 49 Japan: Welding Gas Market Size, By Storage, Distribution & Transportation, 2013�2020 (USD Million)
Table 50 Japan: Market Size, By Storage, Distribution & Transportation, 2013�2020 (Kilo Tons)
Table 51 Japan: Market Size, By Type, 2013�2020 (USD Million)
Table 52 Japan: Market Size, By Type , 2013�2020 (Kilo Tons)
Table 53 Japan: Market Size, By Application, 2013�2020 (USD Million)
Table 54 Japan: Market Size, By Application, 2013�2020 (Kilo Tons)
Table 55 Rest of Asia-Pacific: Welding Gas/Shielding Gas Market Size, By End-Use Industry, 2013�2020 (USD Million)
Table 56 Rest of Asia-Pacific: Welding Shielding Gas Market Size, By End-Use Industry, 2013�2020 (Kilo Tons)
Table 57 Rest of Asia-Pacific: Welding Gas Market Size, By Storage, Distribution & Transportation, 2013�2020 (USD Million)
Table 58 Rest of Asia-Pacific: Market Size, By Storage, Distribution & Transportation, 2013�2020 (Kilo Tons)
Table 59 Rest of Asia-Pacific: Market Size, By Type, 2013�2020 (USD Million)
Table 60 Rest of Asia-Pacific: Market Size, By Type, 2013�2020 (Kilo Tons)
Table 61 Rest of Asia-Pacific: Market Size, By Application, 2013�2020 (USD Million)
Table 62 Rest of Asia-Pacific: Market Size, By Application, 2013�2020 (Kilo Tons)
Table 63 North America: Welding Gas/Shielding Gas Market Size, By Country, 2013�2020 (USD Million)
Table 64 North America: Welding Shielding Gas Market Size, By Country, 2013�2020 (Million Tons)
Table 65 North America: Welding Gas Market Size, By End-Use Industry, 2013�2020 (USD Million)
Table 66 North America: Market Size, By End-Use Industry, 2013�2020 (Kilo Tons)
Table 67 North America: Market Size, By Storage, Distribution & Transportation, 2013�2020 (USD Million)
Table 68 North America: Market Size, By Storage, Distribution & Transportation, 2013�2020 (Kilo Tons)
Table 69 North America: Market Size, By Type, 2013�2020 (USD Million)
Table 70 North America: Market Size, By Type, 2013�2020 (Kilo Tons)
Table 71 North America: Market Size, By Application, 2013�2020 (USD Million)
Table 72 North America: Market Size, By Application, 2013�2020 (Kilo Tons)
Table 73 U.S.: Welding Gas/Shielding Gas Market Size, By End-Use Industry, 2013�2020 (USD Million)
Table 74 U.S.: Welding Shielding Gas Market Size, By End-Use Industry, 2013�2020 (Kilo Tons)
Table 75 U.S.: Welding Gas Market Size, By Storage, Distribution & Transportation, 2013�2020 (USD Million)
Table 76 U.S.: Market Size, By Storage, Distribution & Transportation, 2013�2020 (Kilo Tons)
Table 77 U.S.: Market Size, By Type 2013�2020 (USD Million)
Table 78 U.S.: Market Size, By Type, 2013�2020 (Kilo Tons)
Table 79 U.S.: Market Size, By Application, 2013�2020 (USD Million)
Table 80 U.S.: Market Size, By Application, 2013�2020 (Kilo Tons)
Table 81 Canada: Welding Gas/Shielding Gas Market Size, By End-Use Industry, 2013�2020 (USD Million)
Table 82 Canada: Welding Shielding Gas Market Size, By End-Use Industry, 2013�2020 (Kilo Tons)
Table 83 Canada: Welding Gas Market Size, By Storage, Distribution & Transportation, 2013�2020 (USD Million)
Table 84 Canada: Market Size, By Storage, Distribution & Transportation, 2013�2020 (Kilo Tons)
Table 85 Canada: Market Size, By Type, 2013�2020 (USD Million)
Table 86 Canada: Market Size, By Type, 2013�2020 (Kilo Tons)
Table 87 Canada: Market Size, By Application, 2013�2020 (USD Million)
Table 88 Canada: Market Size, By Application, 2013�2020 (Kilo Tons)
Table 89 Mexico: Welding Gas/Shielding Gas Market Size, By End-Use Industry, 2013�2020 (USD Million)
Table 90 Mexico: Welding Shielding Gas Market Size, By End-Use Industry, 2013�2020 (Kilo Tons)
Table 91 Mexico: Welding Gas Market Size, By Storage, Distribution & Transportation, 2013�2020 (USD Million)
Table 92 Mexico: Market Size, By Storage, Distribution & Transportation, 2013�2020 (Kilo Tons)
Table 93 Mexico: Market Size, By Type, 2013�2020 (USD Million)
Table 94 Mexico: Market Size, By Type, 2013�2020 (Kilo Tons)
Table 95 Mexico: Market Size, By Application, 2013�2020 (USD Million)
Table 96 Mexico: Market Size, By Application, 2013�2020 (Kilo Tons)
Table 97 Europe: Welding Gas/Shielding Gas Market Size, By Country, 2013�2020 (USD Million)
Table 98 Europe: Welding Shielding Gas Market Size, By Country, 2013�2020 (Kilo Tons)
Table 99 Europe: Welding Gas Market Size, By End-Use Industry, 2013�2020 (USD Million)
Table 100 Europe: Market Size, By End-Use Industry, 2013�2020 (Kilo Tons)
Table 101 Europe: Market Size, By Storage, Distribution & Transportation, 2013�2020 (USD Million)
Table 102 Europe: Market Size, By Storage, Distribution & Transportation, 2013�2020 (Kilo Tons)
Table 103 Europe: Market Size, By Type, 2013�2020 (USD Million)
Table 104 Europe: Market Size, By Type, 2013�2020 (Million Units)
Table 105 Europe: Market Size, By Application, 2013�2020 (USD Million)
Table 106 Europe: Market Size, By Application, 2013�2020 (Kilo Tons)
Table 107 Germany: Welding Gas/Shielding Gas Market Size, By End-Use Industry, 2013�2020 (USD Million)
Table 108 Germany: Welding Shielding Gas Market Size, By End-Use Industry, 2013�2020 (Kilo Tons)
Table 109 Germany: Welding Gas Market Size, By Storage, Distribution & Transportation, 2013�2020 (USD Million)
Table 110 Germany: Market Size, By Storage, Distribution & Transportation, 2013�2020 (Kilo Tons)
Table 111 Germany: Market Size, By Type, 2013�2020 (USD Million)
Table 112 Germany: Market Size, By Type, 2013�2020 (Kilo Tons)
Table 113 Germany: Market Size, By Application, 2013�2020 (USD Million)
Table 114 Germany: Market Size, By Application, 2013�2020 (Kilo Tons)
Table 115 France: Welding Gas/Shielding Gas Market Size, By End-Use Industry, 2013�2020 (USD Million)
Table 116 France: Welding Shielding Gas Market Size, By End-Use Industry, 2013�2020 (Kilo Tons)
Table 117 France: Welding Gas Market Size, By Storage, Distribution & Transportation, 2013�2020 (USD Million)
Table 118 France: Market Size, By Storage, Distribution & Transportation, 2013�2020 (Kilo Tons)
Table 119 France: Market Size, By Type, 2013�2020 (USD Million)
Table 120 France: Market Size, By Type, 2013�2020 (Kilo Tons)
Table 121 France: Market Size, By Application, 2013�2020 (USD Million)
Table 122 France: Market Size, By Application, 2013�2020 (Kilo Tons)
Table 123 Italy: Welding Gas/Shielding Gas Market Size, By End-Use Industry, 2013�2020 (USD Million)
Table 124 Italy: Welding Shielding Gas Market Size, By End-Use Industry, 2013�2020 (Kilo Tons)
Table 125 Italy: Welding Gas Market Size, By Storage, Distribution & Transportation, 2013�2020 (USD Million)
Table 126 Italy: Market Size, By Storage, Distribution & Transportation, 2013�2020 (Kilo Tons)
Table 127 Italy: Market Size, By Type, 2013�2020 (USD Million)
Table 128 Italy: Market Size, By Type, 2013�2020 (Kilo Tons)
Table 129 Italy: Market Size, By Application, 2013�2020 (USD Million)
Table 130 Italy: Market Size, By Application, 2013�2020 (Kilo Tons)
Table 131 U.K.: Welding Gas/Shielding Gas Market Size, By End-Use Industry, 2013�2020 (USD Million)
Table 132 U.K.: Welding Shielding Gas Market Size, By End-Use Industry, 2013�2020 (Kilo Tons)
Table 133 U.K.: Welding Gas Market Size, By Storage, Distribution & Transportation, 2013�2020 (USD Million)
Table 134 U.K.: Market Size, By Storage, Distribution & Transportation, 2013�2020 (Kilo Tons)
Table 135 U.K.: Market Size, Type, 2013�2020 (USD Million)
Table 136 U.K.: Market Size, By Type, 2013�2020 (Kilo Tons)
Table 137 U.K.: Market Size, By Application, 2013�2020 (USD Million)
Table 138 U.K.: Market Size, By Application, 2013�2020 (Kilo Tons)
Table 139 Rest of Europe: Welding Gas/Shielding Gas Market Size, By End-Use Industry, 2013�2020 (USD Million)
Table 140 Rest of Europe: Welding Shielding Gas Market Size, By End-Use Industry, 2013�2020 (Kilo Tons)
Table 141 Rest of Europe: Welding Gas Market Size, By Storage, Distribution & Transportation, 2013�2020 (USD Million)
Table 142 Rest of Europe: Market Size, By Storage, Distribution & Transportation, 2013�2020 (Kilo Tons)
Table 143 Rest of Europe: Market Size, By Type, 2013�2020 (USD Million)
Table 144 Rest of Europe: Market Size, By Type, 2013�2020 (Kilo Tons)
Table 145 Rest of Europe: Market Size, By Application, 2013�2020 (USD Million)
Table 146 Rest of Europe: Market Size, By Application, 2013�2020 (Kilo Tons)
Table 147 RoW: Welding Gas/Shielding Gas Market Size, By Country, 2013�2020 (USD Million)
Table 148 RoW: Welding Shielding Gas Market Size, By Country, 2013�2020 (Kilo Tons)
Table 149 RoW: Welding Gas Market Size, By End-Use Industry, 2013�2020 (USD Million)
Table 150 RoW: Market Size, By End-Use Industry, 2013�2020 (Kilo Tons)
Table 151 RoW: Market Size, By Storage, Distribution & Transportation, 2013�2020 (USD Million)
Table 152 RoW: Market Size, By Storage, Distribution & Transportation, 2013�2020 (Kilo Tons)
Table 153 RoW: Market Size, By Type, 2013�2020 (USD Million)
Table 154 RoW: Market Size, By Type, 2013�2020 (Kilo Tons)
Table 155 RoW: Market Size, By Application, 2013�2020 (USD Million)
Table 156 RoW: Market Size, By Application, 2013�2020 (Kilo Tons)
Table 157 Brazil: Welding Gas/Shielding Gas Market Size, By End-Use Industry, 2013�2020 (USD Million)
Table 158 Brazil: Welding Shielding Gas Market Size, By End-Use Industry, 2013�2020 (Kilo Tons)
Table 159 Brazil: Welding Gas Market Size, By Storage, Distribution & Transportation, 2013�2020 (USD Million)
Table 160 Brazil: Market Size, By Storage, Distribution & Transportation, 2013�2020 (Kilo Tons)
Table 161 Brazil: Market Size, By Type, 2013�2020 (USD Million)
Table 162 Brazil: Market Size, By Type, 2013�2020 (Kilo Tons)
Table 163 Brazil: Market Size, By Application, 2013�2020 (USD Million)
Table 164 Brazil: Market Size, By Application, 2013�2020 (Kilo Tons)
Table 165 South Africa: Welding Gas/Shielding Gas Market Size, By End-Use Industry, 2013�2020 (USD Million)
Table 166 South Africa: Welding Shielding Gas Market Size, By End-Use Industry, 2013�2020 (Kilo Tons)
Table 167 South Africa: Welding Gas Market Size, By Storage, Distribution & Transportation, 2013�2020 (USD Million)
Table 168 South Africa: Market Size, By Storage, Distribution & Transportation, 2013�2020 (Kilo Tons)
Table 169 South Africa: Market Size, By Type, 2013�2020 (USD Million)
Table 170 South Africa: Market Size, By Type, 2013�2020 (Kilo Tons)
Table 171 South Africa: Market Size, By Application, 2013�2020 (USD Million)
Table 172 South Africa: Market Size, By Application, 2013�2020 (Kilo Tons)
Table 173 Argentina: Welding Gas/Shielding Gas Market Size, By End-Use Industry, 2013�2020 (USD Million)
Table 174 Argentina: Welding Shielding Gas Market Size, By End-Use Industry, 2013�2020 (Kilo Tons)
Table 175 Argentina: Welding Gas Market Size, By Storage, Distribution & Transportation, 2013�2020 (USD Million)
Table 176 Argentina: Market Size, By Storage, Distribution & Transportation, 2013�2020 (Kilo Tons)
Table 177 Argentina: Market Size, By Type, 2013�2020 (USD Million)
Table 178 Argentina: Market Size, By Type, 2013�2020 (Kilo Tons)
Table 179 Argentina Market Size, By Application, 2013�2020 (USD Million)
Table 180 Argentina: Market Size, By Application, 2013�2020 (Kilo Tons)
Table 181 Other RoW Countries: Welding Gas/Shielding Gas Market Size, By End-Use Industry, 2013�2020 (USD Million)
Table 182 Other RoW Countries: Welding Shielding Gas Market Size, By End-Use Industry, 2013�2020 (Kilo Tons)
Table 183 Other RoW Countries: Welding Gas Market Size, By Storage, Distribution & Transportation, 2013�2020 (USD Million)
Table 184 Other RoW Countries: Market Size, By Storage, Distribution & Transportation, 2013�2020 (Kilo Tons)
Table 185 Other RoW Countries: Market Size, By Type, 2013�2020 (USD Million)
Table 186 Other RoW Countries: Market Size, By Type, 2013�2020 (Kilo Tons)
Table 187 Other RoW Countries: Market Size, By Application, 2013�2020 (USD Million)
Table 188 Other RoW Countries: Market Size, By Application, 2013�2020 (Kilo Tons)
Table 189 Mergers & Acquisitions, 2011�2015
Table 190 Expansions, 2011�2015
Table 191 Agreements, Partnerships, Contracts, and Joint Ventures, 2011-2015
Table 192 New Product Launches, 2011�2015
List of Figures (56 Figures)
Figure 1 Welding Gas/Shielding Gas Market: Research Design
Figure 2 Population Growth has Increased By 3 Billion in Three Decades
Figure 3 Increase in the Total Expenditure of Middle-Class Families
Figure 4 Growth in Manufacturing & Service Sectors
Figure 5 Crude Oil Spot Prices, 2004-2014
Figure 6 Natural Gas Prices, 2004-2014
Figure 7 Market Size Estimation Methodology: Bottom-Up Approach
Figure 8 Market Size Estimation Methodology: Top-Down Approach
Figure 9 Data Triangulation Methodology
Figure 10 Welding Gas/Shielding Gas Market Snapshot
Figure 11 Welding Shielding Gas Market Size, By End-Use Industry, 2015 vs 2020 (USD Million)
Figure 12 Welding Gas Market Size, By Region, 2015 vs 2020 (USD Million)
Figure 13 China is Projected to Be the Fastest-Growing Market for Welding Gas/Shielding Gas From 2015 to 2020
Figure 14 Gas Metal Arc Welding is Projected to Be the Leader in the Market Till 2020
Figure 15 Leading Market Players Adopted Mergers & Acquisitions as Key Strategy From 2011 to 2015
Figure 16 Emerging Economies Offer Attractive Opportunities in the Welding Gas/Shielding Gas Market
Figure 17 Metal Manufacturing & Fabrication Captured the Largest Share in the Emerging Asia-Pacific Market in 2014
Figure 18 Country-Wise Growth Potential of Welding Gas/Shielding Gas, 2015-2020 China Projected to Be the Fastest-Growing Country for Welding Gas/Shielding Gas, 2015-2020
Figure 19 Welding Gas/Shielding Gas Market: Region Wise Snapshot Asia-Pacific Occupied the Largest Market Share Among All Regions in 2014
Figure 20 Emerging Markets to Grow Faster Than Developed Markets, 2015-2020
Figure 21 Welding Gas/Shielding Gas Market: End-Use Industries Snapshot Metal Manufacturing & Fabrication Accounted for the Largest Share in 2014
Figure 22 Evolution of Industrial Gases Market
Figure 23 Increasing Demand From End-Use Industries is the Main Driver for the Market Growth of Welding Gas/Shielding Gas
Figure 24 Global Energy Demand
Figure 25 The Top Carbon Dioxide Emission Countries in the World in 2011
Figure 26 Standards By Compressed Gas Association
Figure 27 Global Vehicle Production From 2009 to 2014
Figure 28 Welding Gas/Shielding Gas Value Chain
Figure 29 Porter�s Five Forces Analysis
Figure 30 Metal Manufacturing & Fabrication Dominated the Market of Welding Gas/Shielding Gas in 2014
Figure 31 Cylinder & Packaged Gas Segment Dominated the Market of Welding Gas/Shielding Gas in 2015
Figure 32 Argon is Projected to Dominate the Market of Welding Gas/Shielding Gas
Figure 33 Gas Metal Arc Welding is Projected to Dominate the Market of Welding Gas/Shielding Gas
Figure 34 Geographical Snapshot: Market Growth Rate, CSGR (2015-2020)
Figure 35 China Market Poised to Grow at the Highest CSGR By 2020
Figure 36 Asia-Pacific: Market Snapshot
Figure 37 North America: Market Snapshot
Figure 38 Europe: Market Snapshot
Figure 39 RoW: Market Snapshot
Figure 40 Companies Adopted Expansions as Their Key Growth Strategy During the Studied Period (2011-2015)
Figure 41 Welding Gas/Shielding Gas Market Developments, By Key Player, 2014
Figure 42 2014 Was Observed to Be the Most Active Year for the Welding Gas/Shielding Gas Market
Figure 43 Geographic Revenue Mix of Top Five Players
Figure 44 Air Liquide S.A.: Company Snapshot
Figure 45 Air Liquide S.A.: SWOT Analysis
Figure 46 Air Products and Chemicals, Inc.: Company Snapshot
Figure 47 Air Products and Chemicals Inc.: SWOT Analysis
Figure 48 Iwatani Corporation.: Company Snapshot
Figure 49 Praxair Inc.: Company Snapshot
Figure 50 SWOT Analysis: Praxair Inc.
Figure 51 The Linde Group: Company Snapshot
Figure 52 SWOT Analysis: the Linde Group
Figure 53 Southern Industrial Gas Berhad: Company Snapshot
Figure 54 Taiyo Nippon Sanso: Company Snapshot
Figure 55 SWOT Analysis: Taiyo Nippon Sanso
Figure 56 Messer Group: Company Snapshot


Growth opportunities and latent adjacency in Welding Gas/Shielding Gas Market