Portable Filtration Systems Market by End-User (Power Generation, Manufacturing, Oil & Gas), Flow Rate (0–10, >10–20, >20–60, >60–100, and Above 100 GPM), Technology (Pressure, Centrifugal, and Vacuum Filtration), and Region - Global Forecast to 2022


[146 Pages Report] The global portable filtration systems market was valued at USD 495.5 Million in 2016 and is expected to grow at a CAGR of 3.93%, from 2017 to 2022. The portable filtration system is a type of offline filtration unit, where the fluid can be pumped out of the reservoir, passed through the filter, and is allowed to return in a continuous fashion, independent of the operation of the main hydraulic circuit. The portable units can be moved from one reservoir to another for servicing multiple machines. Factors, such as stringent government regulations aims at reducing environmental degradation across the world, upcoming power projects, and implementation of the filtration technology to reduce the emission of harmful pollutants in power plants coupled with rapid industrialization in emerging economies, thus driving growth in the market of portable filtration systems.
The years considered for the study are as follows:
- Base Year- 2016
- Estimated Year- 2017
- Projected Year- 2022
- Forecast Period- 2017 to 2022
The base year considered for company profiles is 2016. Whenever information was unavailable for the base year, the prior year has been considered.
Objectives of the Study:
- To provide detailed information on the major factors influencing the growth of the market (drivers, restraints, opportunities, and industry-specific challenges)
- To define, describe, analyze, segment, and forecast the global market by technology, end-user, flow rate, and region
- To forecast the revenue of market segments with respect to five main regions, namely, North America, Europe, Asia Pacific, South America, and the Middle East and Africa
- To analyze market opportunities for stakeholders in the market and draw a competitive landscape for market players
- To strategically analyze the market with respect to individual growth trends, future expansions, and contributions to the market
- To compare key market players with respect to market share, product specifications, and applications
Research Methodology
This research study involved the use of extensive secondary sources, directories, and databases, such as Hoover’s, Bloomberg Businessweek, Factiva, and OneSource, to identify and collect information useful for a technical, market-oriented, and commercial study of the global market. Primary sources are mainly industry experts from core and related industries, service providers, technology developers, standard and certification organizations of companies, and organizations related to all the segments of this industry’s value chain.
The points given below explain the research methodology.
- Study of the annual revenue and market developments of major players providing portable filtration systems
- Analysis of major end-users and demand for portable filtration systems
- Assessment of future trends and growth of portable filtration systems
- Assessment of the market with respect to the demand for different end-user segments
- Analysis of market trends in various regions or countries by studying the end-user application of portable filtration systems
- Study of contracts and developments related to portable filtration systems by key players across different regions
- Finalization of overall market sizes by triangulating the supply-side data, which includes product developments and annual revenues of companies providing portable filtration systems across the globe
After arriving at the overall market size, the total market has been split into several segments and sub-segments. The figure given below illustrates the breakdown of primaries conducted during the research study on the basis of company type, designation, and region.
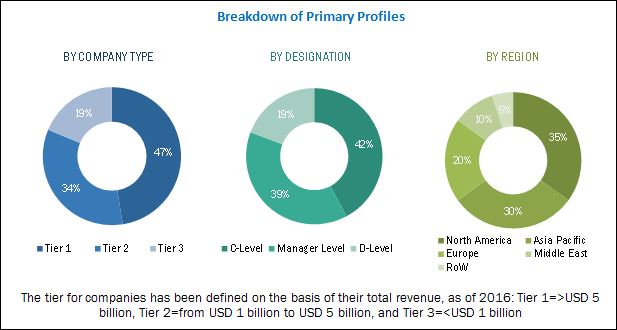
To know about the assumptions considered for the study, download the pdf brochure
Market Ecosystem
The ecosystem of portable filtration systems comprises companies such as Parker-Hannifin (US), Pall (US), Bosch Rexroth (Germany), Eaton (Ireland), Donaldson Company (US), HYDAC International (Germany), Walter Stauffenberg (Germany), and Y2K Fluid Power (US).
Target Audience:
The target audience for this report includes:
- Industry associations
- Manufacturers in end-use industries
- Manufacturing technology providers
- Portable filtration system manufacturers
- Portable filtration system providers
- Raw material suppliers
- Government agencies
- Investors and financial community professionals
- Market research and consulting firms
Scope of the Report
- Pressure Filtration
- Centrifugal Filtration
- Vacuum Filtration
- 0–10
- >10–20
- >20–60
- >60–100
- Above 100
- Power Generation
- Manufacturing
- Oil & Gas
- Paper and Pulp
- Petrochemicals
- Others
- Asia Pacific
- North America
- Europe
- Middle East & Africa
- South America
By Technology:
By Flow Rate (US GPM):
By End-User:
By Region:
Available Customizations
With the given market data, MarketsandMarkets offers customizations as per the client’s specific needs. The following customization options are available for this report:
Regional Analysis
Further breakdown of region- or country-specific analysis
Company Information
Detailed analysis and profiling of additional market players (up to five)
The global portable filtration systems market is projected to grow at a CAGR of 3.93%, from 2017 to 2022, to reach a market size of USD 621.4 Million by 2022. This growth is attributed to stringent environmental regulations aimed at reducing environmental degradation, growth of the power generation segment, and rising manufacturing activities, mainly in emerging economies.
The report segments the market, on the basis of technology, into pressure filtration, centrifugal filtration, and vacuum filtration. The pressure filtration segment led the market in 2016, and is projected to dominate the market during the forecast period. Moreover, the pressure filtration technology is preferred over centrifugal filtration as the latter only removes free water and has high initial and operating costs, which is driving the growth in the pressure filtration systems market.
The market has been segmented, based on flow rate, into 0 to 10, >10to 20, >20 to 60, >60 to 100, and above 100 GPM segments. The 0 to 10 GPM segment is the most common flow rate and has application in most industrial processes. Moreover, the comparatively less cost of small portable filtration systems with low flow rates and a high to medium viscosity range is driving the market for the 0 to 10 GPM segment.
The market has been segmented on the basis of end-user into manufacturing, power generation, oil & gas, paper and pulp, petrochemicals, and others. The power generation segment is the largest contributor to the market and also acts as a key driver of the market. The market is further driven by rapid industrialization and an increase in manufacturing activities, specifically in Asian countries, due to favorable government policies that have significantly boosted the growth of the manufacturing sector.
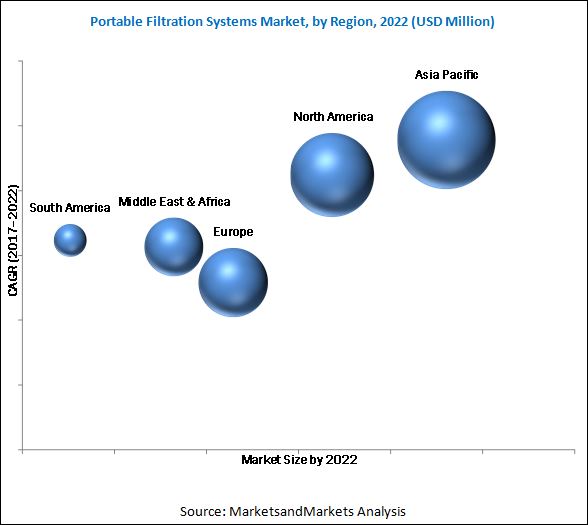
In this report, the market has been analyzed with respect to five regions, namely, North America, Europe, Asia Pacific, Middle East and Africa, and South America. The market in Asia Pacific is expected to dominate the global market, during the forecast period, owing to increase in power generation capacity and growth in the manufacturing sector in the region, especially in countries such as India and China.
Emerging alternate and renewable energy sources and availability of cheap alternatives could be the restraints for the market.
Leading players in the market are Parker-Hannifin (US), Pall (US), Bosch Rexroth (Germany), Eaton (Ireland), and Donaldson Company (US). New product launches was the strategy most commonly adopted by top players, constituting 49% of the total developments, from 2014 to September 2017. It was followed by mergers & acquisitions.
To speak to our analyst for a discussion on the above findings, click Speak to Analyst
 Exclusive indicates content/data unique to MarketsandMarkets and not available with any competitors.
Table of Contents
1 Introduction (Page No. - 14)
1.1 Objectives of the Study
1.2 Market Definition
1.3 Markets Covered
1.3.1 Years Considered for the Study
1.4 Currency
1.5 Stakeholders
2 Research Methodology (Page No. - 17)
2.1 Introduction
2.1.1 Secondary Data
2.1.1.1 Key Data From Secondary Sources
2.1.2 Primary Data
2.1.2.1 Key Data From Primary Sources
2.1.2.2 Key Industry Insights
2.1.2.3 Breakdown of Primaries
2.2 Market Size Estimation
2.2.1 Bottom-Up Approach
2.2.2 Top-Down Approach
2.3 Market Breakdown & Data Triangulation
2.4 Research Assumptions
2.5 Limitations
3 Executive Summary (Page No. - 25)
4 Premium Insights (Page No. - 30)
4.1 Attractive Opportunities in the Market
4.2 Market, By Country
4.3 Asia Pacific Market, By Technology & Countries
4.4 Market, By Flow Rate
4.5 Market, By End-User
5 Market Overview (Page No. - 34)
5.1 Introduction
5.2 Market Dynamics
5.2.1 Drivers
5.2.1.1 Stringent Environmental Regulations
5.2.1.2 Growth of the Power Generation Segment
5.2.1.3 Growing Rate of Manufacturing Activities
5.2.2 Restraints
5.2.2.1 Emerging Alternate and Renewable Energy Sources
5.2.2.2 Availability of Cheap Alternatives
5.2.3 Opportunities
5.2.3.1 Growing Demand for Smart Filtration
5.2.4 Challenges
5.2.4.1 Lack of Product Awareness
5.2.4.2 Fluctuating Raw Material Prices
6 Market, By End-User (Page No. - 40)
6.1 Introduction
6.2 Power Generation
6.3 Manufacturing
6.4 Oil & Gas
6.5 Paper & Pulp
6.6 Petrochemicals
6.7 Others
7 Market, By Flow Rate (Page No. - 47)
7.1 Introduction
7.2 0–10 GPM
7.3 >10–20 GPM
7.4 >20–60 GPM
7.5 >60–100 GPM
7.6 Above 100 GPM
8 Market, By Technology (Page No. - 53)
8.1 Introduction
8.2 Pressure Filtration
8.3 Centrifugal Filtration
8.4 Vacuum Filtration
9 Market, By Region (Page No. - 57)
9.1 Introduction
9.2 Asia Pacific
9.2.1 By Flow Rate
9.2.2 By Technology
9.2.3 By End-User
9.2.4 By Country
9.2.4.1 China
9.2.4.2 India
9.2.4.3 Japan
9.2.4.4 Australia
9.2.4.5 South Korea
9.2.4.6 Rest of Asia Pacific
9.3 North America
9.3.1 By Flow Rate
9.3.2 By Technology
9.3.3 By End-User
9.3.4 By Country
9.3.4.1 Us
9.3.4.2 Canada
9.4 Europe
9.4.1 By Flow Rate
9.4.2 By Technology
9.4.3 By End-User
9.4.4 By Country
9.4.4.1 Germany
9.4.4.2 France
9.4.4.3 Russia
9.4.4.4 Uk
9.4.4.5 Italy
9.4.4.6 Rest of Europe
9.5 Middle East & Africa
9.5.1 By Flow Rate
9.5.2 By Technology
9.5.3 By End-User
9.5.4 By Country
9.5.4.1 Saudi Arabia
9.5.4.2 UAE
9.5.4.3 Iran
9.5.4.4 South Africa
9.5.4.5 Rest of the Middle East & Africa
9.6 South America
9.6.1 By Flow Rate
9.6.2 By Technology
9.6.3 By End-User
9.6.4 By Country
9.6.4.1 Brazil
9.6.4.2 Argentina
9.6.4.3 Venezuela
9.6.4.4 Rest of South America
10 Competitive Landscape (Page No. - 92)
10.1 Introduction
10.2 Market Ranking Analysis, 2016
10.3 Competitive Situations & Trends
10.3.1 New Product Launches
10.3.2 Mergers & Acquisitions
10.3.3 Expansions & Investments
10.3.4 Partnerships
11 Company Profiles (Page No. - 97)
(Overview, Products and Services, Financials, Strategy & Development)*
11.1 Parker-Hannifin
11.2 Eaton
11.3 Donaldson Company
11.4 Pall
11.5 Bosch Rexroth
11.6 Bakercorp
11.7 Y2K
11.8 DES-Case
11.9 MP Filtri
11.10 Serfilco
11.11 Filtration Group
11.12 Hydac
11.13 Stauff
11.14 Trico Corporation
11.15 Norman
11.16 Como Filtration
*Details on Overview, Products and Services, Financials, Strategy & Development Might Not Be Captured in Case of Unlisted Companies
12 Appendix (Page No. - 137)
12.1 Insights of Industry Experts
12.2 Discussion Guide
12.3 Knowledge Store: Marketsandmarkets’ Subscription Portal
12.4 Introducing RT: Real-Time Market Intelligence
12.5 Available Customizations
12.6 Related Reports
12.7 Author Details
List of Tables (67 Tables)
Table 1 Portable Filtration System Market Snapshot
Table 2 Global Market Size, By End-User, 2015–2022 (USD Million)
Table 3 Power Generation: Portable Filtration System Market Size, By Region, 2015–2022 (USD Million)
Table 4 Manufacturing: Portable Filtration System Market Size, By Region, 2015–2022 (USD Million)
Table 5 Oil & Gas: Portable Filtration System Market Size, By Region, 2015–2022 (USD Million)
Table 6 Paper & Pulp: Portable Filtration System Market Size, By Region, 2015–2022 (USD Million)
Table 7 Petrochemicals: Portable Filtration System Market Size, By Region, 2015–2022 (USD Million)
Table 8 Others: Portable Filtration System Market Size, By Region, 2015–2022 (USD Million)
Table 9 Portable Filtration System Market Size, By Flow Rate, 2015–2022 (USD Million)
Table 10 0–10 GPM: Portable Filtration System Market Size, By Region, 2015–2022 (USD Million)
Table 11 >10–20: Market, By Region, 2015–2022 (USD Million)
Table 12 >20–60: Portable Filtration System Market Size, By Region, 2015–2022 (USD Million)
Table 13 >60–100: Portable Filtration System Market, By Region, 2015–2022 (USD Million)
Table 14 Above 100 GPM: Portable Filtration System Market Size, By Region, 2015–2022 (USD Million)
Table 15 Global Market Size, By Technology, 2015–2022 (USD Million)
Table 16 Pressure Filtration: Portable Filtration System Market Size, By Region, 2015–2022 (USD Million)
Table 17 Centrifugal Filtration: Portable Filtration System Market Size, By Region, 2015–2022 (USD Million)
Table 18 Vacuum Filtration: Portable Filtration System Market Size, By Region, 2015–2022 (USD Million)
Table 19 Global Market, By Region, 2015–2022 (USD Million)
Table 20 Asia Pacific: Portable Filtration System Market Size, By Flow Rate, 2015–2022 (USD Million)
Table 21 Asia Pacific: Portable Filtration System Market Size, By Technology, 2015–2022 (USD Million)
Table 22 Asia Pacific: Portable Filtration System Market Size, By End-User, 2015–2022 (USD Million)
Table 23 Asia Pacific: Portable Filtration System Market Size, By Country, 2015–2022 (USD Million)
Table 24 China: Portable Filtration System Market Size, By End-User, 2015–2022 (USD Million)
Table 25 India: Market Size, By End-User, 2015–2022 (USD Million)
Table 26 Japan: Market Size, By End-User, 2015–2022 (USD Million)
Table 27 Australia: Market Size, By End-User, 2015–2022 (USD Million)
Table 28 South Korea: Market Size, By End-User, 2015–2022 (USD Million)
Table 29 Rest of Asia Pacific: Market Size, By End-User, 2015–2022 (USD Million)
Table 30 North America: Market Size, By Flow Rate, 2015–2022 (USD Million)
Table 31 North America: Market Size, By Technology, 2015–2022 (USD Million)
Table 32 North America: Portable Filtration System Market Size, By End-User, 2015–2022 (USD Million)
Table 33 North America: Portable Filtration System Market Size, By Country, 2015–2022 (USD Million)
Table 34 US: Portable Filtration System Market Size, By End-User, 2015–2022 (USD Million)
Table 35 Canada: Portable Filtration System Market Size, By End-User, 2015–2022 (USD Million)
Table 36 Europe: Portable Filtration System Market Size, By Flow Rate, 2015–2022 (USD Million)
Table 37 Europe: Portable Filtration System Market Size, By Technology, 2015–2022 (USD Million)
Table 38 Europe: Portable Filtration System Market Size, By End-User, 2015–2022 (USD Million)
Table 39 Europe: Portable Filtration System Market Size, By End-User, 2015–2022 (USD Million)
Table 40 Germany: Portable Filtration System Market Size, By End-User, 2015–2022 (USD Million)
Table 41 France: Portable Filtration System Market Size, By End-User, 2015–2022 (USD Million)
Table 42 Russia: Portable Filtration System Market Size, By End-User, 2015–2022 (USD Million)
Table 43 UK: Portable Filtration System Market Size, By End-User, 2015–2022 (USD Million)
Table 44 Italy: Portable Filtration System Market Size, By End-User, 2015–2022 (USD Million)
Table 45 Rest of Europe: Portable Filtration System Market Size, By End-User, 2015–2022 (USD Million)
Table 46 Middle East & Africa: Portable Filtration System Market Size, By Flow Rate, 2015–2022 (USD Million)
Table 47 Middle East & Africa: Portable Filtration System Market Size, By Technology, 2015–2022 (USD Million)
Table 48 Middle East & Africa: Portable Filtration System Market Size, By End-User, 2015–2022 (USD Million)
Table 49 Middle East & Africa: Portable Filtration System Market Size, By Country, 2015–2022 (USD Million)
Table 50 Saudi Arabia: Portable Filtration System Market Size, By End-User, 2015–2022 (USD Million)
Table 51 UAE: Market Size, By End-User, 2015–2022 (USD Million)
Table 52 Iran: Market Size, By End-User, 2015–2022 (USD Million)
Table 53 South Africa: Market Size, By End-User, 2015–2022 (USD Million)
Table 54 Rest of the Middle East & Africa: Market Size, By End-User, 2015–2022 (USD Million)
Table 55 South America: Portable Filtration System Market Size, By Flow Rate, 2015–2022 (USD Million)
Table 56 South America: Portable Filtration System Market Size, By Technology, 2015–2022 (USD Million)
Table 57 South America: Portable Filtration System Market Size, By End-User, 2015–2022 (USD Million)
Table 58 South America: Portable Filtration System Market Size, By End-User, 2015–2022 (USD Million)
Table 59 Brazil: Portable Filtration System Market Size, By End-User, 2015–2022 (USD Million)
Table 60 Argentina: Portable Filtration System Market Size, By End-User, 2015–2022 (USD Thousand)
Table 61 Venezuela: Portable Filtration System Market Size, By End-User, 2015–2022 (USD Thousand)
Table 62 Rest of South America: Portable Filtration System Market Size, By End-User, 2015–2022 (USD Thousand)
Table 63 Market Ranking for Portable Filtration Systems, 2016
Table 64 New Product Launches, 2014–2017
Table 65 Mergers & Acquisitions, 2014–2017
Table 66 Expansions & Investments, 2014–2017
Table 67 Partnerships, 2014–2017
List of Figures (33 Figures)
Figure 1 Markets Covered: Market
Figure 2 Global Market: Research Design
Figure 3 Breakdown of Primary Interviews: By Company Type, Designation, & Region
Figure 4 Market Size Estimation Methodology: Bottom-Up Approach
Figure 5 Market Size Estimation Methodology: Top-Down Approach
Figure 6 Market: Market Estimation Approach & Data Triangulation Methodology
Figure 7 The Pressure Filtration Segment is Expected to Lead the Market, By Technology, During the Forecast Period
Figure 8 The 0–10 GPM Segment is Expected to Lead the Market, By Flow Rate, During the Forecast Period
Figure 9 The Power Generation End-User Segment is Expected to Lead the Market in 2017
Figure 10 Asia Pacific Led the Market in 2016
Figure 11 Increase in Power Generation Capacity and Growth in Manufacturing Activities in Developing Economies is Expected to Drive the Market During the Forecast Period
Figure 12 China is Expected to Lead the Market During the Forecast Period
Figure 13 The Pressure Filtration Segment has the Highest Market Share in Asia Pacific, 2016
Figure 14 The 0–10 GPM Segment to Dominate the Market for Portable Filtration Systems, By Flow Rate, During the Forecast Period
Figure 15 The Power Generation Segment to Dominate the Market During the Forecast Period
Figure 16 Market Dynamics: Market
Figure 17 Growth of World Manufacturing Output, By Quarter
Figure 18 World Net Electricity Generation, By Fuel, 2012–2040
Figure 19 The Power Generation Segment is Projected to Grow at the Highest CAGR, 2017–2022
Figure 20 The 0–10 GPM Segment is Expected to Lead the Market, By Flow Rate, During the Forecast Period
Figure 21 The Pressure Filtration Segment Led the Market in 2016
Figure 22 Market, By Region, 2017–2022 (USD Million)
Figure 23 Regional Snapshot: CAGR of the Market, 2017–2022
Figure 24 Asia Pacific: Market Snapshot
Figure 25 North America: Market Snapshot
Figure 26 Key Developments in the Portable Filtration Market, 2014–2017
Figure 27 Market Evaluation Framework: New Product Launches, Mergers & Acquisitions and Expansions Have Fueled the Growth of Companies, 2014–September 2017
Figure 28 Parker-Hannifin: Company Snapshot
Figure 29 Eaton: Company Snapshot
Figure 30 Donaldson: Company Snapshot
Figure 31 Pall: Company Snapshot
Figure 32 Bosch Rexroth: Company Snapshot
Figure 33 Bakercorp: Company Snapshot


Growth opportunities and latent adjacency in Portable Filtration Systems Market