Power Quality Meter Market by Application (Distribution Panels, Substation Monitoring, Equipment, and others), End-User (Industrial, Commercial, Utility, Transportation and Others), Phase, and Region - Global trends & forecasts to 2021


The global power quality meter market is estimated to have a market size of USD 870.5 Million in 2016, and is projected to grow at a CAGR of 7.5% from 2016 to 2021, to reach USD 1,252.0 million by 2021. Factors such as increasing investments in renewable power projects, surge in transmission & distribution expenditure, necessity to protect electrical components and networks, and increasing construction and industrial activities across the globe are few of the major drivers for the growth of the market.
The market is segmented by phase, application, end-user, and region.
The years considered for the study are as follows:
- Base Year: 2015
- Estimated Year: 2016
- Projected Year: 2021
- Forecast Period: 2016�2021
2015 has been considered as the base year for company profiles in the report. Wherever information was unavailable for the base year, the prior year has been considered.
Research Methodology
- Analysis of key operational and upcoming power quality awareness and installation projects across the globe, along with end-users and applications in which they are installed
- Analysis of country-wise distribution projects for the past 3 years
- Analysis of grid upgrades and integration across various regions
- Analysis of power infrastructure projects and trends related to construction and industrial activities across various regions
- Estimation of the installation cost of power quality meter in various regions using cost variance models
- Estimation of the total market size of power quality meter using the market engineering process
- Analysis of market trends in various regions/countries according to current power distribution spending in respective regions/countries
- Overall market size values have been finalized using the supply-side data, which includes recent market developments and annual global sales of power quality meters
After arriving at the overall market size, the total market has been split into several segments and subsegments. The figure given below provides a breakdown of primaries conducted during the research study, on the basis of company type, designation, and region.
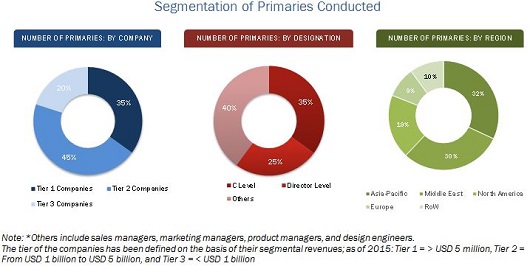
To know about the assumptions considered for the study, download the pdf brochure
Market Ecosystem:
The ecosystem of the power quality meter consists of the various stages, namely, raw material suppliers providing the various electrical components such as fiber ports, communication modules and others, meter manufacturers, deployment services, end-users, and post sales service provider. The components are manufactured and assembled according to the required specification of end-users by the meter manufacturer. The final product is configured before the final packaging of the product. The product is then introduced in the market through the process of distribution, marketing, and sales.

The Original Equipment Manufacturers (OEMs) of power quality meter include ABB Ltd. (Switzerland), Eaton Corporation (Ireland), General Electric (U.S.), Schneider Electric SE (France), and Siemens AG (Germany).
Target Audience:
- Power quality meter manufacturers, dealers, and suppliers
- Raw material providers
- Consulting companies in power sector
- Government and research organizations
- Government utility providers
- Private utility providers
- Private customers
- Network operators
- Metering companies
- Venture capital firms
- Investment banks
- Investment banks
�The study answers several questions for stakeholders, primarily which market segments to focus on in the next 2�5 years for prioritizing efforts and investments�.
Scope of the report:
By Phase
- Single Phase
- Three Phase
By End-User
- Industrial & Manufacturing
- Commercial
- Utilities
- Transportation
- Others (Labs and Research & Development Centers)
By Application
- Distribution Panels
- Substation Monitoring
- Equipment
- Others (Capacitor Banks and Reactors)
By Region
- North America
- South America
- Asia-Pacific
- Europe
- Middle East & Africa
Available Customizations:
With the given market data, MarketsandMarkets offers customizations as per the client�s specific needs. The following customization options are available for this report:
Company Information
- Detailed analysis and profiling of additional market players (Up to 5)
The global power quality meter market is projected to reach USD 1,252.0 Million by 2021, growing at a CAGR of 7.5% from 2016 to 2021. This growth can be attributed to the rising industrial & infrastructural activities and increasing upgradation of transmission & distribution infrastructure, triggered by the rising energy demand.
The report segments the power quality meter on the basis of phase into single and three phase. The three phase power quality meter segment is expected to grow at the highest CAGR during the forecast period. This can be attributed to the increasing investments in transmission & distribution infrastructure, renewable power plants, and industrial & infrastructural activities. However, the demand for single phase power quality meters is also set to increase as these are handheld and are portable, which gives them the edge over the three phase meters and as such are extensively used by electricians.
Based on end-user, the power quality meter has been segmented into industrial & manufacturing, commercial, utility, transportation sector, and others, which include lab and research & development applications. The industrial & manufacturing segment recorded the largest market size in 2015. Globally, industrial and manufacturing activities contribute approximately 30% of the economy. Consequently, reliable, efficient, and uninterrupted power supply becomes the inevitable requirement for the industrial facilities, nowadays. Any kind of power interruption or outages can affect crucial industrial operations and can result in huge losses. Developed economies in North America and Europe are facing the heat for the poor power quality and are investing huge amounts to curb the same.
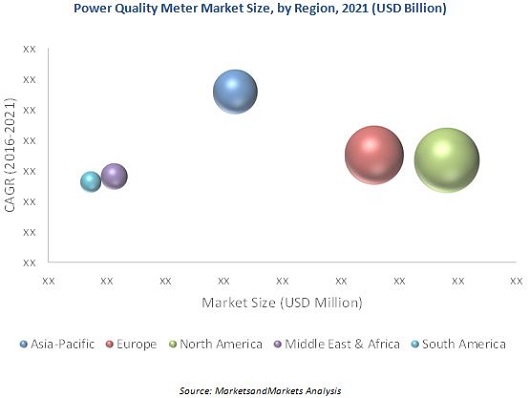
The Asia-Pacific power quality meter industry is estimated to have the highest growth rate, owing to the increased urbanization & industrialization, which propel the demand for power quality meters. China dominated the global market in 2015, on the account of extensive upgradation of electrical infrastructure and installation of new transmission & distribution lines. China and India are estimated to be the fastest growing markets for power quality meters in the region from 2016 to 2021. The figure given below indicates the market size of various regions by 2021, with their respective CAGRs during the forecast period.
The resistance of end-users toward the installation of new technologies is a major concern for utilities. Irrespective of the type of power quality meters, gaining customer�s confidence is very important. The prime reason behind such reluctance is lack of awareness on the importance of the quality measurement and testing equipment among consumers, which is the biggest barrier hindering the growth of the market.
Some of the leading players in the power quality meter market are ABB Ltd. (Switzerland), Siemens AG (Germany), General Electric (U.S.), Schneider Electric SE (France), and Siemens AG (Germany). New product launch was the most commonly used strategy by top players in the market from 2012 to 2016, followed by contracts & agreements, expansion, and other developments.
To speak to our analyst for a discussion on the above findings, click Speak to Analyst
 Exclusive indicates content/data unique to MarketsandMarkets and not available with any competitors.
Table of Contents
1 Introduction (Page No. - 13)
1.1 Objectives of the Study
1.2 Market Definition
1.3 Market Scope
1.3.1 Markets Covered
1.3.2 Years Considered for the Study
1.4 Currency
1.5 Limitations
1.6 Stakeholders
2 Research Methodology (Page No. - 16)
2.1 Research Data
2.1.1 Secondary Data
2.1.1.1 Key Data From Secondary Sources
2.1.2 Primary Data
2.1.2.1 Key Data From Primary Sources
2.1.2.2 Key Industry Insights
2.1.2.3 Breakdown of Primaries
2.2 Market Size Estimation
2.2.1 Bottom-Up Approach
2.2.2 Top-Down Approach
2.3 Market Breakdown & Data Triangulation
2.3.1 Key Data From Primary Sources
2.4 Research Assumptions
2.4.1 Assumptions
3 Executive Summary (Page No. - 25)
3.1 Introduction
3.1.1 Historical Background
3.1.2 Current Scenario
3.1.3 Conclusion
4 Premium Insights (Page No. - 31)
4.1 Attractive Market Opportunities in the Power Quality Meter Market
4.2 Power Quality Meter: Top End-User Segment
4.3 Power Quality Meter Industry in North America
4.4 Asia-Pacific is the Fastest Growing Power Quality Meter Industry
5 Market Overview (Page No. - 35)
5.1 Introduction
5.2 Market Segmentation
5.3 Market Dynamics
5.3.1 Drivers
5.3.1.1 Increasing Demand for Quality Power
5.3.1.2 Utilities are Looking Toward Enhancing Their Distribution Efficiency
5.3.1.3 High Economic Growth & Industrialization
5.3.1.4 Refurbishment of Old & Aging Distribution Infrastructure
5.3.2 Restraints
5.3.2.1 Lack of Consumer Awareness
5.3.2.2 Higher Installation Cost
5.3.3 Opportunities
5.3.3.1 Increasing Government Initiatives in the Emerging Economies
5.3.4 Challenges
5.3.4.1 Lack of Skilled Labor
5.3.4.2 Increasing Competition With Low Quality and Cheap Products From Gray Markets
5.4 Impact of Market Dynamics
6 Industry Trends (Page No. - 43)
6.1 Power Quality Meter: Value Chain
6.1.1 Key Influencers
6.2 Porter�s Five Forces Analysis
6.2.1 Threat of Substitutes
6.2.2 Threat of New Entrants
6.2.3 Bargaining Power of Buyers
6.2.4 Bargaining Power of Suppliers
6.2.5 Intensity of Rivalry
7 Power Quality Meter Market, By Application (Page No. - 47)
7.1 Introduction
7.2 Distribution Panel
7.3 Substation Monitoring
7.4 Equipment
7.5 Others
8 Power Quality Meter, By End-User (Page No. - 53)
8.1 Introduction
8.2 Industrial & Manufacturing
8.3 Commercial
8.4 Utility
8.5 Transportation
8.6 Others
9 Power Quality Meter, By Phase (Page No. - 62)
9.1 Introduction
9.1.1 Single Phase
9.1.2 Three Phase
10 Power Quality Meter, By Region (Page No. - 66)
10.1 Introduction
10.2 North America
10.2.1 U.S.
10.2.2 Canada
10.2.3 Mexico
10.3 Europe
10.3.1 Germany
10.3.2 U.K.
10.3.3 France
10.3.4 Italy
10.3.5 Rest of Europe
10.4 Asia-Pacific
10.4.1 China
10.4.2 Philippines
10.4.3 Thailand
10.4.4 Malaysia
10.4.5 India
10.4.6 Rest of Asia-Pacific
10.5 Middle East & Africa
10.5.1 Saudi Arabia
10.5.2 UAE
10.5.3 Kuwait
10.5.4 Qatar
10.5.5 South Africa
10.5.6 Rest of Middle East & Africa
10.6 South America
10.6.1 Brazil
10.6.2 Rest of South America
11 Competitive Landscape (Page No. - 98)
11.1 Overview
11.2 Competitive Situation & Trends
11.2.1 Contracts & Agreements
11.2.2 New Product/Technology Developments
11.2.3 Mergers & Acquisitions
11.2.4 Joint Ventures & Partnerships
11.2.5 Other Developments
12 Company Profiles (Page No. - 105)
(Company at A Glance, Business Overview, Products Offered, Key Strategy, Recent Developments, SWOT Analysis & MnM View)*
12.1 Introduction
12.2 Eaton Corporation
12.3 Danaher Corporation
12.4 General Electric
12.5 Schneider Electric
12.6 Siemens AG
12.7 ABB Ltd.
12.8 Accuenergy
12.9 Emerson Electric Co.
12.10 Honeywell International Inc.
12.11 Itron Inc.
12.12 Sensus
12.13 Wasion Group Holding Ltd.
12.14 Zhejiang Yongtailong Electronic Co. Ltd.
*Details on Company at A Glance, Recent Financials, Products Offered, Strategies & Insights, & Recent Developments Might Not Be Captured in Case of Unlisted Companies.
13 Appendix (Page No. - 134)
13.1 Insights of Industry Experts
13.2 Discussion Guide
13.3 Knowledge Store: Marketsandmarkets� Subscription Portal
13.4 Available Customizations
13.5 Introducing RT: Real-Time Market Intelligence
13.6 Related Reports
List of Tables (67 Tables)
Table 1 Impact of Market Dynamics
Table 2 Power Quality Meter Market Size, By Application, 2014�2021 (USD Million)
Table 3 Distribution Panel: Market Size, By Region, 2014�2021 (USD Million)
Table 4 Substation Monitoring: Market Size, By Region, 2014�2021 (USD Million)
Table 5 Equipment: Market Size, By Region, 2014�2021 (USD Million)
Table 6 Others: Market Size, By Region, 2014�2021 (USD Million)
Table 7 Market Size, By End-User, 2014�2021 (USD Million)
Table 8 Industrial & Manufacturing: Market Size, By Region, 2014�2021 (USD Million)
Table 9 Industrial & Manufacturing: Market Size, By Top Country, 2014�2021 (USD Million)
Table 10 Commercial: Market Size, By Region, 2014�2021 (USD Million)
Table 11 Commercial: Market Size, By Top Country, 2014�2021 (USD Million)
Table 12 Utility: Market Size, By Region, 2014�2021 (USD Million)
Table 13 Utility: Market Size, By Top Country, 2014�2021 (USD Million)
Table 14 Transportation: Market Size, By Region, 2014�2021 (USD Million)
Table 15 Transportation: Market Size, By Top Country, 2014�2021 (USD Million)
Table 16 Others: Market Size, By Region, 2014�2021 (USD Million)
Table 17 Market Size, By Phase, 2014�2021 (USD Million)
Table 18 Single Phase: Market Size, By Region, 2014�2021 (USD Million)
Table 19 Three Phase: Market Size, By Region, 2014�2021 (USD Million)
Table 20 Market Size, By Region, 2014�2021 (USD Million)
Table 21 North America: Market Size, By Country, 2014�2021 (USD Million)
Table 22 North America: Market Size, By Phase, 2014�2021 (USD Million)
Table 23 North America: Market Size, By End-User, 2014�2021 (USD Million)
Table 24 North America: Market Size, By Application, 2014�2021 (USD Million)
Table 25 U.S.: Market Size, By End-User, 2014�2021 (USD Million)
Table 26 Canada: Market Size, By End-User, 2014�2021 (USD Million)
Table 27 Mexico: Market Size, By End-User, 2014�2021 (USD Million)
Table 28 Europe: Market Size, By Country, 2014�2021 (USD Million)
Table 29 Europe: Market Size, By Phase, 2014�2021 (USD Million)
Table 30 Europe: Market Size, By End-User, 2014�2021 (USD Million)
Table 31 Europe: Market Size, By Application, 2014�2021 (USD Million)
Table 32 Germany: Market Size, By End-User, 2014�2021 (USD Million)
Table 33 U.K.: Market Size, By End-User, 2014�2021 (USD Million)
Table 34 France: Market Size, By End-User, 2014�2021 (USD Million)
Table 35 Italy: Market Size, By End-User, 2014�2021 (USD Million)
Table 36 Rest of Europe: Market Size, By End-User, 2014�2021 (USD Million)
Table 37 Asia-Pacific: Market Size, By Country, 2014�2021 (USD Million)
Table 38 Asia-Pacific: Market Size, By Phase, 2014�2021 (USD Million)
Table 39 Asia-Pacific: Market Size, By End-User, 2014�2021 (USD Million)
Table 40 Asia-Pacific: Market Size, By Application, 2014�2021 (USD Million)
Table 41 China: Market Size, By End-User, 2014�2021 (USD Million)
Table 42 Philippines: Market Size, By End-User, 2014�2021 (USD Million)
Table 43 Thailand: Market Size, By End-User, 2014�2021 (USD Million)
Table 44 Malaysia: Market Size, By End-User, 2014�2021 (USD Million)
Table 45 India: Market Size, By End-User, 2014�2021 (USD Million)
Table 46 Rest of Asia-Pacific: Market Size, By End-User, 2014�2021 (USD Million)
Table 47 Middle East & Africa: Market Size, By Country, 2014�2021 (USD Million)
Table 48 Middle East & Africa: Market Size, By Phase, 2014�2021 (USD Million)
Table 49 Middle East & Africa: Market Size, By End-User, 2014�2021 (USD Million)
Table 50 Middle East & Africa: Market Size, By Application, 2014�2021 (USD Million)
Table 51 Saudi Arabia: Market Size, By End-User, 2014�2021 (USD Million)
Table 52 UAE: Market Size, By End-User, 2014�2021 (USD Million)
Table 53 Kuwait: Market Size, By End-User, 2014�2021 (USD Million)
Table 54 Qatar: Market Size, By End-User, 2014�2021 (USD Million)
Table 55 South Africa: Market Size, By End-User, 2014�2021 (USD Million)
Table 56 Rest of Middle East & Africa: Market Size, By End-User, 2014�2021 (USD Million)
Table 57 South America: Market Size, By Country, 2014�2021 (USD Million)
Table 58 South America: Market Size, By Phase, 2014�2021 (USD Million)
Table 59 South America: Market Size, By End-User, 2014�2021 (USD Million)
Table 60 South America: Market Size, By Application, 2014�2021 (USD Million)
Table 61 Brazil: Market Size, By End-User, 2014�2021 (USD Million)
Table 62 Rest of South America: Market Size, By End-User, 2014�2021 (USD Million)
Table 63 Contracts & Agreements, 2013�2015
Table 64 New Product/Technology Developments, 2013�2016
Table 65 Mergers & Acquisitions, 2014�2016
Table 66 Joint Ventures & Partnerships, 2013�2016
Table 67 Other Developments, 2013�2015
List of Figures (46 Figures)
Figure 1 Power Quality Meter Segmentation
Figure 2 Power Quality Meter: Research Design
Figure 3 Market Size Estimation Methodology: Bottom-Up Approach
Figure 4 Market Size Estimation Methodology: Top-Down Approach
Figure 5 Data Triangulation Methodology
Figure 6 North America Occupied the Largest Market Share in 2015
Figure 7 Market Snapshot (2016 vs 2021): Asia-Pacific is Expected to Exhibit the Highest Growth Rate During 2016�2021
Figure 8 Market Share (Value), By End-User, 2015
Figure 9 Three Phase Power Quality Meter Segment Would Continue to Dominate the Market During 2016�2021
Figure 10 Market Size, 2016 & 2021 (USD Million)
Figure 11 Rise in Industrial & Commercial Facilities Would Boost the Power Quality Meter
Figure 12 Smart Meters are Expected to Lead the Demand for Power Quality Meters During 2016�2021
Figure 13 Residential Applications Accounted for the Maximum Share in the Power Quality Meter
Figure 14 North America Commanded the Major Share of the Market in 2015
Figure 15 Market Segmentation: Power Quality Meter
Figure 16 Market Dynamics
Figure 17 Power Quality Meter: Value Chain (2015)
Figure 18 Porter�s Five Force Analysis: Power Quality Meter
Figure 19 Industrialization & Revamp of the Older & Aged Distribution Networks Boost the Power Quality Meter
Figure 20 Utility Sector is the Fastest Growing Segment in the Global Power Quality Meter, 2016�2021
Figure 21 Market Share (Value), By Phase, 2015
Figure 22 Asia-Pacific is the Fastest Growing Region in the Single Phase Power Quality Meter
Figure 23 Regional Snapshot: Asia-Pacific to Be the Fastest Growing Market, in Terms of Value, During the Forecast Period
Figure 24 Market Share (Value), By Region, 2015
Figure 25 North America & Europe are Projected to Dominate the Power Quality Meter During the Forecast Period
Figure 26 North America Power Quality Meter: Regional Snapshot
Figure 27 Companies Adopted Contracts & Agreements and New Product Launches to Capture the Market ,2013-Till March 2016
Figure 28 Battle for Market Share: Contracts & Agreements and New Product Launches Were the Key Strategies, 2013�2016
Figure 29 Danaher Corporation Accounted for the Maximum Share in the Power Quality Meter, 2015
Figure 30 Market Evaluation Framework: Contracts & Agreements and New Product Launches Fuelled the Growth of Companies From 2013 to 2016
Figure 31 Region-Wise Revenue Mix of the Major Players in the Market
Figure 32 Eaton Corporation: Company Snapshot
Figure 33 Eaton Corporation: SWOT Analysis
Figure 34 Danaher Corporation: Company Snapshot
Figure 35 Danaher Corporation: SWOT Analysis
Figure 36 General Electric: Company Snapshot
Figure 37 General Electric: SWOT Analysis
Figure 38 Schneider Electric : Company Snapshot
Figure 39 Schneider Electric: SWOT Analysis
Figure 40 Siemens AG: Company Snapshot
Figure 41 Siemens AG: SWOT Analysis
Figure 42 ABB Ltd.: Company Snapshot
Figure 43 Emerson Electric Co.: Company Snapshot
Figure 44 Honeywell International Inc.: Company Snapshot
Figure 45 Itron Inc.: Company Snapshot
Figure 46 Wasion Group Holdings Limited: Company Snapshot


Growth opportunities and latent adjacency in Power Quality Meter Market