8K Technology Market by Product (Television (OLED, LED-LCD, QD-LCD, Micro-LED), Monitor & Notebook, Professional Camera, Projector), End User (Consumer, Sports & Entertainment, Medical), and Geography - Global Forecast to 2025 - 2036


The 8K technology market was valued at USD 12.28 billion in 2024 and is estimated to reach USD 102.46 billion by 2036, at a CAGR of 18.2% between 2025 and 2036.
The global 8K technology market is driven by increasing demand for ultra-high-definition displays across consumer electronics, broadcast, and professional sectors. The rising adoption of 8K TVs, monitors, and cameras, coupled with the growing availability of content from streaming platforms, is fueling market growth. Advancements such as AI-enhanced upscaling, high dynamic range (HDR), and improved refresh rates are enhancing visual quality, delivering immersive viewing experiences beyond conventional 4K and Full HD technologies. Overall, the market is witnessing rapid innovation, with manufacturers focusing on display panel improvements, connectivity standards, and regional expansion to cater to early adopters and premium consumer segments.

8K technology is increasingly applied in professional and industrial sectors, including media production, healthcare imaging, simulation, and virtual reality, where ultra-high resolution enhances precision and detail. The technology supports advanced content creation, large-format displays, and immersive visualization, enabling accurate analysis, realistic simulations, and superior user experiences. Manufacturers are also focusing on developing 8K-compatible broadcasting standards, streaming solutions, and connectivity infrastructure to facilitate wider adoption across both commercial and enterprise segments.
Market by Product
Televisions
Televisions represent the largest segment of the 8K technology market, driven by growing consumer demand for premium home entertainment systems. OLED, QD-LCD, LED-LCD, and Micro-LED displays are widely adopted for their superior color accuracy, high dynamic range (HDR), and immersive viewing experiences. Increasing availability of 8K content on streaming platforms and advancements in AI-based upscaling are further encouraging adoption in households worldwide.
Monitors & Notebooks
8K monitors and notebooks are gaining traction among professionals, content creators, and gamers seeking ultra-high-resolution displays for precise visuals. These devices enable detailed image editing, design work, and immersive gaming experiences, while supporting AI-enhanced upscaling and HDR technologies. Though smaller than the television segment, this category is witnessing steady growth due to rising adoption in creative, media, and enterprise environments.
Professional Cameras
Professional 8K cameras are rapidly expanding in media production, broadcasting, and cinematography, where ultra-high resolution is critical for capturing intricate details. They support advanced imaging features such as high frame rates, HDR recording, and precise color reproduction. The segment’s growth is fueled by increasing demand for 8K content in sports, film, and commercial productions, enabling more immersive and realistic viewer experiences.
Projectors
8K projectors are increasingly adopted in commercial, educational, and simulation applications where large-format, ultra-high-definition displays are essential. They offer immersive viewing for events, training, and exhibitions, while supporting HDR, wide color gamut, and AI-assisted image enhancement. The projector segment is growing fast due to expanding use in professional visualization, virtual reality setups, and large-scale entertainment installations.
Market by End User
Consumer
The consumer segment is the largest end-user of 8K technology, primarily driven by demand for home entertainment, gaming, and personal media consumption. High-resolution 8K TVs, monitors, and notebooks offer immersive viewing experiences, AI-enhanced upscaling, and superior image quality. Rising disposable incomes, increasing content availability on streaming platforms, and the adoption of premium display technologies like OLED and Micro-LED are fueling market growth in this segment.
Sports & Entertainment
The sports and entertainment sector is adopting 8K technology to deliver ultra-high-definition broadcast and live event experiences. 8K cameras, displays, and projectors enable precise motion capture, immersive stadium visuals, and enhanced production quality. Increasing demand for realistic viewing experiences, combined with advanced post-production capabilities and AI-based enhancements, is driving rapid growth in this segment, particularly in professional broadcasting and live entertainment applications.
Medical
The medical sector is leveraging 8K technology for advanced imaging, diagnostics, surgery, and telemedicine applications. Ultra-high-resolution displays and cameras support precise visualization of medical scans, surgical procedures, and remote consultations, improving accuracy and patient outcomes. Growing adoption of digital healthcare solutions, AI-assisted imaging, and large-format 8K displays in hospitals and medical research centers is fueling steady growth in this segment.
Market by Geography
Geographically, the 8K technology market is witnessing strong adoption across North America, Europe, Asia Pacific, and the Middle East & Africa. Asia Pacific leads the market, fueled by early adoption of premium TVs, growing media production, and rising disposable incomes. North America exhibits significant adoption, supported by robust infrastructure for 8K content streaming, broadcasting innovations, and high consumer spending on premium home entertainment. Europe’s growth is driven by professional media production, sports broadcasting, and consumer electronics adoption, while the Middle East & Africa are emerging markets, with demand rising for large-format displays, luxury entertainment setups, and commercial visualization applications.
Market Dynamics
Driver: Rising demand for ultra-high-definition displays
The 8K technology market is primarily driven by growing consumer and professional demand for ultra-high-definition displays. Rising adoption of high resolution TVs, monitors, notebooks, cameras, and projectors is fueled by the desire for immersive viewing experiences, enhanced gaming visuals, and precise content creation. Advancements such as AI-based upscaling, high dynamic range (HDR), and wide color gamut further enhance visual quality, encouraging adoption across home entertainment, media production, and simulation applications. Increasing availability of 8K content also accelerates market growth globally.
Restraint: High product costs
High product costs remain a major restraint for the 8K technology market. Premium pricing of 8K TVs, professional cameras, monitors, and projectors limits accessibility for price-sensitive consumers and slows widespread adoption, particularly in emerging markets. Manufacturing complexities, expensive display panels, and integration of advanced features like HDR, Micro-LED, and AI-based upscaling contribute to the high cost. Until economies of scale improve and component prices decrease, the premium nature of 8K devices will continue to restrict large-scale consumer penetration.
Opportunity: Expansion in professional sectors
Professional sectors offer significant growth opportunities for the 8K technology market. Media production, sports broadcasting, film, medical imaging, and simulation applications are increasingly adopting 8K cameras, monitors, and projectors to deliver ultra-high-resolution visuals. These industries require precision, high-fidelity reproduction, and immersive experiences, which 8K technology provides. As content creation, live broadcasting, and digital healthcare expand, manufacturers can tap into these sectors with specialized devices and solutions, driving incremental revenue beyond traditional consumer electronics.
Challenge: High bandwidth and connectivity requirements
High bandwidth and connectivity requirements pose a key challenge for the 8K technology market. Streaming, broadcasting, and transferring 8K content demand advanced network infrastructure, high-speed internet, and compatible devices, which may not be universally available. Insufficient network capabilities can lead to latency, buffering, and quality degradation, affecting the user experience. Additionally, limited compatibility with existing 4K or HD systems adds complexity for content providers and consumers. These factors can slow adoption, particularly in regions with underdeveloped digital infrastructure.
Future Outlook
Between 2025 and 2036, the 8K technology market is expected to witness significant expansion as ultra-high-definition displays become central to consumer entertainment, professional media production, and commercial visualization. Advances in AI-powered upscaling, high dynamic range (HDR), and Micro-LED/OLED display technologies will enhance visual fidelity and immersive experiences across applications. Increasing content availability, streaming infrastructure, and adoption in sports broadcasting, medical imaging, and simulation sectors will further accelerate market growth. As the ecosystem evolves, 8K technology will drive innovation, redefine viewing experiences, and enable precision-driven applications across industries.
Key Market Players
Leading companies in the global 8K technology market include Samsung Electronics Co., Ltd. (South Korea), LG Electronics Inc. (South Korea), Sony Corporation (Japan), Sharp Corporation (Japan), and Panasonic Corporation (Japan).
Key Questions addressed in this report:
- What are the global trends in demand for the market?
- What are the upcoming product areas that will have a significant impact on the market in the future?
- What will be the revenue pockets for the market players in the next 6 years?
- What are the prime strategies followed by key players in the market?
 Exclusive indicates content/data unique to MarketsandMarkets and not available with any competitors.
Table of Contents
1 Introduction (Page No. - 17)
1.1 Study Objectives
1.2 Definition
1.3 Study Scope
1.3.1 Markets Covered
1.3.2 Geographic Scope
1.3.3 Years Considered
1.4 Currency
1.5 Package Size
1.6 Stakeholders
2 Research Methodology (Page No. - 20)
2.1 Research Data
2.1.1 Secondary Data
2.1.1.1 Key Data From Secondary Sources
2.1.2 Primary Data
2.1.2.1 Breakdown of Primaries
2.1.2.2 Key Industry Insights
2.2 Market Size Estimation
2.2.1 Bottom-Up Approach
2.2.1.1 Approach for Capturing Market Share By Bottom-Up Analysis (Demand Side)
2.2.2 Top-Down Approach
2.2.2.1 Approach for Capturing Market Share By Top-Down Analysis (Supply Side)
2.3 Market Breakdown and Data Triangulation
2.4 Research Assumptions
3 Executive Summary (Page No. - 30)
4 Premium Insights (Page No. - 35)
4.1 Attractive Opportunities for Growth of 8K Technology Market
4.2 Global 8K Technology Market, By Product
4.3 Global 8K Technology Market, By End User
4.4 Market, By Geography
5 Market Overview (Page No. - 38)
5.1 Introduction
5.2 Market Dynamics
5.2.1 Drivers
5.2.1.1 Advancements in Display Technology, Financial Assistance By Governments, and Expansion of Production Capabilities for 8K Uhd Display Panels
5.2.1.2 Availability of Various Products for Creation and Delivery of 8K Content
5.2.1.3 Increased Demand for Larger-Sized TVs With Higher Resolution
5.2.2 Restraints
5.2.2.1 Limited 8K Content Availability
5.2.2.2 Uncertainty About 8K Technology Use in Smartphone, Tablet, Automotive, and Several Other Segments
5.2.3 Opportunities
5.2.3.1 8K Broadcasts in Sports and Entertainment
5.2.3.2 Proliferation of 5g and Increasing On-Demand Content
5.2.3.3 Growth Potential in Digital Signage Space
5.2.3.4 Strong Demand for 8K Technology From Several APAC Countries
5.2.4 Challenges
5.2.4.1 High Cost of 8K Technology-Based Products
5.2.4.2 Computational Complexity and High Bandwidth Requirements for Video Streaming
6 Industry Trends (Page No. - 49)
6.1 Introduction
6.2 Value Chain Analysis
6.2.1 Component Providers
6.2.2 Product Suppliers
6.2.3 Applications
6.2.4 Content Suppliers
6.2.5 End-User Industries
6.3 Status of 4K Technology
6.3.1 4K Industry Overview
6.3.2 4K Television Sets
6.3.3 4K Cameras
6.3.4 4K Projectors
6.3.5 4K Content and Broadcast
6.4 Potential of 8K Displays in Hmds
7 8K Technology Market, By Product (Page No. - 53)
7.1 Introduction
7.2 Television
7.2.1 Display Technology
7.2.1.1 LED-LCD
7.2.1.2 QD-LCD
7.2.1.3 OLED
7.2.1.4 Micro-LED
7.3 Monitor and Notebook
7.3.1 Increasing Fascination of End Users for Bigger Screens With Higher Resolution to Drive Market for 8K Monitor and Notebook
7.4 Professional Camera
7.4.1 APAC to Account for Largest Demand of 8K Professional Cameras By 2024
7.5 Projector
7.5.1 Auditoriums, Full Domes, Museums, and Movie Theaters to Be Major Applications of 8K Projectors
8 8K Technology Market, By End User (Page No. - 71)
8.1 Introduction
8.2 Consumers
8.2.1 Increasing Demand for Large-Sized Televisions By Consumers to Drive Market
8.3 Sports & Entertainment Industry
8.3.1 8K Broadcast in Sports and Entertainment Will Propel 8K Technology Market During Forecast Period
8.4 Medical Industry
8.4.1 Growing Demand of High Resolution Monitors in Medical Applications to Push Market
8.5 Other Industries
8.5.1 Retail, Hospitality, Defense, Education, and Corporate Expected to Be Other Major Industries in Market
9 Geographic Analysis (Page No. - 76)
9.1 Introduction
9.2 APAC
9.2.1 China
9.2.1.1 Growing Popularity and Awareness of High-Resolution TVs to Drive Market in China
9.2.2 Japan
9.2.2.1 2020 Summer Olympics Broadcast in 8K is Expected to Propel The Market in Japan
9.2.3 South Korea
9.2.3.1 Increasing Demand for 8K TVs to Drive The Market in South Korea
9.2.4 Rest of APAC
9.2.4.1 Market Growth in Rest of APAC is Expected Mainly From TVs
9.3 North America
9.3.1 US
9.3.1.1 High Demand for 8K Products Including TVs, Cameras, and Projectors is Expected in US During Forecast Period
9.3.2 Canada & Mexico
9.3.2.1 Growing Popularity and Awareness About 8K Products to Drive Market in Canada & Mexico
9.4 Europe
9.4.1 UK
9.4.1.1 UK to Account for Major Demand of 8K Products in Europe During Forecast Period
9.4.2 Germany
9.4.2.1 Rising Demand for High-End Products to Drive Market in Germany
9.4.3 France
9.4.3.1 Strong Economic Condition to Lead France to Be Among Early Adopters of 8K Products
9.4.4 Rest of Europe
9.4.4.1 Advent of 5g in Rest of Europe to Drive Market During Forecast Period
9.5 Rest of The World (RoW)
9.5.1 Middle East and Africa
9.5.1.1 Increasing Consumers for High-End Products in Middle East to Drive Market
9.5.2 South America
9.5.2.1 Camera, Projector, and TVs to Be Major 8K Products in South America in Terms of Demand During Forecast Period
10 Competitive Landscape (Page No. - 91)
10.1 Overview
10.2 Player Ranking Analysis: 8K Technology Market
10.3 Competitive Leadership Mapping
10.3.1 Visionary Leaders
10.3.2 Dynamic Differentiators
10.3.3 Innovators
10.3.4 Emerging Companies
10.4 Strength of Product Portfolio
10.5 Business Strategy Excellence
10.6 Competitive Situations and Trends
11 Company Profiles (Page No. - 100)
11.1 Introduction
11.2 Key Players
(Business Overview, Products & Solutions, Key Insights, Recent Developments, SWOT Analysis, MnM View)*
11.2.1 Samsung Electronics
11.2.2 LG Electronics
11.2.3 Sony
11.2.4 Sharp (Foxconn)
11.2.5 JVCKENWOOD (JVC)
11.2.6 Canon
11.2.7 Dell Technologies
11.2.8 Red Digital Cinema
11.2.9 Leyard Optoelectronic (Planar)
11.2.10 Digital Projection (Associate Company of Delta Group)
*Details on Business Overview, Products & Solutuions, Key Insights, Recent Developments, SWOT Analysis, MnM View Might Not Be Captured in Case of Unlisted Companies.
11.3 Other Players
11.3.1 Panasonic
11.3.2 Hisense
11.3.3 Changhong Electric
11.3.4 Viewsonic
11.3.5 TP Vision (TPV) (Philips)
11.3.6 Ikegami Tsushinki
11.3.7 TCL Corp.
11.4 Leading Display Panel Manufacturers
11.4.1 Innolux Corp.
11.4.2 Samsung Display
11.4.3 LG Display
11.4.4 Sharp (Foxconn)
11.4.5 Boe Technology
11.4.6 Au Optronics (AUO)
11.4.7 Japan Display (JDI)
12 Appendix (Page No. - 137)
12.1 Discussion Guide
12.2 Knowledge Store: Marketsandmarkets’ Subscription Portal
12.3 Available Customization
12.4 Related Reports
12.5 Author Details
List of Tables (35 Tables)
Table 1 LCD and OLED Fab Construction Roadmap in China
Table 2 Top Product Launches Around 8K Resolution
Table 3 Top 8K Products and Their Price Range, 2019
Table 4 8K Technology Market, By Product, 2017–2024 (Thousand Units)
Table 5 Market, By Product, 2017–2024 (USD Million)
Table 6 8K Television Market, By Region, 2017–2024 (USD Million)
Table 7 8K Television Market in APAC, By Country, 2017–2024 (USD Million)
Table 8 8K Television Market in Europe, By Country, 2017–2024 (USD Million)
Table 9 8K Television Market in North America, By Country, 2017–2024 (USD Million)
Table 10 8K Television Market in RoW, By Region, 2017–2024 (USD Million)
Table 11 Comparison of Different Display Technologies
Table 12 8K Monitor & Notebook Market, By Region, 2017–2024 (USD Million)
Table 13 8K Monitor & Notebook Market in APAC, By Country, 2017–2024 (USD Million)
Table 14 8K Monitor & Notebook Market in North America, By Country, 2017–2024 (USD Million)
Table 15 8K Monitor & Notebook Market in Europe, By Country, 2017–2024 (USD Million)
Table 16 8K Monitor & Notebook Market in RoW, By Region, 2017–2024 (USD Million)
Table 17 8K Professional Camera Market, By Region, 2017–2024 (USD Million)
Table 18 8K Professional Camera Market in North America, By Country, 2017–2024 (USD Million)
Table 19 8K Professional Camera Market in APAC, By Country, 2017–2024 (USD Million)
Table 20 8K Professional Camera Market in Europe, By Country, 2017–2024 (USD Million)
Table 21 8K Professional Camera Market in RoW, By Region, 2017–2024 (USD Million)
Table 22 8K Projector Market, By Region, 2017–2024 (USD Million)
Table 23 8K Projector Market in APAC, By Country, 2017–2024 (USD Million)
Table 24 8K Projector Market in North America, By Country, 2017–2024 (USD Million)
Table 25 8K Projector Market in Europe, By Country, 2017–2024 (USD Million)
Table 26 8K Projector Market in RoW, By Region, 2017–2024 (USD Million)
Table 27 Market, By End User, 2017–2024 (USD Million)
Table 28 Market, By Region, 2017–2024 (USD Million)
Table 29 Market in APAC, By Country, 2017–2024 (USD Million)
Table 30 Market in North America, By Country, 2017–2024 (USD Million)
Table 31 Market in Europe, By Country, 2017–2024 (USD Million)
Table 32 Market in RoW, By Region, 2017–2024 (USD Million)
Table 33 Product Launches and Developments
Table 34 Acquisitions
Table 35 Partnerships and Collaborations
List of Figures (51 Figures)
Figure 1 8K Technology Market Segmentation
Figure 2 Market: Process Flow of Market Size Estimation
Figure 3 Market: Research Design
Figure 4 Bottom-Up Approach to Arrive at Market Size
Figure 5 Top-Down Approach to Arrive at Market Size
Figure 6 Data Triangulation
Figure 7 Assumptions of Research Study
Figure 8 Global 8K Technology Market, 2017–2024 (USD Billion)
Figure 9 8K Televisions to Account for Largest Market Size By 2024
Figure 10 Consumers Segment to Hold Largest Size of Market During Forecast Period
Figure 11 Market in APAC to Grow at Highest CAGR During Forecast Period
Figure 12 Market Expected to Exhibit High Growth Between 2019 and 2024
Figure 13 Television Segment to Dominate Market During Forecast Period
Figure 14 Consumers to Exhibit Highest CAGR in Market During Forecast Period
Figure 15 Canada and Mexico to Register Highest CAGR in Market During Forecast Period
Figure 16 Market: Drivers, Restraints, Opportunities, and Challenges
Figure 17 Average TV Screen Size, 2010–2024
Figure 18 TV Panel Shipment Penetration Rate, By Resolution, 2010–2024
Figure 19 Optimal Viewing Distance for Visual Detail Recognition in Human, By Device Type and Resolution
Figure 20 Market: Value Chain Analysis
Figure 21 Shipments of 4K TV Estimated to Grow Rapidly in Next 2 Years
Figure 22 Market Segmentation, By Product
Figure 23 8K Televisions Will Witness Highest Demand During 2019–2024
Figure 24 Television Segment Expected to Hold Largest Size of Market, in Terms of Value, During Forecast Period
Figure 25 APAC to Account for Largest Size of 8K Television Market During Forecast Period
Figure 26 APAC to Dominate 8K Monitor & Notebook Market During Forecast Period
Figure 27 Europe to Exhibit Highest CAGR in 8K Professional Camera Market During Forecast Period
Figure 28 APAC to Witness Highest CAGR in 8K Projector Market During Forecast Period
Figure 29 Market Segmentation, By End User
Figure 30 Consumers Segment to Exhibit Highest CAGR in Market During Forecast Period
Figure 31 Market, By Region
Figure 32 China Expected to Be Highest-Growing Country in Market During 2019–2024
Figure 33 APAC to Register Highest CAGR in Market During Forecast Period
Figure 34 APAC: 8K Technology Market Snapshot
Figure 35 China to Hold Largest Size of Market in APAC During Forecast Period
Figure 36 North America: Market Snapshot
Figure 37 US to Capture Major Sizeof Market in North America During Forecast Period
Figure 38 Europe: Market Snapshot
Figure 39 Rest of Europe to Account for Largest Market Size During Forecast Period
Figure 40 South America to Exhibit Higher CAGR in Market in RoW During Forecast Period
Figure 41 Key Developments By Leading Players in Market From 2016 to 2019
Figure 42 Key Player Market Ranking: Market, 2018
Figure 43 Market (Global) Competitive Leadership Mapping, 2018
Figure 44 Samsung Electronics: Company Snapshot
Figure 45 LG Electronics: Company Snapshot
Figure 46 Sony: Company Snapshot
Figure 47 Sharp: Company Snapshot
Figure 48 JVCKENWOOD (JVC): Company Snapshot
Figure 49 Canon: Company Snapshot
Figure 50 Dell Technologies: Company Snapshot
Figure 51 Leyard Optoelectronic: Company Snapshot
The study involved 4 major activities to estimate the current market size for 8K technology. Exhaustive secondary research has been done to collect information on the market, peer market, and parent market. Validation of these findings, assumptions, and sizing with industry experts across the value chain through primary research has been the next step. Both top-down and bottom-up approaches have been employed to estimate the complete market size. After that, market breakdown and data triangulation procedures have been followed to estimate the market size of segments and subsegments.
Secondary Research
The research methodology used to estimate and forecast 8K technology market begins with capturing data on revenue of key vendors in the market through secondary research. The secondary sources include corporate filings (such as annual reports, press releases, investor presentations, and financial statements); trade, business, and professional associations (such as the Consumer Technology Association (CTA), Integrated Systems Europe (ISE), and Camera & Imaging Products Association (CIPA); white papers, 8K-related marketing journals, certified publications, and articles from recognized authors; gold and silver standard websites; directories; and databases. This study incorporates the use of extensive secondary sources, directories, and databases, such as Hoovers, Bloomberg Businessweek, Factiva, and OneSource to identify and collect information useful for the technical, market-oriented, and commercial study of 8K technology market. Vendor offerings have also been considered to determine the market segmentation. This entire research methodology includes the study of annual and financial reports of top players, presentations, press releases, journals, paid databases, trade directories, regulatory bodies, and safety standard organizations.
Primary Research
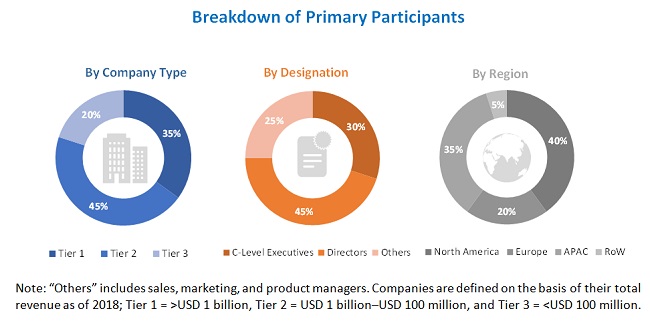
In the primary research, various primary sources from both supply and demand sides have been interviewed to obtain the qualitative and quantitative information relevant to this report. 8K technology market comprises several stakeholders, such as suppliers of raw material and manufacturing equipment; standard components, original equipment manufacturers (OEMs); original device manufacturers (ODMs) of 8K technology; solutions providers; vendors of assembly, testing, and packaging solutions; and system integrators in the supply chain. Various primary sources from both the supply and demand sides of the market were interviewed to obtain qualitative and quantitative information. Following is the breakdown of primary respondents.
To know about the assumptions considered for the study, download the pdf brochure
Market Size Estimation
Both top-down and bottom-up approaches have been used to estimate and validate the total size of 8K technology market. These methods have also been used extensively to estimate the size of various market subsegments. Extensive qualitative and quantitative analyses have been performed on the market engineering process to list key information/insights. The research methodology used to estimate the market size includes the following:
- Key players in major application areas and markets were identified through extensive secondary research.
- The industry’s supply chain and market size, in terms of value, were determined through primary and secondary research processes.
- All percentage shares, splits, and breakdowns were determined using secondary sources and verified through primary sources.
Data Triangulation
After arriving at the overall market size from the market size estimation process explained above, the overall market has been split into several segments and subsegments. To complete the overall market engineering process and arrive at the exact statistics for all the segments and subsegments, market breakdown and data triangulation procedures are employed wherever applicable. Data has been triangulated by studying various factors and trends from both the demand and supply sides. Moreover, the 8K technology market has been validated using both top-down and bottom-up approaches.
Research Objective
- To describe and forecast the 8K technology market, in terms of value, segmented on the basis of product and end user.
- To describe and forecast the market size, in terms of value, for various segments across 4 regions—North America, Europe, Asia Pacific (APAC), and Rest of the World (RoW).
- To forecast the 8K technology market, in terms of volume, segmented on the basis of product
- To analyze emerging applications/use cases of 8K technology
- To analyze 8K technology product manufacturers on the basis of their developments in the 8K technology market
- To analyze the 8K technology ecosystem/supply chain that includes component suppliers, product manufacturers, and content suppliers
- To provide detailed information regarding the drivers, restraints, opportunities, and challenges that can influence the growth of the market
- To strategically analyze micromarkets with respect to individual growth trends, prospects, and contributions to the overall market
- To analyze market opportunities for stakeholders and provide details of the competitive landscape of key players
- To analyze competitive developments such as collaborations, partnerships, acquisitions, investments and product launches and developments in the market
- To strategically profile key players and comprehensively analyze their market ranking and core competencies
Available Customization
With the given market data, MarketsandMarkets offers customizations according to companies’ specific needs. The following customization options are available for the report.
Company Information
- Detailed analysis and profiling of additional market players (up to 5)
- Company-product-technology mapping analysis


Growth opportunities and latent adjacency in 8K Technology Market