Acetic Acid Market & Its Derivatives (Vinyl Acetate Monomer (VAM), Purified Terephthalic Acid (PTA), Acetic Anhydride, & Ester Solvents - Ethyl Acetate & Butyl Acetate) Market By Applications & Geography - Trends & Forecasts to 2018


[183 Slides Report] Acetic acid is an organic compound with molecular formula CH3COOH, and is a precursor for manufacturing various other chemicals that serve various end user industries, such as textiles, inks, rubbers, plastics, and others. Its main application segments include the manufacturing of vinyl acetate monomer (VAM), purified terephthalic acid (PTA), acetic anhydride, and ester solvents (ethyl acetate & butyl acetate).
The acetic acid market has grown considerably during the past few years and is estimated to grow at a considerable pace in the next five years, mainly driven by the growing demand in the Asia-Pacific region. Asia-Pacific is the biggest consumer of in the industry, which consumed around 61.77% of the total global demand in 2012, followed by North America with a considerable demand. China is the biggest consumer, and is also among the fastest growing markets with an estimated CAGR of about 5.67% from 2013 to 2018. The European and North American markets are comparatively mature with a demand growth well below the average market growth. ROW is the fastest growing market with a CAGR of about 6.68% during the forecasted period.
This study basically aims at estimating the global acetic acid market and its derivatives for 2013 and to project the expected demand of the same by 2018. This market research study provides a detailed qualitative and quantitative analysis of the global industry. It provides a comprehensive review of important market drivers, restraints, opportunities, winning imperatives, challenges, and key issues. The market is further segmented and projected for regions, such as Asia-Pacific, North America, Europe and ROW, which is further segmented for key countries in each region. We have used various secondary sources, such as encyclopedia, directories, and databases to identify and collect information useful for this extensive commercial study of the market. The primary sources - experts from related industries and suppliers - have been interviewed to obtain and verify critical information as well as to assess the future prospects of acetic acid and its derivatives.
The competitive scenarios of top players in the acetic acid and its derivatives market have been discussed in detail. We have also profiled leading players of this industry with their recent developments and other strategic industry activities. These include: BP Plc (U.K.), Celanese Corporation (U.S.), Eastman Chemical Company (U.S.), Daicel Corporation (Japan), Jiangsu Sopo (Group) Co. Ltd. (China), LyondellBasell Industries N.V. (The Netherlands), Shandong Hualu-Hengsheng Chemical Co. Ltd. (China), Shanghai Huayi (Group) Company (China), Yankuang Cathay Coal Chemicals Co. Ltd. (China), and Kingboard Chemical Holdings Ltd. (HongKong).
Scope of the report:
This research report categorizes the global acetic acid market on the basis of applications and geography along with forecast of volume, value, and analyzing trends in each of the submarkets. It also contains the market for various derivatives of this acid at country level.
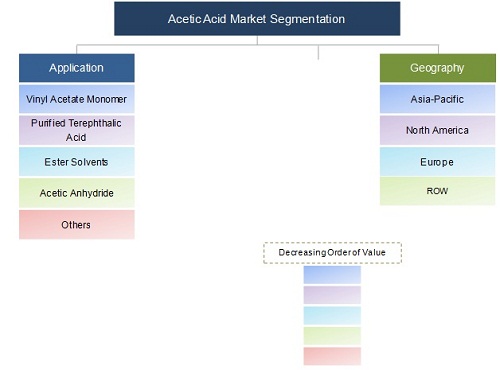
On the basis of applications: The acetic acid market is segmented on the basis of industry applications, such as vinyl acetate monomer, purified terephthalic acid, acetic anhydride, and ester solvents (ethyl acetate & butyl acetate). Each application is further described in detail in the report with volume and value forecasts for each application.
On the basis of geography: A country level segmentation is done for both acetic acid and its derivatives for regions segmented as Asia-Pacific, North America, Europe, & ROW; and further for key countries in each region that include the U.S., Canada, Mexico, Germany, U.K., Belgium, Spain, Russia, China, Japan, South Korea, India, Taiwan, Brazil, and Saudi Arabia.
Acetic acid market is expected to reach at an estimated volume of 16,339.67 kilotons by 2018, signifying a firm annualized growth rate of over 4.48% from 2013 to 2018.
The global market, along with its various derivatives, has witnessed a significant growth in the recent years, and this growth is estimated to persist in the coming years.
It is a key building block to manufacture various chemicals, such as vinyl acetate monomer (VAM), purified terephthalic acid (PTA), ester solvents(ethyl acetate & butyl acetate), and acetic anhydride that are further used by a wide range of end-user industries, such as synthetic fibers, textiles, inks, and pesticides.
Currently, Asia-Pacific is the largest market and all of its downstream derivatives, which consumed more than 60.00% of the overall global consumption in 2012. Among all the countries, China dominates the market. The country consumed maximum volume of this product in 2012. The market volume of acetic acid and its various derivatives is comparatively low in the ROW region, but is estimated to grow at the highest CAGR from 2013 to 2018, followed by the Asia-Pacific region.
The overall demand in the industry is driven by the producers of vinyl acetate monomer (VAM), purified terephthalic acid (PTA), and ester solvents consuming almost 73.00% of the total demand in 2012. Ester solvents manufacturing segment is expected to be the strongest growth segment of the market, which is primarily driven by the growing demand from coatings industry. Subsequently, the budding textile and packaging industry is pushing the demand for PTA, which in turn is driving the demand for acetic acid at a notable pace.
Among all the acetic acid derivatives, VAM led the market with the highest global consumption of more than 5.0 million tons, followed by ester solvents with total global consumption of around 4.0 million tons in 2012.
The top manufacturers include BP Plc (U.K.), Celanese Corporation (U.S.), Eastman Chemical Company (U.S.), Shanghai Huayi (Group) Company (China), Daicel Corporation (Japan), LyondellBasell Industries N.V. (The Netherlands), Shandong Hualu-Hengsheng Chemical Co. Ltd. (China), Yankuang Cathay Coal Chemicals Co. Ltd. (China), Jiangsu Sopo (Group) Co. Ltd. (China), and Kingboard Chemical Holdings Ltd. (HongKong).
ACETIC ACID MARKET SEGMENTATION
Source: Secondary Research, Expert Interviews, and MarketsandMarkets Analysis
This report covers the acetic acid market by various regions and key countries in each region. It also provides a detailed segmentation of the industry based on important applications, along with its projection till 2018. The country level demand estimations and forecast of important derivatives of acetic acid are also provided in the report.
 Exclusive indicates content/data unique to MarketsandMarkets and not available with any competitors.
1 Introduction (Slide No. - 16)
1.1 Key Deliverables
1.2 Report Description
1.3 Stakeholders
1.4 Research Methodology
1.4.1 Market Size Estimation Methodology
1.4.2 Important Secondary Sources Used
1.4.3 Key Data Taken From Secondary Sources
1.4.4 Key Data Taken From Primary Sources
1.4.5 Assumptions
2 Executive Summary (Slide No. - 22)
3 Premium Insights (Slide No. - 25)
3.1 Acetic Acid Market Segmentation
3.2 Market Dynamics
3.3 Market Global Outlook
3.4 Derivatives Demand
4 Market Overview (Page No. - 32)
4.1 Introduction
4.2 Value Chain Analysis
4.3 Market Dynamics
4.3.1 Drivers
4.3.1.1 Budding Vinyl Acetate Monomer Demand
4.3.1.2 Growing Textile & Packaging Industry
4.3.1.3 Growing Demand In Asia-Pacific
4.3.1.4 Increasing Penetration Of Ester Solvents In Coating Industry
4.3.2 Restraints
4.3.2.1 Mature Market Of Acetic Anhydride
4.3.3 Opportunities
4.3.3.1 Wave For Change Through Emerging Technologies For Acetic Acid
4.3.3.2 Upcoming Derivative Plants
4.4 Burning Issues
4.4.1 Bio-Based Acetic Acid
4.4.2 Shale Gas Development
4.5 Winning Imperative
4.5.1 Integration
4.6 Raw Material Analysis
4.6.1 Methanol
4.7 Regulations
4.8 Porter�s Five Forces Analysis
4.8.1 Threat Of New Entrants
4.8.2 Threat Of Substitutes
4.8.3 Buyers� Power
4.8.4 Suppliers� Power
4.8.5 Degree Of Competititon
4.9 Market Share Analysis
5 Acetic Acid Market (Slide No. - 55)
5.1 Market, By Derivative
5.1.1 Introduction
5.1.2 Vinyl Acetate Monomer (VAM)
5.1.3 Purified Terephthalic Acid (PTA)
5.1.4 Ester Solvents
5.1.5 Acetic Anhydride
5.1.6 Others
5.2 Market, By Geography
5.2.1 Introduction
5.2.2 North America
5.2.2.1 U.S.
5.2.2.2 Canada
5.2.2.3 Mexico
5.2.3 Asia-Pacific
5.2.3.1 China
5.2.3.2 South Korea
5.2.3.3 Japan
5.2.3.4 India
5.2.3.5 Taiwan
5.2.4 Europe
5.2.4.1 Germany
5.2.4.2 U.K.
5.2.4.3 Belgium
5.2.4.4 Spain
5.2.4.5 Russia
5.2.5 Row
5.2.5.1 Brazil
5.2.5.2 Saudi Arabia
6 Acetic Acid Derivatives Market (Slide No. - 117)
6.1 Introduction
6.2 Vinyl Acetate Monomer (VAM)
6.2.1 Vinyl Acetate Monomer: Regional Analysis
6.2.1.1 North America: Country Analysis
6.2.1.2 Europe: Country Analysis
6.2.1.3 Asia-Pacific: Country Analysis
6.2.1.4 Row: Country Analysis
6.3 Ester Solvents
6.3.1 Ester Solvents: Regional Analysis
6.3.1.1 North America: Country Analysis
6.3.1.2 Europe: Country Analysis
6.3.1.3 Asia-Pacific: Country Analysis
6.3.1.4 ROW: Country Analysis
6.4 Acetic Anhydride
6.4.1 Acetic Anhydride: Regional Analysis
6.4.1.1 North America: Country Analysis
6.4.1.2 Asia-Pacific: Country Analysis
7 Competitive Landscape (Slide No. - 145)
7.1 Introduction
7.2 Expansion: The Most Popular Growth Strategy
7.3 Maximum Developments In 2012
7.4 Asia-Pacific - Region With Maximum Developments
7.5 Bp Plc & Celanese Corporation: Leading Market Participants
8 Company Profiles (Overview, Financial*, Products & Services, Strategy, And Developments) (Slide No. - 153)
8.1 Celanese Corporation
8.2 Bp Plc
8.3 Eastman Chemical Company
8.4 Daicel Corporation
8.5 Lyondellbasell Industries N.V.
8.6 Jiangsu Sopo (Group) Co.Ltd.
8.7 Shanghai Huayi (Group) Company
8.8 Kingboard Chemical Holdings Ltd.
8.9 Shandong Hualu-Hengsheng Chemical Co. Ltd.
8.10 Yankuang Cathay Coal Chemicals Co. Ltd.
*Details Might Not Be Captured In Case Of Unlisted Companies.
List Of Tables (94 Tables)
Table 1 Acetic Acid Market Size, By Geography, 2011�2018 (Kt)
Table 2 Market Size, By Geography, 2011�2018 ($Million)
Table 3 Properties
Table 4 Asia-Pacific: Derivatives, Upcoming Capacities
Table 5 Paints & Coatings Market Size, 2011-2018
Table 6 Upcoming Plants Of Acetic Acid Derivatives
Table 7 Methnol Average Price ($/Mt), 2011-2018
Table 8 Acetic Acid: Market Size In Vam Application, 2011�2018
Table 9 Market Size In Pta Application, 2011�2018
Table 10 Market Size In Ester Solvents Application, 2011�2018
Table 11 Market Size In Acetic Anhydride Application, 2011�2018
Table 12 Market Size In Other Application, 2011�2018
Table 13 U.S.: Important Export Markets, 2012
Table 14 U.S.: Important Import Markets, 2012
Table 15 U.S.: Acetic Acid Market Size, By Application, 2011-2018 (Kt)
Table 16 U.S.: Market Size, By Application, 2011-2018 ($Million)
Table 17 Canada: Important Export Markets, 2012
Table 18 Canada: Important Import Markets, 2012
Table 19 Canada: Acetic Acid: Market Size, By Application, 2011-2018 (Kt)
Table 20 Canada: Market Size, By Application, 2011-2018 ($Million)
Table 21 Mexico: Important Export Markets, 2012
Table 22 Mexico: Important Import Markets, 2012
Table 23 Mexico: Market Size, By Application, 2011-2018 (Kt)
Table 24 Mexico: Market Size, By Application, 2011-2018 ($Million)
Table 25 China: Important Export Markets, 2012
Table 26 China: Important Import Markets, 2012
Table 27 China: Market Size, By Application, 2011-2018 (Kt)
Table 28 China: Market Size, By Application, 2011-2018 ($Million)
Table 29 South Korea: Important Export Markets, 2012
Table 30 South Korea: Important Import Markets, 2012
Table 31 South Korea: Market Size, By Application, 2011-2018 (Kt)
Table 32 South Korea: Market Size, By Application, 2011-2018 ($Million)
Table 33 Japan: Important Export Markets, 2012
Table 34 Japan: Important Import Markets, 2012
Table 35 Japan: Market Size, By Application, 2011-2018 (Kt)
Table 36 Japan: Market Size, By Application, 2011-2018 ($Million)
Table 37 India: Important Export Markets, 2012
Table 38 India: Important Import Markets, 2012
Table 39 India: Market Size, By Application, 2011-2018 (Kt)
Table 40 India: Market Size, By Application, 2011-2018 ($Million)
Table 41 Taiwan: Important Export Markets, 2012
Table 42 Taiwan: Important Import Markets, 2012
Table 43 Taiwan: Acetic Acid Market Size, By Application, 2011-2018 (Kt)
Table 44 Taiwan: Market Size, By Application, 2011-2018 ($Million)
Table 45 Germany: Important Export Markets, 2012
Table 46 Germany: Important Import Markets, 2012
Table 47 Germany: Market Size, By Application, 2011-2018 (Kt)
Table 48 Germany: Market Size, By Application, 2011-2018 ($Million)
Table 49 U.K.: Important Import Markets, 2012
Table 50 U.K.: Market Size, By Application, 2011-2018 (Kt)
Table 51 U.K.: Market Size, By Application, 2011-2018 ($Million)
Table 52 Belgium: Important Export Markets, 2012
Table 53 Belgium: Important Import Markets, 2012
Table 54 Belgium: Acetic Acid Market Size, By Application, 2011-2018 (Kt)
Table 55 Belgium: Market Size, By Application, 2011-2018 ($Million)
Table 56 Spain: Important Export Markets, 2012
Table 57 Spain: Important Import Markets, 2012
Table 58 Spain: Market Size, By Application, 2011-2018 (Kt)
Table 59 Spain: Market Size, By Application, 2011-2018 ($Million)
Table 60 Russia: Important Export Markets, 2012
Table 61 Russia: Important Import Markets, 2012
Table 62 Russia: Market Size, By Application, 2011-2018 (Kt)
Table 63 Russia: Market Size, By Application, 2011-2018 ($Million)
Table 64 Brazil: Important Export Markets, 2012
Table 65 Brazil: Important Import Markets, 2012
Table 66 Brazil: Market Size, By Application, 2011-2018 (Kt)
Table 67 Brazil: Market Size, By Application, 2011-2018 ($Million)
Table 68 Saudi Arabia: Important Export Markets, 2012
Table 69 Saudi Arabia: Important Import Markets, 2012
Table 70 Saudi Arabia: Market Size, By Application, 2011-2018 (Kt)
Table 71 Saudi Arabia: Market Size, By Application, 2011-2018 ($Million)
Table 72 Vam Market Size, 2011-2018
Table 73 North America: Vam Market Size, By Country, 2011�2018 (Kt)
Table 74 North America: Vam Market Size, By Country, 2011�2018 ($Million)
Table 75 Europe: Vam Market Size, By Country, 2011�2018 (Kt)
Table 76 Europe: Vam Market Size, By Country, 2011�2018 ($Million)
Table 77 Asia-Pacific: Vam Market Size, By Country, 2011�2018 (Kt)
Table 78 Asia-Pacific: Vam Market Size, By Country, 2011�2018 ($Million)
Table 79 ROW: VAM Market Size, By Country, 2011�2018 (Kt)
Table 80 ROW: VAM Market Size, By Country, 2011�2018 ($Million)
Table 81 Ester Solvents Market Size, 2011-2018
Table 82 North America: Ester Solvents Market Size, By Country, 2011�2018 (Kt)
Table 83 North America: Ester Solvents Market Size, By Country, 2011�2018 ($Million)
Table 84 Europe: Ester Solvents Market Size, By Country, 2011�2018 (Kt)
Table 85 Europe: Ester Solvents Market Size, By Country, 2011�2018 ($Million)
Table 86 Asia-Pacific: Ester Solvents Market Size, By Country, 2011�2018 (Kt)
Table 87 Asia-Pacific: Ester Solvents Market Size, By Country, 2011�2018 ($Million)
Table 88 ROW: Ester Solvents Market Size, By Country, 2011�2018 (Kt)
Table 89 ROW: Ester Solvents Market Size, By Country, 2011�2018 ($Million)
Table 90 Acetic Anhydride Market Size, 2011-2018
Table 91 North America: Acetic Anhydride Market Size, By Country, 2011�2018 (Kt)
Table 92 North America: Acetic Anhydride Market Size, By Country, 2011�2018 ($Million)
Table 93 Asia-Pacific: Acetic Anhydride Market Size, By Country, 2011�2018 (Kt)
Table 94 Asia-Pacific: Acetic Anhydride Market Value, By Country, 2011�2018 ($Million)
List Of Figures (34 Figures)
Figure 1 Acetic Acid Market Segmentation
Figure 2 Market Dynamics
Figure 3 Porter�s Five Forces Analysis
Figure 4 Market Life Cycle, By Geography
Figure 5 Market Share (Volume), 2012 & Demand, By Region, 2011�2018
Figure 6 Acetic Acid Derivatives Market Size & Share (Volume), By Geography, 2012
Figure 7 Demand By Derivatives & Derivatives Demand, 2013 Vs.2018
Figure 8 Value Chain Analysis
Figure 9 Impact Of Key Drivers On Acetic Acid: Market, 2013-2018
Figure 10 Vam Market Size, 2011-2018 (Kt)
Figure 11 Impact Of Key Restraints On Acetic Acid Market, 2013-2018
Figure 12 Impact Of Key Opportunities On Acetic Acid: Market, 2013-2018
Figure 13 Forward Integration
Figure 14 Porter�s Five Forces Analysis
Figure 15 Market Share (Volume), By Company, 2012
Figure 16 Market Share (Volume), By Derivative, 2012
Figure 17 Market Share (Volume), By Geography, 2012
Figure 18 North America: Market Share (Volume), By Country, 2012
Figure 19 Asia-Pacific: Market Share (Volume), By Country, 2012
Figure 20 Europe: Market Share (Volume), By Country, 2012
Figure 21 Row: Market Share (Volume), By Country, 2012
Figure 22 Acetic Acid Derivatives Market Size, By Type, 2012 (Kt)
Figure 23 Vam Market Share (Volume), By Geography, 2012
Figure 24 Ester Solvents Market Share (Volume), By Geography, 2012
Figure 25 Acetic Anhydride Market Share (Volume), By Geography, 2012
Figure 26 Acetic Acid Market Development, By Growth Startegy, 2010-2013
Figure 27 Acetic Acid: Market Developments, 2010�2013
Figure 28 Market Growth Strategies, By Geography, 2010�2013
Figure 29 Acetic Acid Market Activity Share, By Company, 2010�2013
Figure 30 Celanese Corporation: Swot Analysis
Figure 31 Bp Plc: Swot Analysis
Figure 32 Eastman Chemical Company: Swot Analysis
Figure 33 Daicel Corporation: Swot Analysis
Figure 34 Lyondellbasell: Swot Analysis


Growth opportunities and latent adjacency in Acetic Acid Market