Acoustic Wave Sensor Market by Type (Surface Acoustic Wave, Bulk Acoustic Wave), Device (Resonator, Delay Line), Sensing Parameter (Temperature, Pressure, Humidity), Vertical (Military, Automotive, Industrial) and Geography - Global Forecast to 2036


Acoustic Wave Sensor Market Summary
The Acoustic Wave Sensor Market size is estimated at USD 1.5–2.0 billion in 2025 and is projected to reach approximately USD 4.0–5.0 billion by 2036, growing at a CAGR of 8%–10% during the forecast period. The Market is experiencing significant growth as industries increasingly adopt high-precision sensing technologies for real-time monitoring, diagnostics, and automation. This expansion is primarily driven by the rising integration of Artificial Intelligence (AI), Internet of Things (IoT), and automation technologies across industrial, healthcare, and consumer electronics sectors. Acoustic wave sensors, including surface acoustic wave (SAW) and bulk acoustic wave (BAW) sensors, are increasingly being deployed in smart devices, environmental monitoring systems, and industrial automation applications due to their high sensitivity, compact size, and wireless capabilities. The ongoing digital transformation across industries, coupled with the demand for predictive maintenance and real-time analytics, is further accelerating market growth.
Key Market Trends & Insights
The Acoustic Wave Sensor Market is characterized by rapid technological innovation and expanding application areas. North America currently leads the market due to its advanced technological infrastructure and early adoption of smart sensing solutions, while Asia Pacific is emerging as the fastest-growing region driven by strong manufacturing activity and increasing investments in electronics and automotive industries.
Surface acoustic wave (SAW) sensors dominate the market owing to their cost-effectiveness and wide applicability in industrial and consumer electronics. However, bulk acoustic wave (BAW) sensors are gaining traction in high-frequency applications such as telecommunications and advanced RF filtering.
The integration of AI and IoT is transforming acoustic wave sensors into intelligent sensing platforms capable of real-time data processing and predictive analytics. Additionally, the growing demand for wireless and battery-free sensors is driving innovation in energy-efficient designs.
Automation and smart infrastructure development are further boosting the adoption of acoustic wave sensors in applications such as structural health monitoring, industrial process control, and environmental sensing.
Market Size & Forecast
-
Base year market size (2025): USD 1.5–2.0 billion
-
Forecast market size (2036): USD 4.0–5.0 billion
-
CAGR (2025–2036): 8%–10%
-
Growth is driven by increasing adoption of IoT-enabled sensing devices, AI-based analytics, and rising demand for real-time monitoring across industries
Acoustic Wave Sensor Market Top 10 key takeaway
-
The market is projected to more than double by 2036 due to technological advancements
-
SAW sensors remain the dominant product segment globally
-
Asia Pacific is the fastest-growing region with strong industrial expansion
-
AI integration is enhancing sensor intelligence and predictive capabilities
-
IoT adoption is driving demand for connected sensing solutions
-
Wireless and passive sensor technologies are gaining popularity
-
Healthcare applications are emerging as a key growth area
-
Industrial automation is a major driver of market demand
-
Telecommunications sector is boosting BAW sensor adoption
-
Energy-efficient sensor designs are shaping future innovations
Product Insights
Surface acoustic wave (SAW) sensors dominate the Acoustic Wave Sensor Market due to their versatility, cost-effectiveness, and ease of integration into various applications. These sensors are widely used in industrial monitoring, automotive systems, and consumer electronics, where they provide accurate and reliable measurements of parameters such as pressure, temperature, and humidity. Their ability to operate wirelessly and without external power sources makes them particularly attractive for remote and harsh environment applications.
Bulk acoustic wave (BAW) sensors are gaining momentum, especially in high-frequency applications such as RF filters in smartphones and telecommunications infrastructure. As 5G and next-generation communication technologies expand, the demand for BAW sensors is expected to rise significantly.
Emerging product categories include miniaturized and flexible acoustic wave sensors that can be integrated into wearable devices and smart textiles. These innovations are supported by advancements in nanotechnology and materials science, enabling enhanced performance and new use cases.
AI integration is further enhancing product capabilities by enabling real-time data analysis, fault detection, and predictive maintenance, making acoustic wave sensors an integral part of intelligent sensing ecosystems.
Technology / Component Insights
The Acoustic Wave Sensor Market is driven by a combination of advanced technologies, including AI, IoT, cloud computing, and automation. Acoustic wave sensors rely on piezoelectric materials to convert electrical signals into mechanical waves and vice versa, enabling precise measurement capabilities.
AI plays a critical role in analyzing sensor data to identify patterns, detect anomalies, and predict system failures. This capability is particularly valuable in industrial applications, where downtime can result in significant financial losses.
IoT integration enables acoustic wave sensors to be part of connected ecosystems, allowing for real-time monitoring and control. These sensors can transmit data to cloud platforms, where it is processed and analyzed to provide actionable insights.
Cloud computing enhances scalability and data storage capabilities, while automation technologies enable seamless integration with industrial control systems. Future innovations are expected to include the use of digital twins and edge computing, which will enable real-time decision-making and improved system efficiency.
Application Insights
The industrial sector is the leading application segment in the Acoustic Wave Sensor Market, driven by the need for accurate and reliable monitoring of equipment and processes. Acoustic wave sensors are widely used in predictive maintenance, structural health monitoring, and process control, helping industries optimize performance and reduce downtime.
The healthcare sector is emerging as a significant growth area, with applications in biosensing, diagnostics, and wearable health monitoring devices. The ability of acoustic wave sensors to detect minute changes in biological parameters makes them ideal for medical applications.
The automotive industry is also witnessing increased adoption, particularly in advanced driver assistance systems (ADAS) and vehicle monitoring systems. Additionally, the telecommunications sector is leveraging acoustic wave sensors for RF filtering and signal processing.
Future opportunities lie in smart cities, environmental monitoring, and consumer electronics, where the demand for intelligent sensing solutions is rapidly increasing.
Regional Insights
North America leads the Acoustic Wave Sensor Market due to its strong technological base, high adoption of IoT and AI, and presence of key industry players. The region benefits from significant investments in research and development, as well as advanced industrial infrastructure.
Europe is a mature market, driven by stringent environmental regulations and the adoption of smart manufacturing practices. Countries such as Germany and France are at the forefront of implementing advanced sensing technologies in industrial and automotive applications.
Asia Pacific is the fastest-growing region, fueled by rapid industrialization, expanding electronics manufacturing, and increasing demand for consumer devices. China and Japan are leading contributors, supported by government initiatives and strong industrial ecosystems.
-
North America dominates due to advanced technology adoption
-
Europe benefits from regulatory support and industrial innovation
-
Asia Pacific shows the highest growth potential
-
Rapid industrialization drives demand in emerging economies
-
Smart city initiatives boost sensor adoption globally
Country-Specific Market Trends
In Asia Pacific, China is experiencing robust growth with a CAGR of 10%–12%, driven by large-scale electronics manufacturing and smart infrastructure projects. Japan, with a CAGR of 8%–10%, is focusing on advanced technologies such as robotics and precision sensing.
In North America, the United States leads with a CAGR of 7%–9%, supported by strong investments in IoT and industrial automation. Canada and Mexico are also witnessing steady growth due to increasing adoption of smart technologies.
In Europe, Germany is a key market with a CAGR of 8%–10%, driven by its strong automotive and industrial sectors. France is also experiencing growth due to rising demand for energy-efficient and environmentally friendly technologies.
-
China leads APAC with rapid industrial and technological growth
-
Japan focuses on precision sensing and robotics integration
-
United States drives innovation in North America
-
Germany leads Europe with strong industrial adoption
-
France emphasizes sustainability and smart technologies
Key Acoustic Wave Sensor Market Company Insights
The Acoustic Wave Sensor Market is highly competitive, with key players focusing on innovation, product development, and strategic partnerships. Companies are investing in AI and IoT integration to enhance sensor capabilities and expand their application scope.
Major players include Qorvo Inc., Broadcom Inc., Murata Manufacturing Co., Ltd., Honeywell International Inc., Siemens AG, TE Connectivity Ltd., Kyocera Corporation, TDK Corporation, and STMicroelectronics N.V. These companies are leveraging advanced technologies to develop high-performance acoustic wave sensors for diverse applications.
Their strategies include expanding product portfolios, investing in R&D, and forming partnerships to strengthen market presence and address evolving customer needs.
-
Companies are focusing on AI-enabled sensor solutions
-
Strategic partnerships are driving innovation and growth
-
Investment in R&D is a key competitive strategy
-
Expansion into emerging markets is increasing
-
Product diversification enhances market positioning
Recent Developments
Recent developments in the Acoustic Wave Sensor Market highlight the increasing focus on technological advancement and collaboration. Several companies have introduced next-generation SAW and BAW sensors with enhanced sensitivity and energy efficiency.
AI integration into sensor platforms has enabled real-time data analysis and predictive maintenance capabilities, improving operational efficiency across industries. Additionally, partnerships between sensor manufacturers and IoT platform providers are enabling the development of integrated sensing solutions.
New product launches targeting healthcare and wearable applications are also gaining traction, reflecting the expanding scope of acoustic wave sensor technologies.
Market Segmentation
The Acoustic Wave Sensor Market is segmented by product, technology/component, application, and region. By product, the market includes SAW sensors and BAW sensors. By technology, it encompasses AI-enabled systems, IoT-connected devices, and cloud-based platforms. Applications include industrial, healthcare, automotive, telecommunications, and environmental monitoring. Regionally, the market is divided into North America, Europe, Asia Pacific, and the rest of the world.
-
Product segmentation includes SAW and BAW sensors
-
Technology includes AI, IoT, and cloud integration
-
Applications span multiple industries including healthcare and telecom
-
Regional segmentation highlights global growth dynamics
-
Smart and connected solutions are driving segmentation trends
The Acoustic Wave Sensor Market is set for substantial growth through 2036, driven by the increasing adoption of AI, IoT, and automation technologies. As industries continue to embrace digital transformation, acoustic wave sensors will play a critical role in enabling real-time monitoring, predictive maintenance, and intelligent decision-making. The integration of advanced technologies such as edge computing and digital twins will further enhance sensor capabilities and open new avenues for innovation. Businesses that invest in advanced acoustic wave sensor solutions will be well-positioned to capitalize on emerging opportunities and achieve sustainable growth in the evolving technological landscape.
FAQs
1. What is the current size of the Acoustic Wave Sensor Market?
The market size is estimated at USD 1.5–2.0 billion in 2025.
2. What is the expected growth rate of the market?
The market is projected to grow at a CAGR of 8%–10% from 2025 to 2036.
3. What are the key drivers of market growth?
Key drivers include the adoption of AI, IoT, automation, and increasing demand for real-time monitoring.
4. Which region leads the market?
North America currently leads the Acoustic Wave Sensor Market.
5. Who are the key players in the market?
Major companies include Qorvo, Broadcom, Murata Manufacturing, Honeywell, and Siemens.
To speak to our analyst for a discussion on the above findings, click Speak to Analyst
 Exclusive indicates content/data unique to MarketsandMarkets and not available with any competitors.
Table of Contents
1 Introduction
1.1 Objectives Of The Study
1.2 Definition
1.3 Study Scope
1.3.1 Markets Covered
1.3.2 Years Considered
1.4 Currency
1.5 Limitations
1.6 Stakeholders
2 Research Methodology
2.1 Research Data
2.1.1 Secondary Data
2.1.1.1 Major Secondary Sources
2.1.1.2 Secondary Sources
2.1.2 Primary Data
2.1.2.1 Primary Interviews With Experts
2.1.2.2 Breakdown Of Primaries
2.1.2.3 Key Data From Primary Sources
2.1.3 Secondary And Primary Research
2.1.3.1 Key Industry Insights
2.2 Market Size Estimation
2.2.1 Bottom-Up Approach
2.2.2 Top-Down Approach
2.3 Market Breakdown And Data Triangulation
2.4 Research Assumptions
3 Executive Summary
4 Premium Insights
5 Market Overview
5.1 Introduction
5.2 Market Dynamics
5.2.1 Drivers
5.2.2 Restraints
5.2.3 Opportunities
5.2.4 Challenges
6 Acoustic Wave Sensor Market By Type
6.1 Introduction
6.2 Saw Sensors
6.2.1 Rayleigh Surface Wave Sensors
6.2.2 Sh-Saw Sensors
6.2.3 Fpw Sensors
6.3 Baw Sensors
6.3.1 Tsm Sensor
6.3.2 Sh-Apm Sensors
7 Acoustic Wave Sensor Market By Device
7.1 Introduction
7.2 Resonators
7.3 Delay Lines
8 Acoustic Wave Sensor Market By Sensing Parameter
8.1 Introduction
8.2 Temperature
8.3 Pressure.
8.4 Humidity
8.5 Chemical Vapor/Gas
8.6 Torque
8.7 Mass
8.8 Viscosity
8.9 Others
9 Acoustic Wave Sensor Market By Vertical
9.1 Introduction
9.2 Military
9.3 Automotive
9.4 Industrial
9.5 Healthcare
9.6 Food & Beverages
9.7 Environment
9.8 Others
10 Geographic Analysis
10.1 Introduction
10.2 North America
10.2.1 Us
10.2.2 Canada
10.2.3 Mexico
10.3 Europe
10.3.1 Uk
10.3.2 France
10.3.3 Germany
10.3.4 Rest Of Europe
10.4 Asia Pacific
10.4.1 China
10.4.2 Japan
10.4.3 India
10.4.4 Rest Of Apac
10.5 Rest Of The World (Row)
11 Competitive Landscape
11.1 Overview
11.2 Competitive Scenario
11.2.1 Market Ranking Analysis: Acoustic Wave Sensor Market, 2016
11.3 Acoustic Wave Sensor Dive Chart
11.3.1 Visionary Leaders
11.3.2 Dynamic Differentiators
11.3.3 Innovators
11.3.4 Emerging Companies
11.4 Competitive Benchmarking
11.4.1 Strength Of Product Portfolio
11.4.2 Business Strategy Excellence
11.5 Competitive Situations And Trends
12 Company Profiles
12.1 Introduction (Business Overview, Products Offered, Recent Developments, Swot Analysis, And Mnm View) *
12.2 Althen Gmbh
12.3 Nanotemper Technologies Gmbh
12.4 H. Heinz Meßwiderstände Gmbh
12.5 Transense Technologies Plc
12.6 Pro-Micron Gmbh & Co. Kg
12.7 Vectron International Inc.
12.8 Qualtre Inc.
12.9 Senseor Sas
12.10 Sensor Technology Ltd.
12.11 Hawk Measurement Systems
12.12 Key Innovators
12.12.1 Abracon Llc
12.12.2 Boston Piezo-Optics Inc.
12.12.3 Stmicroelectronics N.V.
12.12.4 Precision Acoustics Ltd.
12.12.5 Sensanna Incorporated
13 Appendix
13.1 Insights Of Industry Experts
13.2 Discussion Guide
13.3 Knowledge Store: Marketsandmarkets’ Subscription Portal
13.4 Introducing Rt: Real-Time Market Intelligence
13.5 Available Customizations
13.6 Related Reports
13.7 Author Details
List Of Tables (100 Figures)
Table 1 Acoustic Wave Sensor Market, In Terms Of Value, 2014–2023 (Usd Million)
Table 2 Market, By Type, 2014–2023 (Usd Million)
Table 3 Market, By Device, 2014–2023 (Usd Million)
Table 4 Market, For Resonators, By Region, 2014–2023 (Usd Million)
Table 5 Market, For Delay Lines, By Region, 2014–2023 (Usd Million)
Table 6 Market, By Sensing Parameter, 2014–2023 (Usd Million
Table 7 Market For Temperature,By Vertical, 2014–2023 (Usd Million)
Table 8 Market For Temperature, By Region, 2014–2023 (Usd Million)
Table 9 Market For Pressure, By Vertical, 2014–2023 (Usd Million)
Table 10 Acoustic Wave Sensor Market For Pressure, By Region, 2014–2023 (Usd Million)
Table 11 Market For Humidity, By Vertical, 2014–2023 (Usd Million)
Table 12 Market For Humidity, By Region, 2014–2023 (Usd Million)
Table 13 Market For Chemical Vapor/Gas, By Vertical, 2014–2023 (Usd Million)
Table 14 Market For Chemical Vapor/Gas, By Region, 2014–2023 (Usd Million)
Table 15 Market For Torque, By Vertical, 2014–2023 (Usd Million)
Table 16 Market For Torque, By Region, 2014–2023 (Usd Million)
Table 17 Market For Mass, By Vertical, 2014–2023 (Usd Million)
Table 18 Market For Mass, By Region, 2014–2023 (Usd Million)
Table 19 Market For Viscosity, By Vertical, 2014–2023 (Usd Million)
Table 20 Acoustic Wave Sensor Market For Viscosity, By Region, 2014–2023 (Usd Million)
Table 21 Market For Others, By Vertical, 2014–2023 (Usd Million)
Table 22 Market For Others, By Region, 2014–2023 (Usd Million)
Table 23 Market, By Vertical, 2014–2023 (Usd Million)
Table 24 Market For Military, By Sensing Parameter, 2014–2023 (Usd Million)
Table 25 Market For Military, By Region, 2014–2023 (Usd Million)
Table 26 Market For Automotive, By Sensing Parameter, 2014–2023 (Usd Million)
Table 27 Market For Automotive, By Region, 2014–2023 (Usd Million)
Table 28 Market For Automotive, By Application, 2014–2023 (Usd Million)
Table 29 Market For Industrial, By Sensing Parameter, 2014–2023 (Usd Million)
Table 30 Acoustic Wave Sensor Market For Industrial, By Application, 2014–2023 (Usd Million)
Table 31 Market For Industrial Vertical, By Region, 2014–2023 (Usd Million)
Table 32 Market For Healthcare, By Sensing Parameter, 2014–2023 (Usd Million)
Table 33 Market For Healthcare, By Region, 2014–2023 (Usd Million)
Table 34 Market For Food & Beverages, By Sensing Parameter, 2014–2023 (Usd Million)
Table 35 Market For Food & Beverages, By Region, 2014–2023 (Usd Million)
Table 36 Market For Environment Vertical, By Sensing Parameter, 2014–2023 (Usd Million)
Table 37 Market For Environment Vertical, By Region, 2014–2023 (Usd Million)
Table 38 Market For Others, By Region, 2014–2023 (Usd Million)
Table 39 Market, By Geography, 2014–2023 (Usd Million)
Table 40 Acoustic Wave Sensor Market In North America, By Device, 2014–2023 (Usd Million)
Table 41 Market In North America, By Sensing Parameter, 2014–2023 (Usd Million)
Table 42 Market In North America, By Vertical, 2014–2023 (Usd Million)
Table 43 Market In North America For Industrial, By Application, 2014–2023 (Usd Million)
Table 44 Market In North America For Automotive, By Application, 2014–2023 (Usd Million)
Table 45 Market In North America, By Country, 2014–2023 (Usd Million)
Table 46 Market In Us, By Device, 2014–2023 (Usd Million)
Table 47 Market In Us, By Sensing Parameter, 2014–2023 (Usd Million)
Table 48 Market In Us, By Vertical, 2014–2023 (Usd Million)
Table 49 Market In Canada, By Device, 2014–2023 (Usd Million)
Table 50 Acoustic Wave Sensor Market In Canada, By Sensing Parameter, 2014–2023 (Usd Million)
Table 51 Market In Canada, By Vertical, 2014–2023 (Usd Million)
Table 52 Market In Mexico, By Device, 2014–2023 (Usd Million)
Table 53 Market In Mexico, By Sensing Parameter, 2014–2023 (Usd Million)
Table 54 Market In Mexico, By Vertical, 2014–2023 (Usd Million)
Table 55 Market In Europe, By Device, 2014–2023 (Usd Million)
Table 56 Market In Europe, By Sensing Parameter, 2014–2023 (Usd Million)
Table 57 Market In Europe, By Vertical, 2014–2023 (Usd Million)
Table 58 Market In Europe For Industrial, By Application, 2014–2023 (Usd Million)
Table 59 Market In Europe For Automotive, By Application, 2014–2023 (Usd Million)
Table 60 Market In Europe, By Country, 2014–2023 (Usd Million)
Table 61 Acoustic Wave Sensor Market In Germany, By Device, 2014–2023 (Usd Million)
Table 62 Market In Germany, By Sensing Parameter, 2014–2023 (Usd Million)
Table 63 Market In Germany, By Vertical, 2014–2023 (Usd Million)
Table 64 Market In Uk, By Device, 2014–2023 (Usd Million)
Table 65 Market In Uk, By Sensing Parameter, 2014–2023 (Usd Million)
Table 66 Market In Uk, By Vertical, 2014–2023 (Usd Million)
Table 67 Market In France, By Device, 2014–2023 (Usd Million)
Table 68 Market In France, By Sensing Parameter, 2014–2023 (Usd Million)
Table 69 Market In France, By Vertical, 2014–2023 (Usd Million)
Table 70 Market In Roe, By Device, 2014–2023 (Usd Million)
Table 71 Acoustic Wave Sensor Market In Roe, By Sensing Parameter, 2014–2023 (Usd Million)
Table 72 Market In Roe, By Vertical, 2014–2023 (Usd Million)
Table 73 Market In Apac, By Device, 2014–2023 (Usd Million)
Table 74 Market In Apac, By Sensing Parameter, 2014–2023 (Usd Million)
Table 75 Market In Apac, By Vertical, 2014–2023 (Usd Million)
Table 76 Market In Apac For Industrial, By Application, 2014–2023 (Usd Million)
Table 77 Market In Apac For Automotive, By Application, 2014–2023 (Usd Million)
Table 78 Market In Apac, By Country, 2014–2023 (Usd Million)
Table 79 Market In China, By Device, 2014–2023 (Usd Million)
Table 80 Market In China, By Sensing Parameter, 2014–2023 (Usd Million)
Table 81 Acoustic Wave Sensor Market In China, By Vertical, 2014–2023 (Usd Million)
Table 82 Market In Japan, By Device, 2014–2023 (Usd Million)
Table 83 Market In Japan, By Sensing Parameter, 2014–2023 (Usd Million)
Table 84 Market In Japan, By Vertical, 2014–2023 (Usd Million)
Table 85 Market In India, By Device, 2014–2023 (Usd Million)
Table 86 Market In India, By Sensing Parameter, 2014–2023 (Usd Million)
Table 87 Market In India, By Vertical, 2014–2023 (Usd Million)
Table 88 Market In Roapac, By Device, 2014–2023 (Usd Million)
Table 89 Market In Roapac, By Sensing Parameter, 2014–2023 (Usd Million)
Table 90 Acoustic Wave Sensor Market In Roapac, By Vertical, 2014–2023 (Usd Million)
Table 91 Market In Row, By Device, 2014–2023 (Usd Million)
Table 92 Market In Row, By Sensing Parameter, 2014–2023 (Usd Million)
Table 93 Market In Row, By Vertical, 2014–2023 (Usd Million)
Table 94 Market In Row For Industrial, By Application, 2014–2023 (Usd Million)
Table 95 Acoustic Wave Sensor Market In Row For Automotive, By Application, 2014–2023 (Usd Million)
Table 96 Ranking Of Top 5 Players, 2018
Table 97 Product Launches And Developments, 2014–2023
Table 98 Contracts, 2014–2023
Table 99 Partnerships, 2014–2023
Table 100 Agreements, 2014–2023
List of Figures (38 Figures)
Figure 1 Acoustic Wave Sensor Market: Markets Covered
Figure 2 Market: Research Design
Figure 3 Market Size Estimation Methodology: Bottom-Up Approach
Figure 4 Market Size Estimation Methodology: Top-Down Approach
Figure 5 Data Triangulation
Figure 6 Market, 2014–2023 (USD Million)
Figure 7 Acoustic Wave Sensor Market, By Type, 2017 and 2023
Figure 8 Resonators to Hold Larger Size of Market, 2017 and 2023
Figure 9 Market for Automotive to Grow at Highest CAGR Between 2017 and 2023
Figure 10 Market in APAC to Grow at Highest CAGR During Forecast Period
Figure 11 Demand in Automotive Vertical Expected to Create Attractive Growth Opportunities in Market During the Forecast Period
Figure 12 Saw Sensors to Hold Larger Size of Market During Forecast Period
Figure 13 Market for Torque to Grow at Highest CAGR Between 2017 and 2023
Figure 14 North America to Hold Largest Share of Market in 2017
Figure 15 Market in APAC to Grow at Highest CAGR During Forecast Period
Figure 16 Increasing Demand for Acoustic Wave Sensors in Automotive Vertical Drives Market
Figure 17 Acoustic Wave Sensor Market, By Type
Figure 18 Market for Saw Sensors to Grow at Higher CAGR During Forecast Period
Figure 19 Market, By Device
Figure 20 Acoustic Wave Sensor Market for Resonators in APAC to Grow at Highest CAGR During Forecast Period
Figure 21 Market: By Sensing Parameter
Figure 22 Market for Torque to Grow at Highest CAGR Between 2017 and 2023
Figure 23 Acoustic Wave Sensor, By Vertical
Figure 24 Market for Automotive to Grow at Highest CAGR Between 2017 and 2023
Figure 25 Market for Automotive Torque Measurement to Grow at Highest CAGR During Forecast Period
Figure 26 Market for Food and Beverages for Temperature Sensing to Grow at Highest CAGR During Forecast Period
Figure 27 Market, By Geography
Figure 28 Geographic Snapshot of Market (2017)
Figure 29 Market in APAC to Grow at Highest CAGR During Forecast Period
Figure 30 Snapshot of Market in North America
Figure 31 Acoustic Wave Sensor Market in Europe for Automotive Segment for Tire Pressure Monitoring System to Grow at Highest CAGR Between 2017 and 2023
Figure 32 Snapshot of Acoustic Wave Sensor in APAC
Figure 33 Product Launches and Developments as Key Growth Strategies Adopted By Companies Between 2014 and 2015
Figure 34 Market (Global), Competitive Leadership Mapping, 2017
Figure 35 Market Evolution Framework: Product Launches and Developments Fueled Growth of Market (2014–2015)
Figure 36 Product Launches and Developments as Key Strategy Adopted By Companies
Figure 37 Transense Technologies PLC: Company Snapshot
Figure 38 Vectron International Inc.: Company Snapshot
The study involved 4 major activities in estimating the size of the acoustic wave sensor market. Exhaustive secondary research was done to collect information on the market, peer market, and parent market. The next step was to validate these findings, assumptions, and sizing with industry experts across the value chain through primary research. Both top-down and bottom-up approaches were employed to estimate the complete market size. Thereafter, market breakdown and data triangulation were used to estimate the market size of segments and subsegments.
Secondary Research
The research methodology used to estimate and forecast the acoustic wave sensor market begins with capturing data on revenues of key vendors in the market, through secondary research. This study incorporates extensive use of secondary sources, directories, and databases (such as Hoovers, Bloomberg Businessweek, Factiva, and OneSource) to identify and collect information useful for a technical, market-oriented, and commercial study of the acoustic wave sensor market. Vendor offerings have also been taken into consideration to determine market segmentation. The entire research methodology includes studying annual reports, press releases, and investor presentations of companies; white papers; and certified publications and articles from recognized authors, directories, and databases.
Primary Research
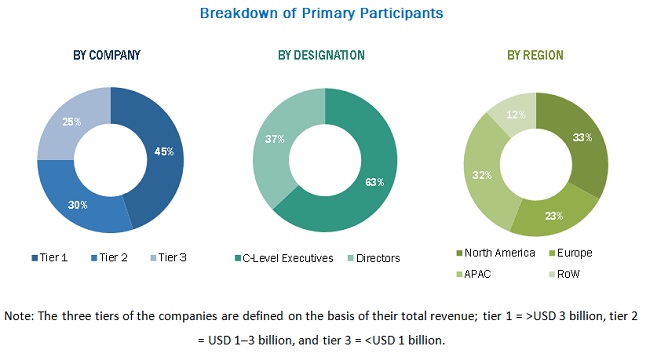
The acoustic wave sensor market comprises several stakeholders, such as suppliers of standard components and original equipment manufacturers (OEMs). The demand side of this market is characterized by the development of military, automotive, industrial healthcare, food and beverages, environment, and other end-user verticals. The supply side is characterized by advancements in the types of sensors and diverse offerings. Various primary sources from both the supply and demand sides of the market have been interviewed to obtain qualitative and quantitative information. Following is the breakdown of primary respondents.
To know about the assumptions considered for the study, download the pdf brochure
Market Size Estimation
Both top-down and bottom-up approaches have been used to estimate and validate the size of the acoustic wave sensor market and its subsegments. The research methodology used to estimate the market size includes the following:
- Key players in the market have been identified through extensive secondary research.
- The industry’s supply chain and market size, in terms of value, have been determined through primary and secondary research processes.
- All percentage shares, splits, and breakdowns have been determined using secondary sources and verified through primary sources.
Data Triangulation
After arriving at the overall market size—using the estimation processes explained above—the market was split into several segments and subsegments. To complete the overall market engineering process and arrive at the exact statistics of each market segment and subsegment, data triangulation and market breakdown procedures have been employed, wherever applicable. The data have been triangulated by studying various factors and trends in both the demand and supply sides of the acoustic wave sensor market.
Research Objective
- To describe and forecast the acoustic wave sensor market, in terms of value, by type, device, sensing parameter, vertical, and region
- To describe and forecast the acoustic wave sensor market, in terms of value, by region–Asia Pacific (APAC), Europe, North America, and Rest of the World (RoW), along with their respective countries
- To provide detailed information regarding the major factors influencing the market growth (drivers, restraints, opportunities, and challenges)
- To strategically analyze micromarkets with respect to individual growth trends, prospects, and contributions to the overall market
- To study the complete value chain of the acoustic wave sensor market
- To analyze opportunities in the market for stakeholders by identifying the high-growth segments of the acoustic wave sensor ecosystem
- To strategically profile key players and comprehensively analyze their market positions in terms of ranking and core competencies, along with detailing competitive landscape for market leaders
- To analyze strategic approaches, such as product launches, acquisitions, contracts, agreements, and partnerships, in the acoustic wave sensor market
Available Customizations
Along with the market data, MarketsandMarkets offers customizations according to a company’s specific needs. The following customization options are available for the report:
Company Information
- Detailed analysis and profiling of additional market players (up to 5)


Growth opportunities and latent adjacency in Acoustic Wave Sensor Market