Active Ingredients Market for Cosmetics by Functionality (Conditioning Agents, UV Filters, Anti-Aging Agents, Skin Lightening Agents), Application (Skin Care, Hair Care) - Global Forecast to 2026


[131 Pages Report] The Active Ingredients Market for cosmetic was valued at USD 2.63 Billion in 2015 and is projected to register a CAGR of 5.2% from 2016 to 2026. In this report, 2015 is considered as the base year and the forecast period is from 2016 to 2026.
The objectives of this study are:
- To analyze and forecast the market size of cosmetic active ingredients, in terms of value
- To provide detailed information regarding the important factors influencing the growth of the market (drivers, restraints, and opportunities)
- To strategically analyze the segmented markets with respect to individual growth trends, prospects, and contribution to the overall market
- To identify and analyze opportunities for stakeholders in the market
- To define, describe, and segment the cosmetic active ingredients market by functionality and application
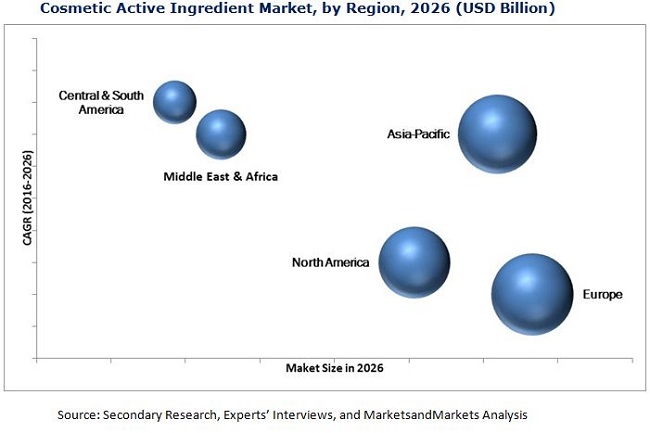
- To forecast the sizes of the market segments based on regions, namely, Asia-Pacific, Europe, North America, Middle East & Africa, and Central & South America
- To analyze competitive developments such as supply contracts, expansions, and partnerships & collaborations in the global active ingredients market for cosmetics
- To strategically profile key players and comprehensively analyze their core competencies
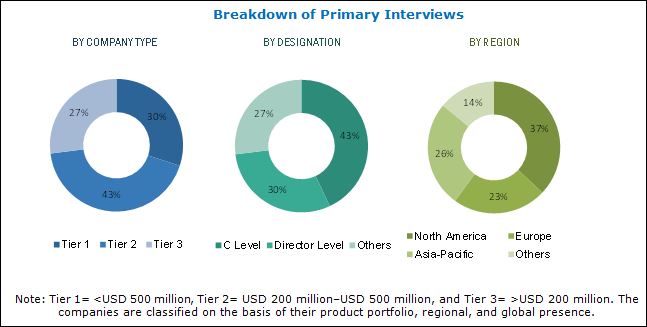
This research study involves extensive use of secondary sources, directories, and databases (such as Hoovers, Bloomberg BusinessWeek, and Factiva) to identify and collect information useful for this technical, market-oriented, and commercial study of the global active ingredients market for cosmetics. The primary sources mainly include several industry experts from core and related industries and preferred suppliers, manufacturers, distributors, service providers, and organizations related to all segments of the industry’s supply chain. After arriving at the total market size, the overall market has been split into several segments and subsegments. The figure below illustrates the breakdown of the primary interviews based on company type, designation, and region conducted during the research study.
To know about the assumptions considered for the study, download the pdf brochure
The cosmetic active ingredients value chain starts with the procurement of raw materials required for the manufacturing of the required ingredients. The raw materials used for the production are salicylic acid, selenium sulfide, hyaluronic acid, niacinamide, and oxybenzones, among others. The use of other raw material depends upon the type of cosmetic active ingredients being produced.
These raw materials are made available to cosmetic active ingredients manufacturers either by supplying or by vertical integration. The ingredient manufacturers tailor their products and have patents approved by the regulatory authorities. The active ingredients prepared by these manufacturers can comprise a single chemical or a mix of two or more chemicals as per the function it has to perform. The major manufacturers of cosmetic active ingredients are AkzoNobel N.V. (Netherlands), BASF SE (Germany), Clariant AG (Switzerland), Sederma Inc. (France), and Evonik Industries AG (Germany). Cosmetic active ingredients are then either sold directly to the end users or through distributors. The end-use companies involved in the use of these active ingredients are Procter & Gamble Co. (U.S.), L'Oréal S.A. (France), Unilever (U.K.), Avon Products Inc. (U.S.), and Beiersdorf AG (Germany), among others.
Target Audience:
- Cosmetic Active Ingredients Manufacturers
- Cosmetic Active Ingredients Dealers
- Cosmetic Active Ingredients Suppliers
- End-use Industries
- Raw Material Suppliers and Others
Scope of the Report:
This report categorizes the cosmetic active ingredients market based on functionality, application, and region.
Market Segmentation, by Functionality:
- Conditioning Agents
- UV Filters
- Anti-ageing Agents
- Skin-lightening Agents
Market Segmentation, by Application:
- Skin Care
- Hair Care
Market Segmentation, by Region:
- North America
- Europe
- Asia-Pacific
- Middle East & Africa
- Central & South America
Available Customizations
With the given market data, MarketsandMarkets offers customizations according to the company’s specific needs. The following customization options are available for the report:
Product Analysis
- Product matrix that gives a detailed comparison of the product portfolio of each company
Regional Analysis
- Further breakdown of a region with respect to a particular country
Company Information
- Detailed analysis and profiles of additional market players (up to five)
The global active ingredient market for cosmetics was USD 2.63 Billion in 2015 and is projected to register a CAGR of 5.2% from 2016 to 2026. The growth in the market is triggered by the growing population across the globe and the rising demand of consumers to look good. Rising concerns for aging skin and the need for an even skin-tone are also contributing towards the increase in use of cosmetic active ingredients.
The market is dominated by the skin care application mainly because of the increasing demand of anti-aging, skin lightening, and sunscreen products due to the growing awareness among consumers towards their health and skin. Moreover, the growing demand for men’s grooming products is increasing the demand of skin and hair care products, thereby, leading to a rising demand of active ingredients for cosmetics.
The active ingredient market for cosmetics, based on functionality, is classified into conditioning agents, UV filters, anti-aging agents, skin lightening agents, and others. The others category includes cleansing agents, soothing agents, self-tanning agents, anti-acne, anti-oxidants, emollients, and so on. The conditioning agent segment accounted for the largest share of the market in 2015. Low cost and wide applicability of conditioning agents in skin care and hair care applications makes it more suitable to use in the cosmetics industry. However, the anti-aging agents segment is expected to witness the highest CAGR between 2016 and 2021. The aging baby boomers are expected to drive the market for anti-aging agents by using more anti-aging cosmetic products to cure/improve wrinkles, frown lines, and aging process.
Europe is projected to be the largest market during the forecast period because of the high per capita spending power of consumers on cosmetic products. The dominance is expected to continue between 2016 and 2021. Key market players such as BASF SE (Germany), Evonik Industries AG (Germany) and Seppic SA (France) are expanding their active ingredient for cosmetics business in the region as it is the most lucrative market.
The major factor restraining the growth of the active ingredient for cosmetics market is the high cost associated with shifting to products from natural or organic origin. The higher feedstock cost is pulling back the ingredient manufacturers to choose organic based products in cosmetic formulations. in addition, there is a concern among consumers towards the long-lasting nature of natural/organic cosmetic products as compared to the synthetic cosmetics, which is further restraining the active ingredients market for cosmetics to grow.
The competitiveness of the cosmetic active ingredients market is continuously increasing with innovative and new product launches. Strategic developments are mostly undertaken by major players such as AkzoNobel N.V. (The Netherlands), BASF SE (Germany), Ashland Inc. (U.S.), Seppic SA (France), Evonik Industries AG (Germany), Clariant AG (Switzerland), and Lonza (Switzerland), among others.
Please visit 360Quadrants to see the vendor listing of Top 20 Personal Care Ingredients Companies, Worldwide 2023
To speak to our analyst for a discussion on the above findings, click Speak to Analyst
 Exclusive indicates content/data unique to MarketsandMarkets and not available with any competitors.
Table of Contents
1 Introduction (Page No. - 13)
1.1 Objectives of the Study
1.2 Market Definition
1.2.1 Market Scope
1.2.2 Years Considered for the Study
1.3 Currency
1.4 Limitations
1.5 Stakeholders
2 Research Methodology (Page No. - 17)
2.1 Research Data
2.1.1 Secondary Data
2.1.1.1 Key Data From Secondary Sources
2.1.2 Primary Data
2.1.2.1 Key Data From Primary Sources
2.1.2.2 Key Industry Insights
2.1.2.3 Breakdown of Primary Interviews
2.2 Market Size Estimation
2.2.1 Bottom-Up Approach
2.2.2 Top-Down Approach
2.3 Data Triangulation
2.4 Research Assumptions
3 Executive Summary (Page No. - 25)
4 Premium Insights (Page No. - 29)
4.1 Significant Opportunities in the Active Ingredient for Cosmetics Market
4.2 Robust Growth for Active Ingredient for Cosmetics Market
4.3 Europe Active Ingredient for Cosmetics Market Share, By Major Country and Functionality, 2015
4.4 Active Ingredient for Cosmetics Market Attractiveness, 2016–2021
4.5 Active Ingredient for Cosmetics Market, By Application and Region, 2015
5 Market Overview (Page No. - 32)
5.1 Introduction
5.2 Market Segmentation
5.2.1 By Functionality
5.2.2 By Application
5.2.3 By Region
5.3 Market Dynamics
5.3.1 Drivers
5.3.1.1 Increasing Demand for Multifunctional Ingredients
5.3.1.2 Accelerating Demand for Anti-Ageing, Skin Whitening, and Sun Protection Products
5.3.2 Restraints
5.3.2.1 High Cost of Organic Products
5.3.3 Opportunities
5.3.3.1 Shifting Focus Towards Male Specific Cosmetics
6 Industry Trends (Page No. - 38)
6.1 Introduction
6.2 Value Chain Analysis
6.2.1 Raw Materials
6.2.2 Ingredient Manufacturing
6.2.3 End Use Product
6.3 Porter’s Five Forces Analysis
6.3.1 Threat of New Entrants
6.3.2 Threat of Substitutes
6.3.3 Bargaining Power of Suppliers
6.3.4 Bargaining Power of Buyers
6.3.5 Intensity of Competitive Rivalry
6.4 Industry Outlook
6.4.1 Population Statistics
7 Active Ingredient for Cosmetics Market, By Functionality (Page No. - 44)
7.1 Introduction
7.2 Conditioning Agent
7.3 UV Filters
7.4 Anti-Ageing Agents
7.5 Skin Lightening Agents
8 Active Ingredient for Cosmetics Market, By Application (Page No. - 50)
8.1 Introduction
8.2 Skin Care
8.2.1 Body Care
8.2.2 Face Care
8.2.3 Sun Care
8.3 Hair Care
8.3.1 Shampoos
8.3.2 Dyes
9 Active Ingredients for Cosmetics Market, By Region (Page No. - 54)
9.1 Introduction
9.2 Europe
9.2.1 Conditioning Agents to Account for the Largest Market Share in the European Cosmetic Active Ingredients Market
9.2.2 Skin Care Application to Hold the Largest Share of the European Cosmetic Active Ingredients Market
9.2.3 Country Level Analysis
9.2.3.1 Germany
9.2.3.2 France
9.2.3.3 United Kingdom
9.2.3.4 Italy
9.2.3.5 Spain
9.2.3.6 Russia
9.2.3.7 Netherlands
9.3 Asia-Pacific
9.3.1 Conditioning Agents Dominates the Asia-Pacific Cosmetic Active Ingredients Market
9.3.2 Cosmetic Active Ingredients Market in Skin Care Application to Witness the Highest CAGR
9.3.3 Country Level Analysis
9.3.3.1 Japan
9.3.3.2 China
9.3.3.3 India
9.3.3.4 South Korea
9.3.3.5 Indonesia
9.3.3.6 Australia
9.3.3.7 Singapore
9.4 North America
9.4.1 Anti-Ageing Agents to Witness the Highest Growth in the North American Cosmetic Active Ingredients Market
9.4.2 Skin Care to Be the Fastest-Growing Application in the North American Cosmetic Active Ingredients Market
9.4.3 Country Level Analysis
9.4.3.1 U.S.
9.4.3.2 Canada
9.4.3.3 Mexico
9.5 Middle East & Africa
9.5.1 Anti-Ageing Agents to Be the Fastest-Growing Functionality of the Middle East & Africa Cosmetic Active Ingredients Market
9.5.2 Skin Care Application Dominates the Middle East & Africa Cosmetic Active Ingredients Market
9.5.3 Country Level Analysis
9.5.3.1 Saudi Arabia
9.5.3.2 Turkey
9.6 Central & South America
9.6.1 UV Filters to Be the Fastest-Growing Segment in the Central & South American Active Ingredients for Cosmetics Market
9.6.2 Skin Care Application to Witness the Highest CAGR in Central & South American Cosmetic Active Ingredients Market
9.6.3 Country Level Analysis
9.6.3.1 Brazil
9.6.3.2 Argentina
10 Competitive Landscape (Page No. - 87)
10.1 Overview
10.2 Major Players
10.2.1 Competitive Benchmarking
10.3 New Product Launches: the Most Popular Growth Strategy
10.4 Market Share of Key Players
10.5 Competitive Situation and Trends
10.5.1 New Product Launches
10.5.2 Expansions
10.5.3 Mergers & Acquisitions
10.5.4 Others
11 Company Profiles (Page No. - 95)
(Overview, Financial*, Products & Services, Strategy, and Developments)
11.1 Akzonobel N.V.
11.2 Ashland Inc.
11.3 BASF SE
11.4 Clariant AG
11.5 Evonik Industries AG
11.6 Lonza
11.7 Gattefossé
11.8 Lucas Meyer Cosmetics
11.9 Sederma Inc.
11.10 Seppic SA
11.11 Other Players
11.11.1 Cp Kelco (A Huber Company)
11.11.2 Eastman Chemical Company
11.11.3 Emery Oleochemicals Group
11.11.4 Evonik Industries AG
11.11.5 Givaudan SA
11.11.6 Lonza Group Ltd
11.11.7 Symrise AG
11.11.8 Sonneborn LLC
11.11.9 Vantage Specialty Ingredients Inc.
11.11.10 United-Guardian, Inc.
*Details Might Not Be Captured in Case of Unlisted Companies.
12 Appendix (Page No. - 121)
12.1 Insights From Industry Experts
12.2 Discussion Guide
12.3 Knowledge Store: Marketsandmarkets’ Subscription Portal
12.4 Introducing RT: Real Time Market Intelligence
12.5 Available Customizations
12.6 Related Reports
12.7 Author Details
List of Tables (75 Tables)
Table 1 Active Ingredients for Cosmetics Market, By Functionality
Table 2 Active Ingredients for Cosmetics Market, By Application
Table 3 Active Ingredients for Cosmetics Market, By Region
Table 4 Asia-Pacific Countries Accounted for the Highest Population in 2013
Table 5 Active Ingredient for Cosmetics Market Size, By Functionality, 2014–2026 (USD Million)
Table 6 Conditioning Agents: Active Ingredient for Cosmetics Market Size, By Region, 2014–2026 (USD Million)
Table 7 UV Filters: Active Ingredient for Cosmetics Market Size, By Region, 2014–2026 (USD Million)
Table 8 Anti-Ageing Agents: Active Ingredient for Cosmetics Market Size, By Region, 2014–2026 (USD Million)
Table 9 Skin Lightening Agents: Active Ingredient for Cosmetics Market Size, By Region, 2014–2026 (USD Million)
Table 10 Active Ingredient for Cosmetics Market Size, By Application, 2014–2026 (USD Million)
Table 11 Active Ingredient for Cosmetics Market Size in Skin Care Application, By Region, 2014–2026 (USD Million)
Table 12 Active Ingredient for Cosmetics Market Size in Hair Care Application, By Region, 2014–2026 (USD Million)
Table 13 Active Ingredients for Cosmetics Market Size, By Region, 2014–2026 (USD Million)
Table 14 Europe: Active Ingredients for Cosmetics Market Size, By Functionality, 2014–2026 (USD Million)
Table 15 Europe: Active Ingredients for Cosmetics Market Size, By Application, 2014–2026 (USD Million)
Table 16 Europe: Active Ingredients for Cosmetics Market Size, By Country, 2014–2026 (USD Million)
Table 17 Germany: Active Ingredients for Cosmetics Market Size, By Functionality, 2014–2026 (USD Million)
Table 18 Germany: Active Ingredients for Cosmetics Market Size, By Application, 2014–2026 (USD Million)
Table 19 France: Active Ingredients for Cosmetics Market Size, By Functionality, 2014–2026 (USD Million)
Table 20 France: Active Ingredients for Cosmetics Market Size, By Application, 2014–2026 (USD Million)
Table 21 United Kingdom: Active Ingredients for Cosmetics Market Size, By Functionality, 2014–2026 (USD Million)
Table 22 United Kingdom: Active Ingredients for Cosmetics Market Size, By Application, 2014–2026 (USD Million)
Table 23 Italy: Active Ingredients for Cosmetics Market Size, By Functionality, 2014–2026 (USD Million)
Table 24 Italy: Active Ingredients for Cosmetics Market Size, By Application, 2014–2026 (USD Million)
Table 25 Spain: Active Ingredients for Cosmetics Market Size, By Functionality, 2014–2026 (USD Million)
Table 26 Spain: Active Ingredients for Cosmetics Market Size, By Application, 2014–2026 (USD Million)
Table 27 Russia: Active Ingredients for Cosmetics Market Size, By Functionality, 2014–2026 (USD Million)
Table 28 Russia: Active Ingredients for Cosmetics Market Size, By Application, 2014–2026 (USD Million)
Table 29 Netherlands: Active Ingredients for Cosmetics Market Size, By Functionality, 2014–2026 (USD Million)
Table 30 Netherlands: Active Ingredients for Cosmetics Market Size, By Application, 2014–2026 (USD Million)
Table 31 Asia-Pacific: Active Ingredients for Cosmetics Market Size, By Functionality, 2014–2026 (USD Million)
Table 32 Asia-Pacific: Active Ingredients for Cosmetics Market Size, By Application, 2014–2026 (USD Million)
Table 33 Asia-Pacific: Active Ingredients for Cosmetics Market Size, By Country, 2014–2026 (USD Million)
Table 34 Japan: Active Ingredients for Cosmetics Market Size, By Functionality, 2014–2026 (USD Million)
Table 35 Japan: Active Ingredients for Cosmetics Market Size, By Application, 2014–2026 (USD Million)
Table 36 China: Active Ingredients for Cosmetics Market Size, By Functionality, 2014–2026 (USD Million)
Table 37 China: Active Ingredients for Cosmetics Market Size, By Application, 2014–2026 (USD Million)
Table 38 India: Active Ingredients for Cosmetics Market Size, By Functionality, 2014–2026 (USD Million)
Table 39 India: Active Ingredients for Cosmetics Market Size, By Application, 2014–2026 (USD Million)
Table 40 South Korea: Active Ingredients for Cosmetics Market Size, By Functionality, 2014–2026 (USD Million)
Table 41 South Korea: Active Ingredients for Cosmetics Market Size, By Application, 2014–2026 (USD Million)
Table 42 Indonesia: Active Ingredients for Cosmetics Market Size, By Functionality, 2014–2026 (USD Million)
Table 43 Indonesia: Active Ingredients for Cosmetics Market Size, By Application, 2014–2026 (USD Million)
Table 44 Australia: Active Ingredients for Cosmetics Market Size, By Functionality, 2014–2026 (USD Million)
Table 45 Australia: Active Ingredients for Cosmetics Market Size, By Application, 2014–2026 (USD Million)
Table 46 Singapore: Active Ingredients for Cosmetics Market Size, By Functionality, 2014–2026 (USD Million)
Table 47 Singapore: Active Ingredients for Cosmetics Market Size, By Application, 2014–2026 (USD Million)
Table 48 North America: Active Ingredients for Cosmetics Market Size, By Functionality, 2014–2026 (USD Million)
Table 49 North America: Active Ingredients for Cosmetics Market Size, By Application, 2014–2026 (USD Million)
Table 50 North America: Active Ingredients for Cosmetics Market Size, By Country, 2014–2026 (USD Million)
Table 51 U.S.: Active Ingredients for Cosmetics Market Size, By Functionality, 2014–2026 (USD Million)
Table 52 U.S.: Active Ingredients for Cosmetics Market Size, By Application, 2014–2026 (USD Million)
Table 53 Canada: Active Ingredients for Cosmetics Market Size, By Functionality, 2014–2026 (USD Million)
Table 54 Canada: Active Ingredients for Cosmetics Market Size, By Application, 2014–2026 (USD Million)
Table 55 Mexico: Active Ingredients for Cosmetics Market Size, By Functionality, 2014–2026 (USD Million)
Table 56 Mexico: Active Ingredients for Cosmetics Market Size, By Application, 2014–2026 (USD Million)
Table 57 Middle East & Africa: Active Ingredients for Cosmetics Market Size, By Functionality, 2014–2026 (USD Million)
Table 58 Middle East & Africa: Active Ingredients for Cosmetics Market Size, By Application, 2014–2026 (USD Million)
Table 59 Middle East & Africa: Active Ingredients for Cosmetics Market Size, By Country, 2014–2026 (USD Million)
Table 60 Saudi Arabia: Active Ingredients for Cosmetics Market Size, By Functionality, 2014–2026 (USD Million)
Table 61 Saudi Arabia: Active Ingredients for Cosmetics Market Size, By Application, 2014–2026 (USD Million)
Table 62 Turkey: Active Ingredients for Cosmetics Market Size, By Functionality, 2014–2026 (USD Million)
Table 63 Turkey: Active Ingredients for Cosmetics Market Size, By Application, 2014–2026 (USD Million)
Table 64 Central & South America: Active Ingredients for Cosmetics Market Size, By Functionality, 2014–2026 (USD Million)
Table 65 Central & South America: Active Ingredients for Cosmetics Market Size, By Application, 2014–2026 (USD Million)
Table 66 Central & South America: Active Ingredients for Cosmetics Market Size, By Country, 2014–2026 (USD Million)
Table 67 Brazil: Active Ingredients for Cosmetics Market Size, By Functionality, 2014–2026 (USD Million)
Table 68 Brazil: Active Ingredients for Cosmetics Market Size, By Application, 2014–2026 (USD Million)
Table 69 Argentina: Active Ingredients for Cosmetics Market Size, By Functionality, 2014–2026 (USD Million)
Table 70 Argentina: Active Ingredients for Cosmetics Market Size, By Application, 2014–2026 (USD Million)
Table 71 Active Ingredients Market Players
Table 72 New Product Launches, 2013–2016
Table 73 Expansions, 2013–2016
Table 74 Mergers & Acquisitions, 2013–2016
Table 75 Others, 2013–2016
List of Figures (30 Figures)
Figure 1 Active Ingredients for Cosmetics Market Segmentation
Figure 2 Active Ingredients for Cosmetics Market: Research Design
Figure 3 Breakdown of Primary Interviews
Figure 4 Market Size Estimation: Bottom-Up Approach
Figure 5 Market Size Estimation: Top-Down Approach
Figure 6 Data Triangulation
Figure 7 Conditioning Agent to Dominate the Active Ingredient for Cosmetics Market, 2016-2021
Figure 8 Skin Care Application Constitute Major Share in the Active Ingredient for Cosmetics Market, 2016-2021
Figure 9 Asia-Pacific to Register the Highest CAGR in the Active Ingredient for Cosmetics Market
Figure 10 Long-Term Prospects for Active Ingredient for Cosmetics Market Between 2016 and 2021
Figure 11 Asia-Pacific to Be the Key Market for Active Ingredient for Cosmetics, 2016–2021
Figure 12 Conditioning Agent Accounted for the Largest Market Share in 2015
Figure 13 Asia-Pacific to Be the Fastest-Growing Region, 2016–2021
Figure 14 Skin Care Accounted for the Largest Share Across All Regions, 2015
Figure 15 Impact Analysis: Overview of Forces Governing the Market
Figure 16 Value Chain of Active Ingredient for Cosmetics Market
Figure 17 Porter’s Five Forces Analysis
Figure 18 Conditioning Agents to Dominate the Active Ingredient for Cosmetics Market
Figure 19 Europe to Drive the Demand for Conditioning Agents Market Used as Active Ingredient in Cosmetics
Figure 20 Skin Care Application to Dominate the Active Ingredient for Cosmetics Market
Figure 21 Regional Snapshot (2016–2021): Asia-Pacific Countries Emerging as New Hotspot for the Active Ingredients for Cosmetics Market
Figure 22 Europe Market Snapshot: Germany Dominates the European Active Ingredients for Cosmetics Market
Figure 23 Companies Primarily Adopted Organic Growth Strategies
Figure 24 Major Companies Dominating the Global Cosmetic Active Ingredients Market in 2015
Figure 25 Akzonobel N.V: Company Snapshot
Figure 26 Ashland Inc.: Company Snapshot
Figure 27 BASF SE: Company Snapshot
Figure 28 Clariant AG: Company Snapshot
Figure 29 Evonik Industries AG: Company Snapshot
Figure 30 Lonzas: Company Snapshot


Growth opportunities and latent adjacency in Active Ingredients Market