Active Network Management Market by Component (Software and Services), Service (Professional and Managed Services), Organization Size (SMEs and Large Enterprises), Application Area (Power, Energy & Utilities), and Region - Global Forecast to 2023


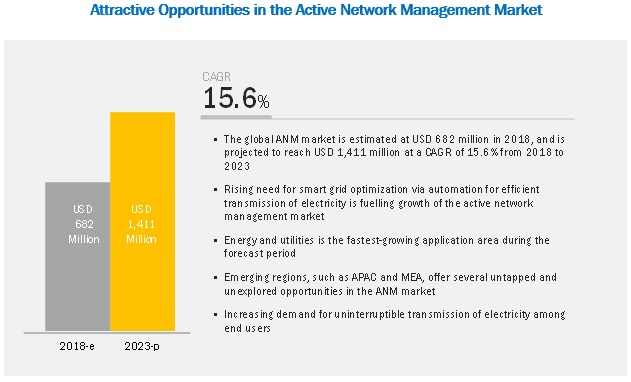
[132 Pages Report] The global Active Network Management Market size is expected grow from USD 682 million in 2018 to USD 1,411 million by 2023, at a Compound Annual Growth Rate (CAGR) of 15.6% during the forecast period. The growth in renewable energy commercialization and increasing demand for uninterruptable transmission of electricity among users will drive the market.
Active Network Management (ANM) software helps manage network constraints in real-time to avoid the reinforcement or replacement of existing assets. The technique is employed by Distribution Network Operators (DNOs) to facilitate the connection of renewable generation to distribution networks. The ANM systems maintain and manage the network parameters, such as voltage, power, phase balance, reactive power, and frequency within predetermined limits, thereby increasing the utilization of network assets and reducing infrastructure costs. ANM records continuous measurements required to control demand and the generation of power, while it minimizes network losses, stabilizes systems, and detects faults in real time.
Solution segment to be the largest contributor to the Active Network Management Market growth during the forecast period
Solution segment is expected to hold the largest market share in the market. The ANM software helps DNO to display current load flow and flow direction in networks, and calculates load values, voltage range violations, and overload situations. ANM software are gaining traction due to the increasing demand among enterprises to monitor and control the operations of all network components, such as smaller energy generators, renewable generation, and storage devices.
Electric power transmission segment to grow at the highest rate in the Active Network Management market during the forecast period
Under application area, the energy and utilities segment is further segmented into oil and gas, electric power transmission, and water treatment and distribution. Among these, electric power transmission is expected to grow at the highest CAGR during the forecast period, due to increasing need to supervise, control, optimize, and manage flows in the transmission systems.
Power segment to account for the largest market size in the Active Network Management Market
Among application area, the power segment is expected to hold the largest market size in the market. The network complexities in power industries are increasing day by day. Active network management software helps power companies meet the challenges of aging grid infrastructures, monitor the power system operations, maintain the balance between power generation and production, and provide a fast and efficient way to restore services after interruptions.
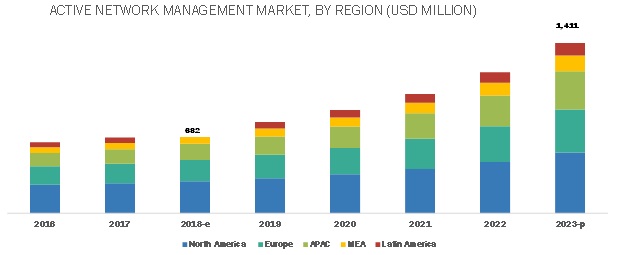
North America to hold the largest market size during the forecast period
North America is estimated to account for the highest market share in the active network management market. Early adoption of ANM software and the presence of several vendors that provide ANM software�s are expected to drive market growth in the region. Businesses in the region are increasingly implementing ANM solutions to better manage network operations across applications in the power, and energy and utilities industries.
Key Active Network Management Market Players
Major vendors in the market include GE (US), ABB (Switzerland), Siemens (Germany), Schneider Electric (France), Itron (US), Landis+Gyr (Switzerland), Cisco (US), IBM (US), Oracle (US), Smarter Grid Solutions (UK), Indra (Spain), Chemtrols Industries (India), Camlin (Ireland), Ziv (France), and Argand Solutions (UK).
Scope of the report
|
Report Metric |
Details |
|
Market size available for years |
2016�2023 |
|
Base year considered |
2017 |
|
Forecast period |
2018�2023 |
|
Forecast units |
Value (USD million) |
|
Segments covered |
Component, Organization Size, Application Area, and Region |
|
Geographies covered |
North America, Europe, APAC, MEA, and Latin America |
|
Companies Covered |
General Electric (US), ABB (Switzerland), Siemens (Germany), Schneider Electric SE (France), Itron (US), Landis+Gyr (Switzerland), Cisco (US), IBM (US), Oracle (US), Smarter Grid Solutions, and Indra Sistemas (Spain), Chemtrols (India), Camlin (Ireland), Smarter Grid Solutions (UK), ZIV (France), and Argand Solutions (UK). |
This research report categorizes the market based on component (software and, services), application area, organization and region.
On the basis of component, the Active Network Management Market has the following segments:
- Solution
- Services
- Professional Services
- Consulting Services
- System Integration
- Support and Maintenance
- Managed Services
- Professional Services
On the basis of organization size, the market has the following segments:
- Small And Medium Size Enterprises (SMEs)
- Large Enterprises
On the basis of application Area, the Active Network Management market has the following segments:
- Power
- Power Generation
- Thermal Power Plants
- Nuclear Power Plants
- Renewable Power Plants
- Power Grids
- Power Generation
- Energy and utilities
- Oil and Gas
- Electric Power Transmission
- Water Treatment and Distribution
- Others (Manufacturing, Government and Transportation)
On the basis of Region, the market has the following segments:
- North America
- United States (US)
- Canada
- Europe
- United Kingdom (UK)
- Germany
- Rest of Europe
- Asia Pacific (APAC)
- China
- Japan
- India
- Rest of APAC
- Middle East and Africa (MEA)
- Middle East
- Africa
- Latin America
- Brazil
- Mexico
- Rest of Latin America
Available Customizations
With the given market data, MarketsandMarkets offers customizations as per the company�s specific needs. The following customization options are available for the report:
Product Analysis
- Product matrix that gives the detailed comparison of the product portfolio of each company
Geographic Analysis
- Further breakup of the North American Active Network Management Market
- Further breakup of the European market
- Further breakup of the APAC market
- Further breakup of the MEA market
- Further breakup of the Latin American market
Company Information
- Detailed analysis and profiling of the additional market players
Recent Developments
- In February 2019, ABB launched its new ABB Ability e-mesh solution. This solution would provide power grid operators an integrated, single, and unified view of their Distributed Energy Resources (DERs), such as microgrids, Battery Energy Storage Systems (BESS), and renewable power generation.
Key Questions addressed by the report
- What are new market segments to focus over the next 2�5 years for prioritizing the efforts and investments?
- Which are the key players in the market and how intense is the competition?
- What are the new innovations and developments done by the major market players?
- What are the driving factors, opportunities, restraints, and challenges that drive or hamper the growth of the market?
- What are the regulatory implications that impact the market directly and indirectly?
Frequently Asked Questions (FAQ):
What is the definition of active network management?
What are the key objectives of active network management?
Some of the key objectives of active network management are:
- To facilitate the transmission of renewable energy to distribution networks
- Maintain and manage network parameters, such as voltage, power, phase balance, reactive power, and frequency, within predetermined limits.
- Optimize utilization of network assets
- Reduce infrastructure costs.
What are the evolving trends impacting the active network management market?
What is the active network management market size?
Which are the leading vendors operating in this market?
To speak to our analyst for a discussion on the above findings, click Speak to Analyst
 Exclusive indicates content/data unique to MarketsandMarkets and not available with any competitors.
Table of Contents
1 Introduction (Page No. - 17)
1.1 Objectives of the Study
1.2 Market Definition
1.3 Market Scope
1.3.1 Market Segmentation
1.3.2 Regions Covered
1.4 Years Considered for the Study
1.5 Currency
1.6 Stakeholders
2 Research Methodology (Page No. - 21)
2.1 Research Data
2.1.1 Breakup of Primary Participants� Profiles
2.1.2 Key Industry Insights
2.2 Market Breakup and Data Triangulation
2.3 Market Size Estimation
2.4 Factor Analysis
2.5 Assumptions for the Study
2.6 Limitations of the Study
3 Executive Summary (Page No. - 28)
4 Premium Insights (Page No. - 32)
4.1 Attractive Market Opportunities in the Active Network Management Market
4.2 Market By Component, 2018
4.3 Market By Service, 2018
4.4 Market Share of Professional Services and Top 3 Regions, 2018
4.5 Market By Organization Size, 2018
4.6 Market Top 2 Application Areas
4.7 Market Investment Scenario
5 Market Overview (Page No. - 36)
5.1 Introduction
5.2 Market Dynamics
5.2.1 Drivers
5.2.1.1 Rising Need for Smart Grid Optimization Via Automation for Efficient Transmission of Electricity
5.2.1.2 Growth in Renewable Energy (Solar and Wind Power) Commercialization
5.2.1.3 Increasing Demand for Uninterruptible Transmission of Electricity Among End Users
5.2.2 Restraints
5.2.2.1 High Cost of ANM Technology Deployment
5.2.3 Opportunities
5.2.3.1 Growth in Adoption of IoT/Connected Devices Across the Energy and Utilities Ecosystem
5.2.3.2 Rising Number of Smart City Projects Leading to the Adoption of Smart Energy Distribution Strategies
5.2.4 Challenges
5.2.4.1 Integration of Smart Grid Technologies With Existing Systems
6 Active Network Management Market, By Component (Page No. - 41)
6.1 Introduction
6.2 Software
6.2.1 Need for Controlling Voltage Fluctuations Within Power and Electric Grid Networks to Drive the Adoption of Active Network Management Software
6.3 Services
6.3.1 Professional Services
6.3.1.1 Consulting
6.3.1.1.1 Need for Enhancing Organizations� Strategic Outlook to Drive the Demand for Consulting Services
6.3.1.2 System Integration
6.3.1.2.1 Integration Services to Ease the Complexities in Deploying Various Solutions in IT Infrastructures
6.3.1.3 Support and Maintenance
6.3.1.3.1 Growing Need for Emergency Response Management to Drive the Demand for Support and Maintenance Services
6.3.2 Managed Services
6.3.2.1 Need for Expertise During Integration of Two Different Technologies on the Same Platform to Generate the Demand for Managed Services
7 Active Network Management Market, By Organization Size (Page No. - 50)
7.1 Introduction
7.2 Small and Medium-Sized Enterprises
7.2.1 Early Adoption of ANM Software and Services to Drive the Growth of Market Among SMEs
7.3 Large Enterprises
7.3.1 Cost Benefits of ANM Software to Boost the Adoption of ANM Software Among Large Enterprises
8 Active Network Management Market, By Application Area (Page No. - 54)
8.1 Introduction
8.2 Power
8.2.1 Power Generation
8.2.1.1 Thermal Power Plants
8.2.1.1.1 Complex Nature of Distributed Thermal Power Plants to Drive the Adoption of ANM Software in Thermal Power Plants
8.2.1.2 Nuclear Power Plants
8.2.1.2.1 Increasing Need to Configure Network Infrastructure Driving the Adoption of ANM Software in Nuclear Power Plants
8.2.1.3 Renewable Power Plants
8.2.1.3.1 Growing Demand for ANM Software to Drive the Growth of active network management Market in Renewable Power Plants
8.2.2 Power Grids
8.2.2.1 Increasing the Efficiency of Power Generation and Reducing the Losses in Transmission, Distribution, and Consumption of Electrical Energy to Drive the Adoption of ANM Software in Power Grids
8.3 Energy and Utilities
8.3.1 Oil and Gas
8.3.1.1 Need to Control the Flow of Oil and Gas in Field-Area Networks Driving the Growth of Market in the Oil and Gas Sector
8.3.2 Electric Power Transmission
8.3.2.1 Need to Supervise, Control, Optimize, and Manage Flows in Transmission Systems Driving the Adoption of ANM Software in Electric Power Transmission
8.3.3 Water Treatment and Distribution
8.3.3.1 Need to Secure the Industrial Networks and Extensive Network Infrastructures Driving the Adoption of ANM Software in Water Treatment and Distribution
8.4 Others
9 Active Network Management Market, By Region (Page No. - 64)
9.1 Introduction
9.2 North America
9.2.1 United States
9.2.1.1 Growing Adoption of Smart Grid Technology to Drive the Growth of Market in the US
9.2.2 Canada
9.2.2.1 Rising Energy Demand and Increasing Smart Meter Deployment to Drive the Growth of Market in Canada
9.3 Europe
9.3.1 United Kingdom
9.3.1.1 Rise in Energy Production to Drive the Adoption of ANM Software in the UK
9.3.2 Germany
9.3.2.1 Increasing Investments in Renewable Energy Plants to Drive the Growth of active network management Market in Germany
9.3.3 Rest of Europe
9.4 Asia Pacific
9.4.1 China
9.4.1.1 Growing Need for Efficient Energy Transportation to Drive the Growth of Market in China
9.4.2 India
9.4.2.1 Increasing Investments in Solar Power Generation to Drive the Growth of Market in India
9.4.3 Japan
9.4.3.1 Increasing Demand for Renewable Sources to Drive the Growth of Market in Japan
9.4.4 Rest of Asia Pacific
9.5 Middle East and Africa
9.5.1 Middle East
9.5.1.1 Need to Increase Energy Efficiency and Reduce Operating Costs Driving the Growth of Market in the Middle East
9.5.2 Africa
9.5.2.1 Presence of Growing Economies to Drive the Growth of Market in Africa
9.6 Latin America
9.6.1 Brazil
9.6.1.1 Increasing Investments in Distributed Power Generation to Drive the Growth of Market in Brazil
9.6.2 Mexico
9.6.2.1 Need to Monitor Electricity Usage in Power Grids Driving the Growth of active network management Market in Brazil
9.6.3 Rest of Latin America
10 Competitive Landscape (Page No. - 89)
10.1 Competitive Leadership Mapping
10.1.1 Visionary Leaders
10.1.2 Innovators
10.1.3 Dynamic Differentiators
10.1.4 Emerging Players
10.2 Strength of Product Portfolio
10.3 Business Strategy Excellence
10.4 Key Developments in the Active Network Management Market
10.4.1 Partnerships, Agreements, and Collaborations
10.4.2 New Product Launches/Product Enhancements
10.4.3 Mergers and Acquisitions
10.4.4 Business Expansions
11 Company Profiles (Page No. - 97)
(Business Overview, Products and Services Offered, Recent Developments, SWOT Analysis & MnM View)*
11.1 Introduction
11.2 ABB
11.3 Oracle
11.4 GE
11.5 Schneider Electric
11.6 Siemens
11.7 Cisco
11.8 IBM
11.9 Itron
11.10 Landis+GYR
11.11 Indra
11.12 Chemtrols Industries
11.13 Camlin
11.14 Smarter Grid Solutions
11.15 ZIV
11.16 Argand Solutions
*Details on Business Overview, Products and Services Offered, Recent Developments, SWOT Analysis & MnM View Might Not Be Captured in Case of Unlisted Companies.
12 Appendix (Page No. - 127)
12.1 Discussion Guide
12.2 Knowledge Store: Marketsandmarkets� Subscription Portal
12.3 Available Customizations
12.4 Related Reports
12.5 Author Details
List of Tables (80 Tables )
Table 1 United States Dollar Exchange Rate, 2015�2017
Table 2 Factors: Impact Analysis
Table 3 Active Network Management Market Size and Growth, 2016�2023 (USD Million, Y-O-Y %)
Table 4 Active Network Management Market Size, By Component, 2016�2023 (USD Million)
Table 5 Software: Market Size By Region, 2016�2023 (USD Million)
Table 6 Services: Market Size By Region, 2016�2023 (USD Million)
Table 7 Services: Market Size By Type, 2016�2023 (USD Million)
Table 8 Professional Services: Market Size By Region, 2016�2023 (USD Million)
Table 9 Consulting Services Market Size By Region, 2016�2023 (USD Million)
Table 10 System Integration Market Size By Region, 2016�2023 (USD Million)
Table 11 Support and Maintenance Market Size, By Region, 2016�2023 (USD Million)
Table 12 Managed Services: Market Size By Region, 2016�2023 (USD Million)
Table 13 Active Network Management Market Size, By Professional Service, 2016�2023 (USD Million)
Table 14 Market Size By Organization Size, 2016�2023 (USD Million)
Table 15 Small and Medium-Sized Enterprises: Market Size By Region, 2016�2023 (USD Million)
Table 16 Large Enterprises: Market Size By Region, 2016�2023 (USD Million)
Table 17 Active Network Management Market Size, By Application Area, 2016�2023 (USD Million)
Table 18 Power: Market Size By Type, 2016�2023 (USD Million)
Table 19 Power: Market Size By Region, 2016�2023 (USD Million)
Table 20 Power Generation: Market By Type, 2016�2023 (USD Million)
Table 21 Thermal Power Plants Market Size, By Region, 2016�2023 (USD Million)
Table 22 Nuclear Power Plants: Market Size By Region, 2016�2023 (USD Million)
Table 23 Renewable Power Plants: Market Size By Region, 2016�2023 (USD Million)
Table 24 Power Grids: Market Size By Region, 2016�2023 (USD Million)
Table 25 Energy and Utilities: Market Size By Region, 2016�2023 (USD Million)
Table 26 Energy and Utilities: Market Size By Type, 2016�2023 (USD Million)
Table 27 Oil and Gas: Market Size By Region, 2016�2023 (USD Million)
Table 28 Electric Power Transmission: Market Size By Region, 2016�2023 (USD Million)
Table 29 Water Treatment and Distribution: Market Size By Region, 2016�2023 (USD Million)
Table 30 Others: Market Size By Region, 2016�2023 (USD Million)
Table 31 Active Network Management Market Size, By Region, 2016�2023 (USD Million)
Table 32 North America: Market Size By Component, 2016�2023 (USD Million)
Table 33 North America: Market Size By Service, 2016�2023 (USD Million)
Table 34 North America: Market Size By Professional Service, 2016�2023 (USD Million)
Table 35 North America: Market Size By Organization Size, 2016�2023 (USD Million)
Table 36 North America: Market Size By Application Area, 2016�2023 (USD Million)
Table 37 North America: Market Size By Power, 2016�2023 (USD Million)
Table 38 North America: Market Size By Power Generation, 2016�2023 (USD Million)
Table 39 North America: Market Size By Energy and Utilities, 2016�2023 (USD Million)
Table 40 North America: Market Size By Country, 2016�2023 (USD Million)
Table 41 Europe: Active Network Management Market Size, By Component, 2016�2023 (USD Million)
Table 42 Europe: Market Size By Service, 2016�2023 (USD Million)
Table 43 Europe: Market Size By Professional Service, 2016�2023 (USD Million)
Table 44 Europe: Market Size By Organization Size, 2016�2023 (USD Million)
Table 45 Europe: Market Size By Application Area, 2016�2023 (USD Million)
Table 46 Europe: Market Size By Power, 2016�2023 (USD Million)
Table 47 Europe: Market Size By Power Generation, 2016�2023 (USD Million)
Table 48 Europe: Market Size By Energy and Utilities, 2016�2023 (USD Million)
Table 49 Europe: Market Size By Country, 2016�2023 (USD Million)
Table 50 Asia Pacific: Active Network Management Market Size, By Component, 2016�2023 (USD Million)
Table 51 Asia Pacific: Market Size By Service, 2016�2023 (USD Million)
Table 52 Asia Pacific: Market Size By Professional Service, 2016�2023 (USD Million)
Table 53 Asia Pacific: Market Size By Organization Size, 2016�2023 (USD Million)
Table 54 Asia Pacific: Market Size By Application Area, 2016�2023 (USD Million)
Table 55 Asia Pacific: Market Size By Power, 2016�2023 (USD Million)
Table 56 Asia Pacific: Market Size By Power Generation, 2016�2023 (USD Million)
Table 57 Asia Pacific: Market Size By Energy and Utilities, 2016�2023 (USD Million)
Table 58 Asia Pacific: Market Size By Country, 2016�2023 (USD Million)
Table 59 Middle East and Africa: Active Network Management Market Size, By Component, 2016�2023 (USD Million)
Table 60 Middle East and Africa: Market Size By Service, 2016�2023 (USD Million)
Table 61 Middle East and Africa: Market Size By Professional Service, 2016�2023 (USD Million)
Table 62 Middle East and Africa: Market Size By Organization Size, 2016�2023 (USD Million)
Table 63 Middle East and Africa: Market Size By Application Area, 2016�2023 (USD Million)
Table 64 Middle East and Africa: Market Size By Power, 2016�2023 (USD Million)
Table 65 Middle East and Africa: Market Size By Power Generation, 2016�2023 (USD Million)
Table 66 Middle East and Africa: Market Size By Energy and Utilities, 2016�2023 (USD Million)
Table 67 Middle East and Africa: Market Size By Sub Region, 2016�2023 (USD Million)
Table 68 Latin America: Active Network Management Market Size, By Component, 2016�2023 (USD Million)
Table 69 Latin America: Market Size By Service, 2016�2023 (USD Million)
Table 70 Latin America: Market Size By Professional Service, 2016�2023 (USD Million)
Table 71 Latin America: Market Size By Organization Size, 2016�2023 (USD Million)
Table 72 Latin America: Market Size By Application Area, 2016�2023 (USD Million)
Table 73 Latin America: Market Size By Power, 2016�2023 (USD Million)
Table 74 Latin America: Market Size By Power Generation, 2016�2023 (USD Million)
Table 75 Latin America: Market Size By Energy and Utilities, 2016�2023 (USD Million)
Table 76 Latin America: Market Size By Country, 2016�2023 (USD Million)
Table 77 Partnerships, Agreements, and Collaborations, 2016�2018
Table 78 New Product Launches/Product Enhancements, 2017�2019
Table 79 Mergers and Acquisitions, 2016�2018
Table 80 Business Expansions, 2017�2018
List of Figures (41 Figures)
Figure 1 Global Active Network Management Market: Research Design
Figure 2 Research Methodology
Figure 3 Market Size Estimation Methodology: Bottom-Up and Top-Down Approaches
Figure 4 Active Network Management Market to Witness Significant Growth in the Global Market During the Forecast Period
Figure 5 Services Segment to Grow at A Higher CAGR During the Forecast Period
Figure 6 North America to Hold the Highest Market Share in 2018
Figure 7 Highest-Growing Segments of the Market
Figure 8 Increasing Demand for Uninterruptible Transmission of Electricity Among End Users to Fuel the Growth of the Active Network Management Market
Figure 9 Software Segment to Hold A Higher Market Share During the Forecast Period
Figure 10 Professional Services Segment to Hold A Higher Market Share During the Forecast Period
Figure 11 Consulting Services Segment and North America to Hold the Highest Market Shares in 2018
Figure 12 Large Enterprises Segment to Hold A Higher Market Share in 2018
Figure 13 Power Segment to Hold A Higher Market Share in 2018
Figure 14 Asia Pacific to Emerge as the Best Market for Investment in the Next 5 Years
Figure 15 Drivers, Restraints, Opportunities, and Challenges: Active Network Management Market
Figure 16 Services Segment to Grow at A Higher CAGR During the Forecast Period
Figure 17 Managed Services Segment to Grow at A Higher CAGR During the Forecast Period
Figure 18 Support and Maintenance Segment to Grow at the Highest CAGR During the Forecast Period
Figure 19 Small and Medium-Sized Enterprises Segment to Grow at A Higher CAGR During the Forecast Period
Figure 20 Energy and Utilities Segment to Grow at the Highest CAGR During the Forecast Period
Figure 21 Asia Pacific to Grow at the Highest CAGR During the Forecast Period
Figure 22 North America: Market Snapshot
Figure 23 Asia Pacific: Market Snapshot
Figure 24 Active Network Management Market (Global) Competitive Leadership Mapping, 2018
Figure 25 Key Developments By the Leading Players in the Market, 2016�2018
Figure 26 Geographic Revenue Mix of the Top Players in the Market
Figure 27 ABB: Company Snapshot
Figure 28 SWOT Analysis: ABB
Figure 29 Oracle: Company Snapshot
Figure 30 SWOT Analysis: Oracle
Figure 31 GE: Company Snapshot
Figure 32 SWOT Analysis: GE
Figure 33 Schneider Electric: Company Snapshot
Figure 34 SWOT Analysis: Schneider Electric
Figure 35 Siemens: Company Snapshot
Figure 36 SWOT Analysis: Siemens
Figure 37 Cisco: Company Snapshot
Figure 38 IBM: Company Snapshot
Figure 39 Itron: Company Snapshot
Figure 40 Landis+GYR: Company Snapshot
Figure 41 Indra: Company Snapshot
The study involved 4 major activities to estimate the current market size for the Active Network Management (ANM). Exhaustive secondary research was done to collect information on market, peer market and parent market. The next step was to validate these findings, assumptions, and sizing with industry experts across value chain through primary research. Both top-down and bottom-up approaches were employed to estimate the complete market size. Thereafter market breakup and data triangulation were used to estimate the market size of segments and sub segments.
Secondary Research
This research study involved the use of extensive secondary sources, directories, and databases, such as D&B Hoovers, Bloomberg BusinessWeek, and Factiva, to identify and collect information useful for a technical, market-oriented, and commercial study of the global active network management market. The other secondary sources included annual reports, press releases and investor presentations of companies, white papers, certified publications, articles by recognized authors, manufacturer associations, trade directories, and databases.
Primary Research
The Active Network Management Market comprises several stakeholders, such as power management system manufacturers, smart grid technology providers, end users such as power generators and energy and utility companies, consulting firms, advisory firms, ANM solution vendors, electrical equipment associations, systems integrators, public and private organizations, technology providers, investors and venture capitalists, consulting firms, and technology consultants, The primary sources were mainly industry experts from the core and related verticals, and preferred suppliers, manufacturers, distributors, service providers, technology developers, and technologists from companies and organizations related to all the segments of the market�s value chain. In-depth interviews were conducted with various primary respondents, including key industry participants, subject matter experts, C-level executives of key market players, and industry consultants, to obtain and verify critical qualitative and quantitative information, as well as assess the market�s prospects. The market was estimated by analyzing various driving factors, rising need for smart grid optimization via automation for efficient transmission of electricity, growth of renewable energy commercialization among the utilities sector, and increasing demand for uninterruptible transmission of electricity among end users.
Various primary sources from both supply and demand sides of the market were interviewed to obtain qualitative and quantitative information. Following is the breakup of primary respondents� profiles
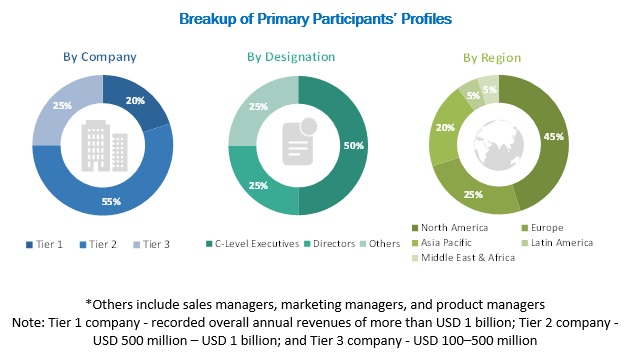
To know about the assumptions considered for the study, download the pdf brochure
Active Network Management Market Size Estimation
Both top-down and bottom-up approaches were used to estimate and validate the total size of the market. These methods were also used extensively to estimate the size of various subsegments in the market. The research methodology used to estimate the market size includes the following:
- The key players in the industry and markets have been identified through extensive secondary research.
- The industry�s supply chain and market size, in terms of value, have been determined through primary and secondary research processes.
- All percentage shares, splits, and breakups have been determined using secondary sources and verified through primary sources.
Data Triangulation
After arriving at the overall market size�using the market size estimation processes as explained above�the market was split into several segments and subsegments. In order to complete the overall market engineering process and arrive at the exact statistics of each market segment and subsegment, the data triangulation and market breakup procedures were employed, wherever applicable. Extensive qualitative and quantitative analysis was performed on the complete market engineering process to list the key information/insights throughout the report.
Report Objectives
- To define, describe, and forecast the Active Network Management Market by component (solution and services), organization size, application area, and region
- To provide detailed information about the major factors (drivers, restraints, opportunities, and challenges) influencing the growth of the market
- To analyze the micromarkets with respect to the individual growth trends, prospects, and contributions to the overall market
- To analyze market opportunities for stakeholders by identifying the high-growth segments of the market
- To forecast the market size of the segments with respect to regions, such as North America, Europe, APAC, MEA, and Latin America.
- To profile the key players in the market and comprehensively analyze their market size and core competencies
- To track and analyze competitive developments, such as new product launches; mergers and acquisitions; and partnerships, agreements, and collaborations in the global active network management market


Growth opportunities and latent adjacency in Active Network Management Market
Understanding the new innovations and future developments of Active Network Management Market