Aircraft Refurbishing Market by Type of Refurbishing Services (Interior and Exterior), Aircraft Type (VLA, WB, NB, and VIP), Refurbishing Type (Passenger-to-Freighter, Commercial Aircraft Cabin Refurbishing, VIP Cabin Refurbishing), and by Region - Forecast to 2025-2034
Market Overview

Source: MarketsandMarkets Analysis, Secondary Research, Primary Interviews
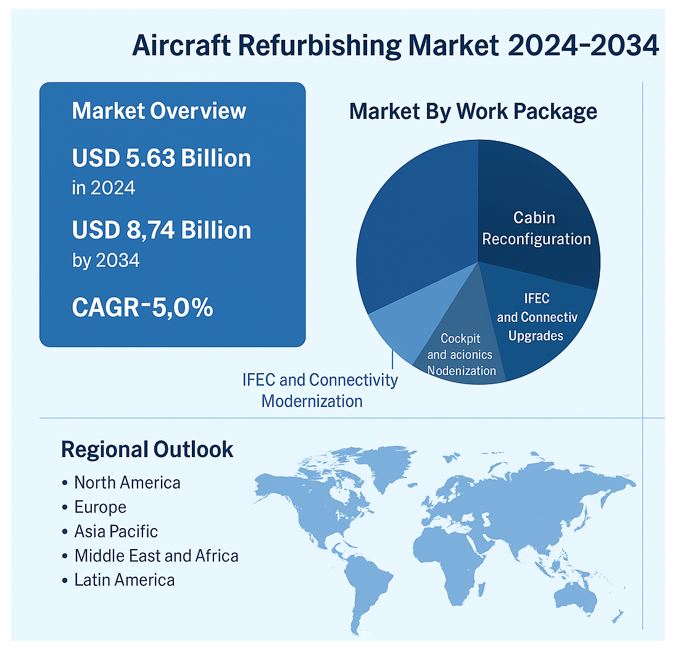
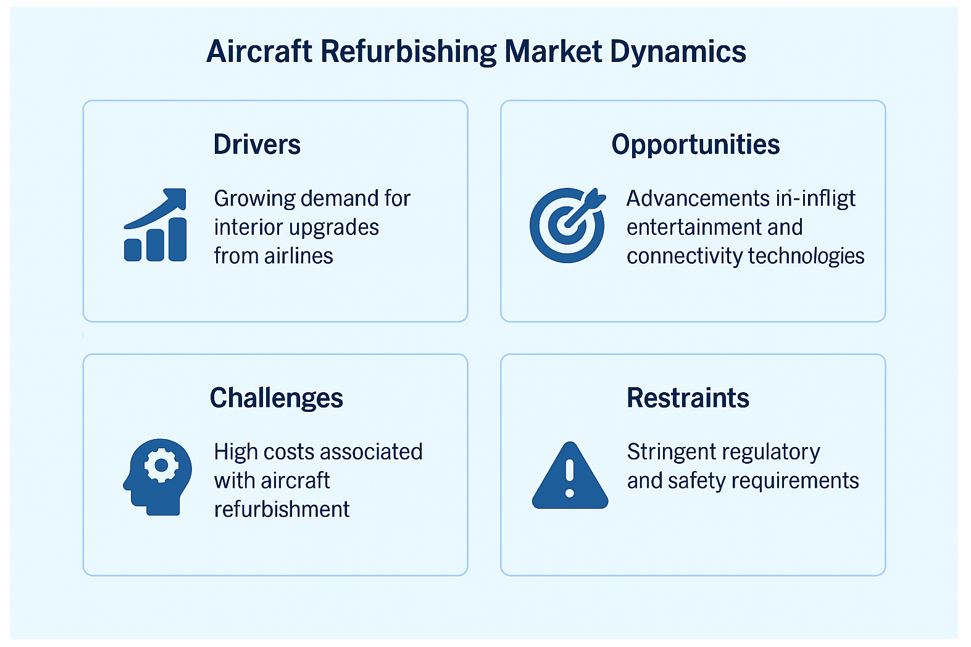
The global aircraft refurbishing market was valued at approximately USD 5.63 billion in 2025 and is projected to reach around USD 8.74 billion by 2034, reflecting a compound annual growth rate (CAGR) of 5.0%. Persistent OEM delivery backlogs underpin growth, airline cabin modernization programs, and a rise in passenger-to-freighter (P2F) conversions. Operators are accelerating interior reconfigurations—especially the integration of premium economy—while upgrading in-flight entertainment and connectivity (IFEC), lighting, and monuments to improve yield, brand consistency, and turnaround economics.
Market Dynamics

Source: MarketsandMarkets Analysis, Secondary Research, Primary Interviews
Completion centers and MROs are reducing downtime by utilizing 3D laser scanning, digital twin modeling, modular monuments, and additive-manufactured interior components. Business jet and VIP completions remain resilient, with demand for bespoke finishes, acoustic upgrades, and next-generation cabin management systems in North America, Europe, and the Middle East.
Market By Work Package
Cabin Reconfiguration
Seat re-densification, premium-economy integration, monument optimization, and galley/lavatory redesigns form the most significant share as carriers pursue higher revenue per available seat and faster refresh cycles.
IFEC & Connectivity Upgrades
Retrofit programs for satellite broadband, Wi-Fi, and Bluetooth streaming are expanding as airlines pursue higher NPS and ancillary revenue through digital services and e-commerce.
Cockpit & Avionics Modernization
NextGen/SESAR-aligned upgrades—FMS refresh, HUD additions, communications, and surveillance enhancements—ensure compliance and extend asset life.
Paint, Livery & Structural Modifications
Exterior paint, composite panel replacement, and aerodynamic refinements accompany corporate rebranding and alliance transitions.
Passenger-to-Freighter (P2F) Conversions
The fastest-growing work package is supported by e-commerce demand and conversion availability across the A321P2F, A330P2F, and 777-300ERSF platforms.
Market By Aircraft Class
Narrow-Body Aircraft
A320 family and 737 series drive the bulk of refurbishment due to fleet scale and shorter replacement cycles.
Wide-Body Aircraft
Long-haul comfort upgrades and IFEC modernization dominate; a large share of P2F programs falls into this category.
Regional & Turboprop Aircraft
Stable retrofit activity across ATR and Embraer fleets, particularly in growing regional markets.
Business Jets
VIP completions focus on bespoke interiors, acoustic insulation, and advanced cabin management systems.
Market By End User
Commercial Airlines
Mid-life cabin renewals and brand refreshes to sustain competitiveness and ancillary revenues.
Leasing Companies
Redelivery standards-driven refreshes to shorten the transition time between operators.
Private & VIP Operators: Custom interior completions and upgrades for heads-of-state and private owners.
Cargo Operators
Retrofit programs that balance conversion cost with payload and utilization economics.
Regional Outlook

Source: MarketsandMarkets Analysis, Secondary Research, Primary Interviews
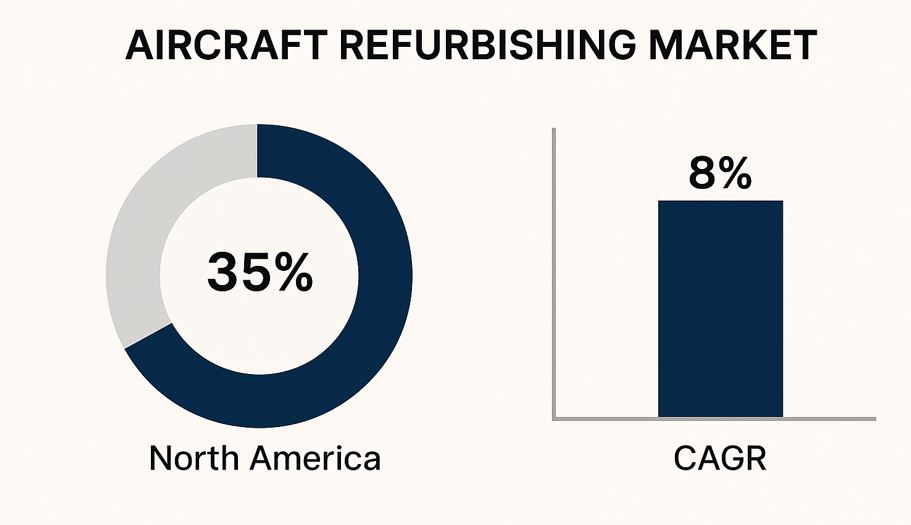
North America remains the largest regional market, supported by dense MRO capacity and high rates of fleet transition. Europe sustains robust demand through established completion centers and clear certification pathways under EASA Part 21J and CS-25. The Asia Pacific is accelerating as LCCs upgrade cabins and IFEC penetration increases in Japan, Singapore, and India. The Middle East continues to build a reputation for wide-body and VIP completions, while Latin America and Africa show gradual uptake aligned with fleet modernization.
Competitive Landscape

Source: MarketsandMarkets Analysis, Secondary Research, Primary Interviews
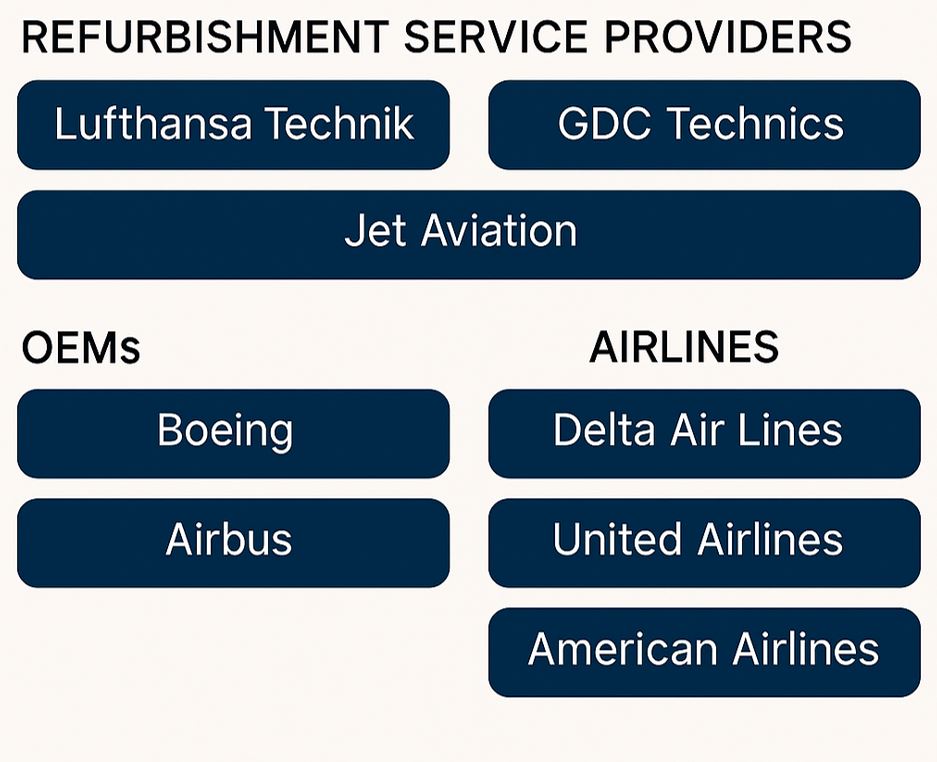
The ecosystem blends OEM-affiliated divisions, independent MROs, and specialized completion houses. Leading participants include Collins Aerospace (RTX), Lufthansa Technik, HAECO, Jamco Corporation, Diehl Aviation, Safran Cabin, AAR Corp, ST Engineering, FACC AG, GDC Technics, Jet Aviation, Comlux Aviation, F/List GmbH, IAI Bedek Aviation Group, and EFW GmbH. Strategic priorities center on digital design integration, modular monuments, additive manufacturing of interior components, and AI-assisted project planning that aligns material availability, certification sequencing, and slot capacity.
Regulatory & Certification
Refurbishment programs align with FAA/EASA Supplemental Type Certificate (STC) pathways, flammability and heat-release requirements under FAR/CS-25.853, smoke and toxicity standards, and human-factors guidance for cabin safety. Clear conformity planning and early engagement with approved design organizations (Part-21J) are critical to managing lead times and mitigating rework risk.
Sustainability & ESG
Sustainability objectives are embedded in sourcing and design. Airlines and MROs are adopting lightweight, recyclable materials, low-VOC coatings, LED lighting, and eco-certified fabrics to reduce mass and emissions. Circular practices—such as component reuse, certified recycling of removed interiors, and traceable bills of material—are expanding under the ICAO LTAG, IATA Net Zero 2050, and regional Airport Carbon Accreditation frameworks.
Technology Trends
3D laser scanning, digital twins, and VR-enabled design reviews are compressing engineering lead times and improving fit-first-time rates. Wireless cabin management, integrated IFEC platforms, and additive-manufactured parts reduce modification cycles and enhance lifecycle economics.

Source: MarketsandMarkets Analysis, Secondary Research, Primary Interviews
Why This Report
The MarketsandMarkets Aircraft Refurbishing Market Report (2025–2034) quantifies demand across cabin, cockpit, and cargo work packages; benchmarks vendor capabilities; and explains certification, sustainability, and digital transformation trends that will shape refurbishment economics.
FAQs (Featured Snippet Ready)
Q1. What is the market size of aircraft refurbishing?
A1. The market is estimated at USD 5.63 billion in 2025 and is projected to reach USD 8.74 billion by 2034 (CAGR 5.0%).
Q2. What drives growth in aircraft refurbishing?
A2. OEM delivery backlogs, premium-economy integration, IFEC retrofits, and rising P2F conversions are the primary drivers.
Q3. Which work package grows the fastest?
A3. Passenger-to-freighter conversions lead growth, followed by IFEC and cabin reconfiguration programs.
Q4. Who are the key vendors?
A4. Collins Aerospace, Lufthansa Technik, HAECO, Jamco, Diehl Aviation, Safran Cabin, AAR, ST Engineering, FACC, GDC Technics, Jet Aviation, Comlux, F/List, IAI Bedek, and EFW.
Q5. What certifications apply?
A5. FAA/EASA STC processes with FAR/CS-25.853 flammability, smoke, and toxicity requirements, plus associated conformity planning under Part-21J.
Q6. How is sustainability addressed?
A6.Lightweight/recyclable materials, low-VOC coatings, LED lighting, and circular reuse/recycling aligned to ICAO LTAG and IATA Net Zero 2050.

TABLE OF CONTENTS
1 INTRODUCTION
1.1 Key Take-Aways
1.2 Report Description
1.3 Markets Covered
1.4 Stakeholders
1.5 Research Methodology
1.5.1 Market Size
1.5.2 Key Data Points From Primary Sources
1.5.3 Key Data Points From Secondary Sources
1.6 Key Findings
2 EXECUTIVE SUMMARY
3 MARKET OVERVIEW
3.1 Market Definition
3.2 Market Segmentation
3.2.1 Market Segmented By Aircraft Type
3.2.2 Market Segmented By Type Of Refurbishment
3.2.3 Market Segmented By Geographies
4 MARKET DYNAMICS
4.1 Market Dynamics
4.2 Drivers
4.2.1 Greener Aircrafts Would Require Redesign And Certification Of The Interiors
4.2.2 VIPs Purchase Former Airline Aircraft To Use It For Their Business Purpose
4.2.3 Financial Crisis Force Airlines To Postpone
Major Expenditures Such As Jet Orders And Deliveries
4.2.4 Middle East Carriers Receive Support From Their State Governments
4.2.5 The High Demand For Large Business And VIP Aircraft
4.2.6 New Airplanes (A-380 And B-787) & Technologies
4.2.7 Impact Analysis Of The Drivers
4.3 Restraints
4.3.1 Passing Flammability And Certification Tests
4.3.2 Major Changes In The Cabin Reconfiguration
Will Involve Passing The Recertification Requirements
4.3.3 No Pre-Delivery Payments Or Very Significant Down Payments On New Aircrafts
4.3.4 Impact Analysis Of The Restraints
4.4 Challenges
4.4.1 Lower Cash Outlays To Preserve Working Capital
4.4.2 Fleet Flexibility To Introduce New Routes Or Aircraft Types
4.4.3 Flexibility To Increase Or Reduce Capacity Quickly
5 TYPES OF REFURBISHMENT SERVICES
5.1 Interior Refurbishment
5.2 Exterior Refurbishment
6 FORECAST ANALYSIS REFURBISHING
6.1 By Aircraft Type
6.1.1 Vla Refurbishing Market
6.1.2 WB Refurbishing Market
6.1.3 NB Refurbishing Market
6.1.4 VIP Refurbishing Market
6.2 By Refurbishing Type
6.2.1 Passenger-To-Freighter
6.2.2 Commercial Aircraft Cabin Refurbishing
6.2.3 VIP Cabin Refurbishing
6.3 By Geographies
6.3.1 Global
6.3.2 APAC
6.3.3 North America
6.3.4 Latin America
6.3.5 Middle East
6.3.6 European Union
6.3.7 Africa
6.3.8 Rest Of The World
7 COMPETITIVE LANDSCAPE
7.1 Mergers & Acquisitions
7.2 Collaborations/Partnerships/Agreements/ Joint Ventures
7.3 Concentration Of Aircraft Refurbishing Companies
7.4 Market Shares Of Aircraft Refurbishing Companies
8 COMPANY PROFILE (Overview, Products & Services, and New Developments)*
8.1 B/E Aerospace
8.2 Zodiac Aerospace, Inc
8.3 Timco Aviation Services
8.4 Sia Engineering Company
8.5 Lufthansa Technik
8.6 Gulfstream
8.7 Sabreliner Corporation
8.8 Rose Aircraft Services
*Details on overview, products & services, and new developments might not be captured in case of unlisted companies.
LIST OF TABLES
Table 1 Revenue Forecast For VLA (Global), 2012-2017 ($Million)
Table 2 Revenue Forecast For VLA 2012 (Global), 2012-2017 ($Million)
Table 3 Revenue Forecast For VLA 2013 (Global), 2012-2017 ($Million)
Table 4 Revenue Forecast For VLA 2014 (Global), 2012-2017 ($Million)
Table 5 Revenue Forecast For VLA 2015 (Global), 2012-2017 ($Million)
Table 6 Revenue Forecast For VLA 2016 (Global), 2012-2017 ($Million)
Table 7 Revenue Forecast For VLA 2017 (Global), 2012-2017 ($Million)
Table 8 Revenue Forecast For WB (Global), 2012-2017 ($Million)
Table 9 Revenue Forecast For WB 2012 (Global), 2012-2017 ($Million)
Table 10 Revenue Forecast For WB 2013 (Global), 2012-2017 ($Million)
Table 11 Revenue Forecast For WB 2014 (Global), 2012-2017 ($Million)
Table 12 Revenue Forecast For WB 2015 (Global), 2012-2017 ($Million)
Table 13 Revenue Forecast For WB 2016 (Global), 2012-2017 ($Million)
Table 14 Revenue Forecast For WB 2017 (Global), 2012-2017 ($Million)
Table 15 Revenue Forecast For NB (Global), 2012-2017 ($Million)
Table 16 Revenue Forecast For NB 2012 (Global), 2012-2017 ($Million)
Table 17 Revenue Forecast For NB 2013 (Global), 2012-2017 ($Million)
Table 18 Revenue Forecast For NB 2014 (Global), 2012-2017 ($Million)
Table 19 Revenue Forecast For NB 2015 (Global), 2012-2017 ($Million)
Table 20 Revenue Forecast For NB 2016 (Global), 2012-2017 ($Million)
Table 21 Revenue Forecast For NB 2017 (Global), 2012-2017 ($Million)
Table 22 Revenue Forecast For VIP (Global), 2012-2017 ($Million)
Table 23 Revenue Forecast For P2f (Global), 2012-2017 ($Million)
Table 24 Revenue Forecast For P2f 2012 (Global), 2012-2017 ($Million)
Table 25 Revenue Forecast For P2f 2013 (Global), 2012-2017 ($Million)
Table 26 Revenue Forecast For P2f 2014 (Global), 2012-2017 ($Million)
Table 27 Revenue Forecast For P2f 2015 (Global), 2012-2017 ($Million)
Table 28 Revenue Forecast For P2f 2016 (Global), 2012-2017 ($Million)
Table 29 Revenue Forecast For P2f 2017 (Global), 2012-2017 ($Million)
Table 30 Revenue Forecast For CCR (Global), 2012-2017 ($Million)
Table 31 Revenue Forecast For CCR 2012 (Global), 2012-2017 ($Million)
Table 32 Revenue Forecast For CCR 2013 (Global), 2012-2017 ($Million)
Table 33 Revenue Forecast For CCR 2014 (Global), 2012-2017 ($Million)
Table 34 Revenue Forecast For CCR 2015 (Global), 2012-2017 ($Million)
Table 35 Revenue Forecast For CCR 2016 (Global), 2012-2017 ($Million)
Table 36 Revenue Forecast For CCR 2017 (Global), 2012-2017 ($Million)
Table 37 Revenue Forecast VIP Cabin Refurbishing (Global), 2012-2017 ($Million)
Table 38 Revenue Forecast For VIP Cabin Refurbishing 2012 (Global), 2012-2017 ($Million)
Table 39 Revenue Forecast For VIP Cabin Refurbishing 2013 (Global), 2012-2017 ($Million)
Table 40 Revenue Forecast For VIP Cabin Refurbishing 2014 (Global), 2012-2017 ($Million)
Table 41 Revenue Forecast For VIP Cabin Refurbishing 2015 (Global), 2012-2017 ($Million)
Table 42 Revenue Forecast For VIP Cabin Refurbishing 2016 (Global), 2012-2017 ($Million)
Table 43 Revenue Forecast For VIP Cabin Refurbishing 2017 (Global), 2012-2017 ($Million)
Table 44 Revenue Forecast (Global), 2012-2017 ($Million)
Table 45 Revenue Forecast 2012 (Global), 2012-2017 ($Million)
Table 46 Revenue Forecast 2013 (Global), 2012-2017 ($Million)
Table 47 Revenue Forecast 2014 (Global), 2012-2017 ($Million)
Table 48 Revenue Forecast 2015 (Global), 2012-2017 ($Million)
Table 49 Revenue Forecast 2016 (Global), 2012-2017 ($Million)
Table 50 Revenue Forecast 2017 (Global), 2012-2017 ($Million)
Table 51 Revenue Forecast APAC (Global), 2012-2017 ($Million)
Table 52 Revenue Forecast APAC 2012 (Global), 2012-2017 ($Million)
Table 53 Revenue Forecast APAC 2013 (Global), 2012-2017 ($Million)
Table 54 Revenue Forecast APAC 2014 (Global), 2012-2017 ($Million)
Table 55 Revenue Forecast APAC 2015 (Global), 2012-2017 ($Million)
Table 56 Revenue Forecast APAC 2016 (Global), 2012-2017 ($Million)
Table 57 Revenue Forecast APAC 2017 (Global), 2012-2017 ($Million)
Table 58 Revenue Forecast Na (Global), 2012-2017 ($Million)
Table 59 Revenue Forecast NA 2012 (Global), 2012-2017 ($Million)
Table 60 Revenue Forecast NA 2013 (Global), 2012-2017 ($Million)
Table 61 Revenue Forecast NA 2014 (Global), 2012-2017 ($Million)
Table 62 Revenue Forecast NA 2015 (Global), 2012-2017 ($Million)
Table 63 Revenue Forecast NA 2016 (Global), 2012-2017 ($Million)
Table 64 Revenue Forecast NA 2017 (Global), 2012-2017 ($Million)
Table 65 Revenue Forecast La (Global), 2012-2017 ($Million)
Table 66 Revenue Forecast LA 2012 (Global), 2012-2017 ($Million)
Table 67 Revenue Forecast LA 2013 (Global), 2012-2017 ($Million)
Table 68 Revenue Forecast LA 2014 (Global), 2012-2017 ($Million)
Table 69 Revenue Forecast LA 2015 (Global), 2012-2017 ($Million)
Table 70 Revenue Forecast LA 2016 (Global), 2012-2017 ($Million)
Table 71 Revenue Forecast LA 2017 (Global), 2012-2017 ($Million)
Table 72 Revenue Forecast Me (Global), 2012-2017 ($Million)
Table 73 Revenue Forecast ME 2012 (Global), 2012-2017 ($Million)
Table 74 Revenue Forecast ME 2013 (Global), 2012-2017 ($Million)
Table 75 Revenue Forecast ME 2014 (Global), 2012-2017 ($Million)
Table 76 Revenue Forecast ME 2015 (Global), 2012-2017 ($Million)
Table 77 Revenue Forecast ME 2016 (Global), 2012-2017 ($Million)
Table 78 Revenue Forecast ME 2017 (Global), 2012-2017 ($Million)
Table 79 Revenue Forecast Eu (Global), 2012-2017 ($Million)
Table 80 Revenue Forecast EU 2012 (Global), 2012-2017 ($Million)
Table 81 Revenue Forecast EU 2013 (Global), 2012-2017 ($Million)
Table 82 Revenue Forecast EU 2014 (Global), 2012-2017 ($Million)
Table 83 Revenue Forecast EU 2015 (Global), 2012-2017 ($Million)
Table 84 Revenue Forecast EU 2016 (Global), 2012-2017 ($Million)
Table 85 Revenue Forecast EU 2017 (Global), 2012-2017 ($Million)
Table 86 Revenue Forecast Africa (Global), 2012-2017 ($Million)
Table 87 Revenue Forecast Africa 2012 (Global), 2012-2017 ($Million)
Table 88 Revenue Forecast Africa 2013 (Global), 2012-2017 ($Million)
Table 89 Revenue Forecast Africa 2014 (Global), 2012-2017 ($Million)
Table 90 Revenue Forecast Africa 2015 (Global), 2012-2017 ($Million)
Table 91 Revenue Forecast Africa 2016 (Global), 2012-2017 ($Million)
Table 92 Revenue Forecast Africa 2017 (Global), 2012-2017 ($Million)
Table 93 Revenue Forecast RoW (Global), 2012-2017 ($Million)
Table 94 Revenue Forecast RoW 2012 (Global), 2012-2017 ($Million)
Table 95 Revenue Forecast RoW 2013 (Global), 2012-2017 ($Million)
Table 96 Revenue Forecast RoW 2014 (Global), 2012-2017 ($Million)
Table 97 Revenue Forecast RoW 2015 (Global), 2012-2017 ($Million)
Table 98 Revenue Forecast RoW 2016 (Global), 2012-2017 ($Million)
Table 99 Revenue Forecast RoW 2017 (Global), 2012-2017 ($Million)
Table 100 RoW: Commercial Aviation Refurbishing Market: Revenue Forecast, 2017 ($ Million)
Table 101 Concentration Of Aircraft Refurbishing Companies (Global), 2012
LIST OF FIGURES
Figure 1 Revenue Forecast For VLA (Global), 2012-2017 (%)
Figure 2 Revenue Forecast For VLA 2012 (Global), 2012-2017 (%)
Figure 3 Revenue Forecast For VLA 2013 (Global), 2012-2017 (%)
Figure 4 Revenue Forecast For VLA 2014 (Global), 2012-2017 (%)
Figure 5 Revenue Forecast For VLA 2015 (Global), 2012-2017 (%)
Figure 6 Revenue Forecast For VLA 2016 (Global), 2012-2017 (%)
Figure 7 Revenue Forecast For VLA 2017 (Global), 2012-2017 (%)
Figure 8 Revenue Forecast For WB (Global), 2012-2017 (%)
Figure 9 Revenue Forecast For WB 2012 (Global), 2012-2017 (%)
Figure 10 Revenue Forecast For WB 2013 (Global), 2012-2017 (%)
Figure 11 Revenue Forecast For WB 2014 (Global), 2012-2017 (%)
Figure 12 Revenue Forecast For WB 2015 (Global), 2012-2017 (%)
Figure 13 Revenue Forecast For WB 2016 (Global), 2012-2017 (%)
Figure 14 Revenue Forecast For WB 2017 (Global), 2012-2017 (%)
Figure 15 Revenue Forecast For NB (Global), 2012-2017 (%)
Figure 16 Revenue Forecast For NB 2012 (Global), 2012-2017 (%)
Figure 17 Revenue Forecast For NB 2013 (Global), 2012-2017 (%)
Figure 18 Revenue Forecast For NB 2014 (Global), 2012-2017 (%)
Figure 19 Revenue Forecast For NB 2015 (Global), 2012-2017 (%)
Figure 20 Revenue Forecast For NB 2016 (Global), 2012-2017 (%)
Figure 21 Revenue Forecast For NB 2017 (Global), 2012-2017 (%)
Figure 22 Revenue Forecast For VIP (Global), 2012-2017 (%)
Figure 23 Revenue Forecast For P2f (Global), 2012-2017 (%)
Figure 24 Revenue Forecast For P2f 2012 (Global), 2012-2017 (%)
Figure 25 Revenue Forecast For P2f 2013 (Global), 2012-2017 (%)
Figure 26 Revenue Forecast For P2f 2014 (Global), 2012-2017 (%)
Figure 27 Revenue Forecast For P2f 2015 (Global), 2012-2017 (%)
Figure 28 Revenue Forecast For P2f 2016 (Global), 2012-2017 (%)
Figure 29 Revenue Forecast For P2f 2017 (Global), 2012-2017 (%)
Figure 30 Revenue Forecast For CCR (Global), 2012-2017 (%)
Figure 31 Revenue Forecast For CCR 2012 (Global), 2012-2017 (%)
Figure 32 Revenue Forecast For CCR 2013 (Global), 2012-2017 (%)
Figure 33 Revenue Forecast For CCR 2014 (Global), 2012-2017 (%)
Figure 34 Revenue Forecast For CCR 2015 (Global), 2012-2017 (%)
Figure 35 Revenue Forecast For CCR 2016 (Global), 2012-2017 (%)
Figure 36 Revenue Forecast For CCR 2017 (Global), 2012-2017 (%)
Figure 37 Revenue Forecast VIP Cabin Refurbishing (Global), 2012-2017 (%)
Figure 38 Revenue Forecast For VIP Cabin Refurbishing 2012 (Global), 2012-2017 (%)
Figure 39 Revenue Forecast For VIP Cabin Refurbishing 2013 (Global), 2012-2017 (%)
Figure 40 Revenue Forecast For VIP Cabin Refurbishing 2014 (Global), 2012-2017 (%)
Figure 41 Revenue Forecast For VIP Cabin Refurbishing 2015 (Global), 2012-2017 (%)
Figure 42 Revenue Forecast For VIP Cabin Refurbishing 2016 (Global), 2012-2017 (%)
Figure 43 Revenue Forecast For VIP Cabin Refurbishing 2017 (Global), 2012-2017 (%)
Figure 44 Revenue Forecast Aircraft Refurbishing Market (Global), 2012-2017 (%)
Figure 45 Revenue Forecast 2012 Aircraft Refurbishing Market (Global), 2012-2017 (%)
Figure 46 Revenue Forecast 2013 Aircraft Refurbishing Market (Global), 2012-2017 (%)
Figure 47 Revenue Forecast 2014 Aircraft Refurbishing Market (Global), 2012-2017 (%)
Figure 48 Revenue Forecast 2015 Aircraft Refurbishing Market (Global), 2012-2017 (%)
Figure 49 Revenue Forecast 2016 Aircraft Refurbishing Market (Global), 2012-2017 (%)
Figure 50 Revenue Forecast 2017 Aircraft Refurbishing Market (Global), 2012-2017 (%)
Figure 51 Revenue Forecast APAC Aircraft Refurbishing Market (Global), 2012-2017 (%)
Figure 52 Revenue Forecast APAC 2012 (Global), 2012-2017 (%)
Figure 53 Revenue Forecast APAC 2013 (Global), 2012-2017 (%)
Figure 54 Revenue Forecast APAC 2014 (Global), 2012-2017 (%)
Figure 55 Revenue Forecast APAC 2015 (Global), 2012-2017 (%)
Figure 56 Revenue Forecast APAC 2016 (Global), 2012-2017 (%)
Figure 57 Revenue Forecast APAC 2017 (Global), 2012-2017 (%)
Figure 58 Revenue Forecast Na Aircraft Refurbishing Market (Global), 2012-2017 (%)
Figure 59 Revenue Forecast NA 2012 (Global), 2012-2017 (%)
Figure 60 Revenue Forecast NA 2013 (Global), 2012-2017 (%)
Figure 61 Revenue Forecast NA 2014 (Global), 2012-2017 (%)
Figure 62 Revenue Forecast NA 2015 (Global), 2012-2017 (%)
Figure 63 Revenue Forecast NA 2016 (Global), 2012-2017 (%)
Figure 64 Revenue Forecast NA 2017 (Global), 2012-2017 (%)
Figure 65 Revenue Forecast LA Aircraft Refurbishing Market (Global), 2012-2017 (%)
Figure 66 Revenue Forecast LA 2012 (Global), 2012-2017 (%)
Figure 67 Revenue Forecast LA 2013 (Global), 2012-2017 (%)
Figure 68 Revenue Forecast LA 2014 (Global), 2012-2017 (%)
Figure 69 Revenue Forecast LA 2015 (Global), 2012-2017 (%)
Figure 70 Revenue Forecast LA 2016 (Global), 2012-2017 (%)
Figure 71 Revenue Forecast LA 2017 (Global), 2012-2017 (%)
Figure 72 Revenue Forecast ME Aircraft Refurbishing Market (Global), 2012-2017 (%)
Figure 73 Revenue Forecast ME 2012 (Global), 2012-2017 (%)
Figure 74 Revenue Forecast ME 2013 (Global), 2012-2017 (%)
Figure 75 Revenue Forecast ME 2014 (Global), 2012-2017 (%)
Figure 76 Revenue Forecast ME 2015 (Global), 2012-2017 (%)
Figure 77 Revenue Forecast ME 2016 (Global), 2012-2017 (%)
Figure 78 Revenue Forecast ME 2017 (Global), 2012-2017 (%)
Figure 79 Revenue Forecast EU Aircraft Refurbishing Market (Global), 2012-2017 (%)
Figure 80 Revenue Forecast EU 2012 (Global), 2012-2017 (%)
Figure 81 Revenue Forecast EU 2013 (Global), 2012-2017 (%)
Figure 82 Revenue Forecast EU 2014 (Global), 2012-2017 (%)
Figure 83 Revenue Forecast EU 2015 (Global), 2012-2017 (%)
Figure 84 Revenue Forecast EU 2016 (Global), 2012-2017 (%)
Figure 85 Revenue Forecast EU 2017 (Global), 2012-2017 (%)
Figure 86 Revenue Forecast Africa Aircraft Refurbishing Market (Global), 2012-2017 (%)
Figure 87 Revenue Forecast Africa 2012 (Global), 2012-2017 (%)
Figure 88 Revenue Forecast Africa 2013 (Global), 2012-2017 (%)
Figure 89 Revenue Forecast Africa 2014 (Global), 2012-2017 (%)
Figure 90 Revenue Forecast Africa 2015 (Global), 2012-2017 (%)
Figure 91 Revenue Forecast Africa 2016 (Global), 2012-2017 (%)
Figure 92 Revenue Forecast Africa 2017 (Global), 2012-2017 (%)
Figure 93 Revenue Forecast RoW Aircraft Refurbishing Market (Global), 2012-2017 (%)
Figure 94 Revenue Forecast RoW 2012 (Global), 2012-2017 (%)
Figure 95 Revenue Forecast RoW 2013 (Global), 2012-2017 (%)
Figure 96 Revenue Forecast RoW 2014 (Global), 2012-2017 (%)
Figure 97 Revenue Forecast RoW 2015 (Global), 2012-2017 (%)
Figure 98 Revenue Forecast RoW 2016 (Global), 2012-2017 (%)
Figure 99 Revenue Forecast RoW 2017 (Global), 2012-2017 (%)
Figure 100 RoW: Commercial Aviation Refurbishing Market: Revenue Forecast, 2017 ($ Million)
Figure 101 Market Shares Of Aircraft Refurbishing Companies (Global), 2011(%)


Growth opportunities and latent adjacency in Aircraft Refurbishing Market