Angiography Equipment Market by Product (Angiography Systems, Catheters, Guidewire, Balloons, Contrast Media), Technology (X-Ray, CT, MRA), Procedure (Coronary, Endo, Neuro), Application (Diagnostic, Therapeutic), Patient Care Setting - Global Forecast to 2023


The global angiography equipment market is projected to reach USD 13.06 Billion by 2023., at a CAGR of 5.0% during the forecast period. The growth in this market is attributed to the high prevalence of diseases such as cancer and CVDs, increasing product approvals for advanced angiography techniques in the market, the large number of ongoing research activities, growing government and public-private investments, increasing number of awareness programs, and rising adoption of angiography devices due to a large number of angiography procedures performed across the globe.
Years considered for this report
- 2017 – Base Year
- 2018 – Estimated Year
- 2023 – Projected Year
Angiography Equipment Market Dynamics
Drivers
Growing demand for interventional angiography systems in minimally invasive surgeries
Minimally invasive surgeries are more cost-effective and rapid as compared to conventional surgery. These surgical procedures increase the patient’s safety, decrease scarring, ensure faster recovery, and decrease the length of hospital stay. A news article published on March 25, 2015, in JAMA (Journal of the American Medical Association) stated that research conducted by investigators at Johns Hopkins Medicine, a division of Johns Hopkins University (US), showed that American hospitals could collectively save between USD 280 million and USD 340 million a year by performing MIS procedures instead of traditional surgeries.
Angiography is preferred in minimally invasive procedures as angiograms generated at the diagnosis phase present a detailed, clear, and accurate picture of the blood vessels in a patient’s heart, eliminating the need for cost-intensive invasive surgeries. Owing to this, medical professionals are increasingly adopting minimally invasive surgical procedures over conventional open procedures due to the clinical advantages and cost benefits offered by the former. This, in turn, is positively impacting the growth of the angiography devices market.
Restraints
Risk of radiation exposure
The risk of radiation exposure and damage to the skin, eyes, and DNA, as well as the possibility of cancer, forms a key factor restraining the growth of this market.
As reported by the Robert Sauvé Research Institute in Occupational Health and Safety (Institut de Recherche Robert-Sauvé en santé et en sécurité du travail) (IRSST) (Canada), in 2017, 3–10% of all new cancer cases are related to workplace exposure, accounting for nearly 1,500 to 4,900 new cases of occupational cancer in Québec, Canada. Estimates from the National Council on Radiation Protection and Measurements in the US showed that radiation exposure from medical sources had grown from 15% in the early 1980s to 50% in 2016 in the US.
CT imaging is the biggest contributor to medical radiation exposure in the US. According to the National Cancer Institute, in 2016, CT scans accounted for around 24% of diagnostic radiological procedures in large US hospitals. According to a study published in April 2016 in the journal ‘Circulation: Cardiovascular Interventions,’ doctors and staff working in cardiac catheterization laboratories have a threefold risk of cancer and sevenfold risk of orthopedic problems. As per the study, the annual exposure to radiation for an interventional cardiologist and electrophysiologist working in catheterization laboratories is nearly 5 mSv. In a 30-year career, this figure adds up to significant exposure of 50 mSv to 200 mSv—or the equivalent of 2,500 to 10,000 chest X-rays.
Objectives of the Study
- To define, describe, and forecast the global market by product, application, procedure, end user, and region
- To provide detailed information about the factors influencing market growth (drivers, restraints, opportunities, challenges, and trends)
- To analyze micromarkets with respect to individual growth trends, prospects, and contributions to the overall market
- To analyze market opportunities for stakeholders and provide details of the competitive landscape for market players
- To forecast the size of the angiography equipment market, in four main regions, namely, North America, Europe, Asia Pacific, Latin America, and the Middle East & Africa
- To profile key players in the global market and comprehensively analyze their core competencies and market shares
- To track and analyze competitive developments such as expansions, partnerships, and alliances; mergers and acquisitions; product/technology developments; and research and development activities of the leading players in the angiography equipment market
Research Methodology
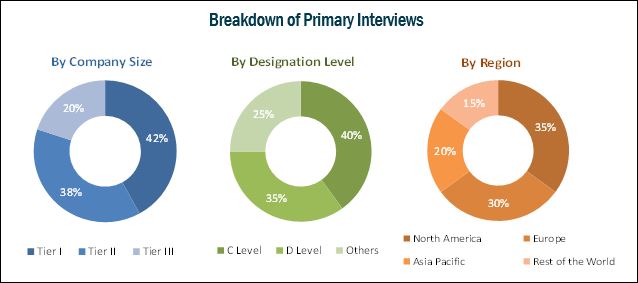
Top-down and bottom-up approaches were used to validate the size of the global market and estimate the size of various other dependent submarkets. Major players in the market were identified through secondary sources; directories; databases such as Bloomberg Businessweek, Factiva, and Avention; journals; and publications from associations such as American Health Information Management Association and Ohio Health Information Management Association; and their market revenues were determined through primary and secondary research. Primary research included extensive interviews with the key opinion leaders such as CEOs, directors, and marketing executives. The percentage splits, shares, and breakdowns of the product markets were determined using secondary sources and verified through primary sources. All possible parameters that affect the angiography equipment market covered in this research study have been accounted for, viewed in extensive detail, verified through primary research, and analyzed to get the final quantitative and qualitative data. This data is consolidated and added with detailed inputs and analysis from MarketsandMarkets and presented in this report.
To know about the assumptions considered for the study, download the pdf brochure
The global angiography equipment industry is fragmented and highly competitive, it consists of several large to medium-sized companies that compete with each other for increasing their foothold in different segments of the market. The top five players operating in this market include GE Healthcare (US), Koninklijke Philips N.V. (Netherlands), Siemens Healthineers (Germany), Canon Corporation (Japan), Boston Scientific Corporation (US), and Cordis (a Cardinal Health Company, US). Other players in this market include Shimadzu Corporation (Japan), Medtronic (Ireland), Angiodynamics (US), B. Braun Melsungen (Germany), and Abbott Laboratories (US). The market has number of large and medium players operating at both global and regional levels as well. The leading players are continuously developing advanced systems and devices to maintain their shares in the market.
Target Audience
- Medical Device Manufacturers
- Original Equipment Manufacturers
- Medical Device Distributors
- Hospitals and Clinics
- Diagnostic & Imaging Centers
- Research Institutes
- Government Bodies
Scope of the Report
Global Angiography Equipment Market
This research report categorizes the market into the following segments and subsegments:
-
Angiography Equipment, By Product
-
Angiography Equipment Solutions
- Angiography Systems
- Angiography Catheters
- Angiography Contrast Media
- Vascular Closure Devices (VCDs)
- Angiography Balloons
- Angiography Guidewires
- Angiography Accessories
-
Angiography Equipment Solutions
-
Angiography Equipment Market, By Technology
-
X-Ray Angiography
- Image Intensifiers
- Flat-panel Detectors
- CT Angiography
- MR Angiography
- Other Angiography Technologies
-
X-Ray Angiography
-
Angiography Equipment Market, By Procedure
- Coronary Angiography
- Endovascular Angiography
- Neuroangiography
- Onco-angiography
- Other Angiography Procedures
-
Global Coronary Angiography Market, By Indication
- Coronary Artery Disease
- Valvular Heart Disease
- Congenital Heart Disease
- Congestive Heart Failure
- Other Indications
-
Angiography Equipment Market, By Application
- Diagnostics
- Therapeutics
-
Angiography Equipment Market, By End User
- Hospitals and Clinics
- Diagnostic and Imaging Centers
- Research Institutes
-
Angiography Equipment Market, By Region
-
North America
- US
- Canada
-
Europe
- Germany
- UK
- France
- Italy
- Spain
- Rest of Europe
-
Asia Pacific
- Japan
- China
- India
- RoAPAC
- Latin America
- Middle East & Africa
-
North America
Available Customizations
With the given market data, MarketsandMarkets offers customizations as per the company’s specific needs. The following customization options are available for the report:
-
Geographic Analysis
- Further breakdown of the Rest of Europe angiography equipment market into the Netherlands, Sweden, Switzerland, Russia, and others
- Further breakdown of the Rest of Asia Pacific market into India and Australia
-
Company Information
- Detailed analysis and profiling of additional market players (Up to 5)
Exclusive Insights on Medical Devices Market Research Reports & Consulting
The angiography equipment market is projected to reach USD 13.06 Billion by 2023 from USD 10.26 Billion in 2018, at a CAGR of 5.0%. The growth in this market is attributed to the high prevalence of diseases such as cancer and CVDs, increasing product approvals for advanced angiography techniques in the market, the large number of ongoing research activities, growing government and public-private investments, increasing number of awareness programs, and rising adoption of angiography devices due to a large number of angiography procedures performed across the globe.
The market in this report is segmented by product, procedure, application, and end user. This report also provides market information on major regional segments of the market, namely, North America, Europe, Asia Pacific, Latin America, and the Middle East & Africa.
Based on product, angiography systems dominated the market in 2017. The large share can be attributed to factors such as technological advancements in angiography devices, increasing number of patients with cardiovascular diseases and other chronic disorders, and growing number of angiography procedures across the globe.
By procedure, the coronary angiography segment accounted for the largest share of the angiography equipment market in 2017. This dominant share is mainly attributed to the increase in the prevalence of coronary heart diseases due to the growing aging population. Moreover, increased awareness about the benefits of timely detection and treatment of coronary diseases and technological advancements are also expected to drive the growth of this market in the next five years.
On the basis of end users, the global market is segmented into hospitals & clinics, diagnostic and imaging centers, and research institutes. In 2017, the hospitals & clinics segment accounted for the largest share of the global market. The growth in this segment is attributed to the large number of patient pool diagnosed and treated at hospitals, the high purchasing capacity of hospitals for advanced technologies, rising number of diagnostic and therapeutic angiographic procedures, and growing awareness on timely disease diagnosis.
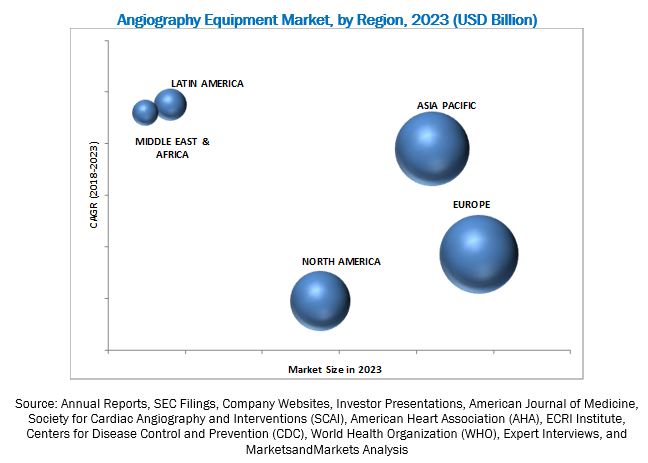
In 2017, Europe dominated the global market. The large share of the European market can be attributed to factors such as the high prevalence of diseases such as cancer and CVD, the faster and easier product approval process in the region, the large number of ongoing research activities, growing government and public-private investments, increasing number of awareness programs, and rising adoption of angiography devices due to a large number of angiography procedures performed in European countries.
However, factors such as lack of reimbursement for angiography procedures and risk of radiation exposure are expected to hinder the growth of the market to a certain extent.
Although there are numerous players offering angiography devices, some of the prominent players in this market are GE Healthcare (US), Koninklijke Philips N.V. (Netherlands), Siemens Healthineers (Germany), Canon Corporation (Japan), Shimadzu Corporation (Japan), Boston Scientific Corporation (US), Cordis Corporation (US), Medtronic, Inc. (US), AngioDynamics (US), B. Braun Melsungen (Germany), and Abbott Laboratories (US).
Frequently Asked Questions (FAQ):
How big is the Angiography Equipment Market?
Angiography Equipment Market worth $13.06 Billion by 2023.
What is the growth rate of Angiography Equipment Market?
Angiography Equipment Market grows at a CAGR of 5.0% during the forecast period.
To speak to our analyst for a discussion on the above findings, click Speak to Analyst
 Exclusive indicates content/data unique to MarketsandMarkets and not available with any competitors.
Table of Contents
1 Introduction (Page No. - 21)
1.1 Objectives of the Study
1.2 Angiography Equipment Market Definition
1.3 Study Scope
1.3.1 Markets Covered
1.3.2 Years Considered for the Study
1.4 Currency
1.5 Limitations
1.6 Stakeholders
2 Research Methodology (Page No. - 26)
2.1 Research Data
2.1.1 Secondary Data
2.1.1.1 Key Data From Secondary Sources
2.1.2 Primary Data
2.1.2.1 Key Data From Primary Sources
2.1.2.2 Key Industry Insights
2.2 Market Size Estimation
2.3 Market Breakdown and Data Triangulation
2.4 Market Share Estimation
2.5 Assumptions for the Study
3 Executive Summary (Page No. - 37)
4 Premium Insights (Page No. - 42)
4.1 Angiography Devices: Market Overview
4.2 Asia Pacific: angiography equipment market, By Procedure
4.3 Geographical Snapshot of the angiography equipment market
4.4 market: Regional Mix
4.5 Angiography Devices Market, By Product, 2018 vs 2023
5 Market Overview (Page No. - 46)
5.1 Introduction
5.2 Angiography Equipment Market Dynamics
5.2.1 Drivers
5.2.1.1 Growth in Aging Population and Incidence of CVD
5.2.1.2 Growing Awareness Programs, Conferences, and Funding Activities
5.2.1.3 Growing Demand for Interventional Angiography Systems in Minimally Invasive Surgeries
5.2.2 Restraints
5.2.2.1 Limitations in Reimbursement for Angiography Procedures
5.2.2.2 Risk of Radiation Exposure
5.2.3 Opportunities
5.2.3.1 Emerging Markets
5.2.3.2 Technological Advancements
5.2.4 Challenge
5.2.4.1 Increasing Product Recalls
6 Industry Insights (Page No. - 54)
6.1 Introduction
6.2 Industry Trends
6.2.1 3D and 4D Advanced Imaging and Planning Tools in Angiography Systems
6.2.2 Rising Trend Towards Reducing Radiation Doses
6.2.3 Oct Angiography (Oct-A) Devices
6.2.4 Consolidation of Market Players
6.3 Porter’s Five Forces Analysis
6.3.1 Threat of New Entrants
6.3.2 Threat of Substitutes
6.3.3 Bargaining Power of Suppliers
6.3.4 Bargaining Power of Buyers
6.3.5 Intensity of Competitive Rivalry
7 Angiography Equipment Market, By Product (Page No. - 59)
7.1 Introduction
7.2 Angiography Systems
7.3 Angiography Contrast Media
7.4 Vascular Closure Devices
7.5 Angiography Balloons
7.6 Angiography Catheters
7.7 Angiography Guidewires
7.8 Angiography Accessories
8 Angiography Equipment Market, By Technology (Page No. - 72)
8.1 Introduction
8.2 X-Ray Angiography
8.2.1 Image Intensifiers
8.2.2 Flat-Panel Detectors
8.3 Ct Angiography
8.4 Mr Angiography
8.5 Other Angiography Technologies
9 Angiography Equipment Market, By Procedure (Page No. - 81)
9.1 Introduction
9.2 Coronary Angiography
9.3 Endovascular Angiography
9.4 Neuroangiography
9.5 Onco-Angiography
9.6 Other Angiography Procedures
10 Coronary Angiography Market, By Indication (Page No. - 90)
10.1 Introduction
10.2 Coronary Artery Disease
10.3 Valvular Heart Disease
10.4 Congenital Heart Disease
10.5 Congestive Heart Failure
10.6 Other Indications
11 Angiography Equipment Market, By Application (Page No. - 97)
11.1 Introduction
11.2 Diagnostics
11.3 Therapeutics
12 Angiography Equipment Market, By End User (Page No. - 102)
12.1 Introduction
12.2 Hospitals & Clinics
12.3 Diagnostic & Imaging Centers
12.4 Research Institutes
13 Angiography Equipment Market, By Region (Page No. - 108)
13.1 Introduction
13.2 North America
13.2.1 US
13.2.2 Canada
13.3 Europe
13.3.1 Germany
13.3.2 UK
13.3.3 France
13.3.4 Italy
13.3.5 Spain
13.3.6 Rest of Europe (RoE)
13.4 Asia Pacific
13.4.1 Japan
13.4.2 China
13.4.3 India
13.4.4 Rest of Asia-Pacific (RoAPAC)
13.5 Latin America
13.5.1 Brazil
13.5.2 Mexico
13.5.3 Rest of Latin America (RoLA)
13.6 Middle East & Africa
14 Competitive Landscape (Page No. - 188)
14.1 Introduction
14.2 Angiography Equipment Market Share Analysis
14.2.1 Angiography Systems
14.2.2 Angiography Catheters
14.3 Competitive Situations and Trends
14.3.1 Product Launches and Enhancements
14.3.2 Partnerships, Agreements, & Collaborations
14.3.3 Acquisitions
14.3.4 Expansions
15 Company Profiles (Page No. - 196)
(Business Overview, Products Offered, Recent Developments, MnM View)*
15.1 GE Healthcare
15.2 Siemens
15.3 Philips
15.4 Shimadzu
15.5 Terumo
15.6 Abbott
15.7 Boston Scientific
15.8 Medtronic
15.9 Canon Medical Systems
15.10 Cordis (A Cardinal Health Company)
15.11 B. Braun
15.12 Angiodynamics
*Business Overview, Products Offered, Recent Developments, MnM View Might Not Be Captured in Case of Unlisted Companies.
16 Appendix (Page No. - 228)
16.1 Insights of Industry Experts
16.2 Discussion Guide
16.3 Knowledge Store: Marketsandmarkets’ Subscription Portal
16.4 Introducing RT: Real-Time Market Intelligence
16.5 Available Customizations
16.6 Related Report
16.7 Author Details
List of Tables (209 Tables)
Table 1 Angiography Equipment Market Snapshot
Table 2 Drivers: Impact Analysis
Table 3 Medicaid Fee Schedule for the Technical Component of Hospital Outpatient Radiology Procedures
Table 4 Restraints: Impact Analysis
Table 5 Opportunities: Impact Analysis
Table 6 Challenge: Impact Analysis
Table 7 Key Aquisitions in the Angiography Equipment Market , 2015-2018 (March)
Table 8 Market , By Product, 2016–2023 (USD Million)
Table 9 Angiography Systems Offered By Key Market Players
Table 10 Angiography Systems Market, By Country, 2016–2023 (USD Million)
Table 11 Angiography Contrast Media Market, By Country, 2016–2023 (USD Million)
Table 12 Vascular Closure Devices Offered By Key Market Players
Table 13 Vascular Closure Devices Market, By Country, 2016–2023 (USD Million)
Table 14 Angiography Balloons Offered By Key Market Players
Table 15 Angiography Balloons Market, By Country, 2016–2023 (USD Million)
Table 16 Angiography Catheters Offered By Key Market Players
Table 17 Angiography Catheters Market, By Country, 2016–2023 (USD Million)
Table 18 Angiography Guidewires Offered By Key Market Players
Table 19 Angiography Guidewires Market, By Country, 2016–2023 (USD Million)
Table 20 Angiography Accessories Market, By Country, 2016–2023 (USD Million)
Table 21 Angiography Systems Market, By Technology, 2016–2023 (USD Million)
Table 22 X-Ray Angiography Market, By Type, 2016–2023 (USD Million)
Table 23 X-Ray Angiography Market, By Country, 2016–2023 (USD Million)
Table 24 Image Intensifiers Market, By Country, 2016–2023 (USD Million)
Table 25 Flat-Panel Detectors Market, By Country, 2016–2023 (USD Million)
Table 26 Ct Angiography Market, By Country, 2016–2023 (USD Million)
Table 27 Mr Angiography Market, By Country, 2016–2023 (USD Million)
Table 28 Other Angiography Technologies Market, By Country, 2016–2023 (USD Million)
Table 29 Market , By Procedure, 2016–2023 (USD Million)
Table 30 Number of Coronary Angiography Procedures, By Region, 2016–2023
Table 31 Coronary Angiography Procedures Market, By Country, 2016–2023 (USD Million)
Table 32 Number of Endovascular Angiography Procedures, By Region, 2016–2023
Table 33 Endovascular Angiography Procedures Market, By Country, 2016–2023 (USD Million)
Table 34 Number of Neuroangiography Procedures, By Region, 2016–2023
Table 35 Neuroangiography Procedures Market, By Country, 2016–2023 (USD Million)
Table 36 Number of Onco-Angiography Procedures, By Region, 2016–2023
Table 37 Onco-Angiography Procedures Market, By Country, 2016–2023 (USD Million)
Table 38 Other Angiography Procedures Market, By Country, 2016–2023 (USD Million)
Table 39 Coronary Angiography Market, By Indication, 2016–2023 (USD Million)
Table 40 Coronary Angiography Market for Coronary Artery Disease, By Country, 2016–2023 (USD Million)
Table 41 Coronary Angiography Market for Valvular Heart Disease, By Country, 2016–2023 (USD Million)
Table 42 Coronary Angiography Market for Congenital Heart Disease, By Country, 2016–2023 (USD Million)
Table 43 Coronary Angiography Market for Congestive Heart Failure, By Country, 2016–2023 (USD Million)
Table 44 Coronary Angiography Market for Other Indications, By Country, 2016–2023 (USD Million)
Table 45 Angiography Devices Market, By Application, 2016–2023 (USD Million)
Table 46 Angiography Devices Market for Diagnostics, By Country, 2016–2023 (USD Million)
Table 47 Angiography Devices Market for Therapeutics, By Country, 2016–2023 (USD Million)
Table 48 Angiography Equipment Market , By End User, 2016–2023 (USD Million)
Table 49 Angiography Devices Market for Hospitals & Clinics, By Country, 2016–2023 (USD Million)
Table 50 Market for Diagnostic & Imaging Centers, By Country, 2016–2023 (USD Million)
Table 51 Angiography Devices Market for Research Institutes, By Country, 2016–2023 (USD Million)
Table 52 Angiography Devices Market, By Region, 2016–2023 (USD Million)
Table 53 North America: Angiography Devices Market, By Country, 2016–2023 (USD Million)
Table 54 North America: Angiography Devices Market, By Product, 2016–2023 (USD Million)
Table 55 North America: Angiography Systems Market, By Technology, 2016–2023 (USD Million)
Table 56 North America: X-Ray Angiography Market, By Type, 2016–2023 (USD Million)
Table 57 North America: Angiography Devices Market, By Application, 2016–2023 (USD Million)
Table 58 North America: Angiography Devices Market, By Procedure, 2016–2023 (USD Million)
Table 59 North America: Coronary Angiography Market, By Indication, 2016–2023 (USD Million)
Table 60 North America: Angiography Devices Market, By End User, 2016–2023 (USD Million)
Table 61 US: Key Macroindicators
Table 62 US: Angiography Devices Market, By Product, 2016–2023 (USD Million)
Table 63 US: Angiography Systems Market, By Technology, 2016–2023 (USD Million)
Table 64 US: X-Ray Angiography Market, By Type, 2016–2023 (USD Million)
Table 65 US: Angiography Equipment Market , By Application, 2016–2023 (USD Million)
Table 66 US: Angiography Devices Market, By Procedure, 2016–2023 (USD Million)
Table 67 US: Coronary Angiography Market, By Indication, 2016–2023 (USD Million)
Table 68 US: Market, By End User, 2016–2023 (USD Million)
Table 69 Canada: Key Macroindicators
Table 70 Canada: Angiography Equipment Market, By Product, 2016–2023 (USD Million)
Table 71 Canada: Market, By Technology, 2016–2023 (USD Million)
Table 72 Canada: X-Ray Angiography Market, By Type, 2016–2023 (USD Million)
Table 73 Canada: Angiography Devices Market, By Application, 2016–2023 (USD Million)
Table 74 Canada: Angiography Equipment Market, By Procedure, 2016–2023 (USD Million)
Table 75 Canada: Coronary Angiography Market, By Indication, 2016–2023 (USD Million)
Table 76 Canada: Angiography Devices Market, By End User, 2016–2023 (USD Million)
Table 77 Europe: Market, By Country, 2016–2023 (USD Million)
Table 78 Europe: Angiography Equipment Market, By Product, 2016–2023 (USD Million)
Table 79 Europe: Market, By Technology, 2016–2023 (USD Million)
Table 80 Europe: X-Ray Angiography Market, By Type, 2016–2023 (USD Million)
Table 81 Europe: Angiography Equipment Market, By Application, 2016–2023 (USD Million)
Table 82 Europe: Angiography Devices Market, By Procedure, 2016–2023 (USD Million)
Table 83 Europe: Coronary Angiography Market, By Indication, 2016–2023 (USD Million)
Table 84 Europe: Market, By End User, 2016–2023 (USD Million)
Table 85 Germany: Key Macroindicators
Table 86 Germany: Angiography Equipment Market, By Product, 2016–2023 (USD Million)
Table 87 Germany: Angiography Systems Market, By Technology, 2016–2023 (USD Million)
Table 88 Germany: X-Ray Angiography Market, By Type, 2016–2023 (USD Million)
Table 89 Germany: Market, By Application, 2016–2023 (USD Million)
Table 90 Germany: Angiography Devices Market, By Procedure, 2016–2023 (USD Million)
Table 91 Germany: Coronary Angiography Market, By Indication, 2016–2023 (USD Million)
Table 92 Germany: Market, By End User, 2016–2023 (USD Million)
Table 93 UK: Angiography Devices Market, By Product, 2016–2023 (USD Million)
Table 94 UK: Angiography Systems Market, By Technology, 2016–2023 (USD Million)
Table 95 UK: X-Ray Angiography Market, By Type, 2016–2023 (USD Million)
Table 96 UK: Angiography Equipment Market, By Application, 2016–2023 (USD Million)
Table 97 UK: Market, By Procedure, 2016–2023 (USD Million)
Table 98 UK: Coronary Angiography Market, By Indication, 2016–2023 (USD Million)
Table 99 UK: Angiography Devices Market, By End User, 2016–2023 (USD Million)
Table 100 France: Angiography Devices Market, By Product, 2016–2023 (USD Million)
Table 101 France: Angiography Systems Market, By Technology, 2016–2023 (USD Million)
Table 102 France: X-Ray Angiography Market, By Type, 2016–2023 (USD Million)
Table 103 France: Angiography Devices Market, By Application, 2016–2023 (USD Million)
Table 104 France: Angiography Equipment Market, By Procedure, 2016–2023 (USD Million)
Table 105 France: Coronary Angiography Market, By Indication, 2016–2023 (USD Million)
Table 106 France: Angiography Devices Market, By End User, 2016–2023 (USD Million)
Table 107 Italy: Market, By Product, 2016–2023 (USD Million)
Table 108 Italy: Angiography Systems Market, By Technology, 2016–2023 (USD Million)
Table 109 Italy: X-Ray Angiography Market, By Type, 2016–2023 (USD Million)
Table 110 Italy: Angiography Equipment Market, By Application, 2016–2023 (USD Million)
Table 111 Italy: Market, By Procedure, 2016–2023 (USD Million)
Table 112 Italy: Coronary Angiography Market, By Indication, 2016–2023 (USD Million)
Table 113 Italy: Angiography Devices Market, By End User, 2016–2023 (USD Million)
Table 114 Spain: Angiography Devices Market, By Product, 2016–2023 (USD Million)
Table 115 Spain: Angiography Systems Market, By Technology, 2016–2023 (USD Million)
Table 116 Spain: X-Ray Angiography Market, By Type, 2016–2023 (USD Million)
Table 117 Spain: Angiography Devices Market, By Application, 2016–2023 (USD Million)
Table 118 Spain: Angiography Devices Market, By Procedure, 2016–2023 (USD Million)
Table 119 Spain: Coronary Angiography Market, By Indication, 2016–2023 (USD Million)
Table 120 Spain: Angiography Devices Market, By End User, 2016–2023 (USD Million)
Table 121 RoE: Market, By Product, 2016–2023 (USD Million)
Table 122 RoE: Angiography Systems Market, By Technology, 2016–2023 (USD Million)
Table 123 RoE: X-Ray Angiography Market, By Type, 2016–2023 (USD Million)
Table 124 RoE: Angiography Devices Market, By Application, 2016–2023 (USD Million)
Table 125 RoE: Angiography Devices Market, By Procedure, 2016–2023 (USD Million)
Table 126 RoE: Coronary Angiography Market, By Indication, 2016–2023 (USD Million)
Table 127 RoE: Angiography Devices Market, By End User, 2016–2023 (USD Million)
Table 128 Asia Pacific: Angiography Equipment Market, By Country, 2016–2023 (USD Million)
Table 129 Asia Pacific: Angiography Devices Market, By Product, 2016–2023 (USD Million)
Table 130 Asia Pacific: Angiography Systems Market, By Technology, 2016–2023 (USD Million)
Table 131 Asia Pacific: X-Ray Angiography Market, By Type, 2016–2023 (USD Million)
Table 132 Asia Pacific: Angiography Devices Market, By Application, 2016–2023 (USD Million)
Table 133 Asia Pacific: Angiography Devices Market, By Procedure, 2016–2023 (USD Million)
Table 134 Asia Pacific: Coronary Angiography Market, By Indication, 2016–2023 (USD Million)
Table 135 Asia Pacific: Angiography Devices Market, By End User, 2016–2023 (USD Million)
Table 136 Japan: Key Macroindicators
Table 137 Japan: Angiography Devices Market, By Product, 2016–2023 (USD Million)
Table 138 Japan: Angiography Systems Market, By Technology, 2016–2023 (USD Million)
Table 139 Japan: X-Ray Angiography Market, By Type, 2016–2023 (USD Million)
Table 140 Japan: Angiography Devices Market, By Application, 2016–2023 (USD Million)
Table 141 Japan: Angiography Devices Market, By Procedure, 2016–2023 (USD Million)
Table 142 Japan: Coronary Angiography Market, By Indication, 2016–2023 (USD Million)
Table 143 Japan: Angiography Devices Market, By End User, 2016–2023 (USD Million)
Table 144 China: Key Macroindicators
Table 145 China: Angiography Devices Market, By Product, 2016–2023 (USD Million)
Table 146 China: Angiography Systems Market, By Technology, 2016–2023 (USD Million)
Table 147 China: X-Ray Angiography Market, By Type, 2016–2023 (USD Million)
Table 148 China: Market, By Application, 2016–2023 (USD Million)
Table 149 China: Angiography Devices Market, By Procedure, 2016–2023 (USD Million)
Table 150 China: Coronary Angiography Market, By Indication, 2016–2023 (USD Million)
Table 151 China: Angiography Devices Market, By End User, 2016–2023 (USD Million)
Table 152 India: Key Macroindicators
Table 153 India: Angiography Devices Market, By Product, 2016–2023 (USD Million)
Table 154 India: Angiography Systems Market, By Technology, 2016–2023 (USD Million)
Table 155 India: X-Ray Angiography Market, By Type, 2016–2023 (USD Million)
Table 156 India: Angiography Devices Market, By Application, 2016–2023 (USD Million)
Table 157 India: Angiography Devices Market, By Procedure, 2016–2023 (USD Million)
Table 158 India: Coronary Angiography Market, By Indication, 2016–2023 (USD Million)
Table 159 India: Angiography Equipment Market, By End User, 2016–2023 (USD Million)
Table 160 RoAPAC: Angiography Devices Market, By Product, 2016–2023 (USD Million)
Table 161 RoAPAC: Angiography Systems Market, By Technology, 2016–2023 (USD Million)
Table 162 RoAPAC: X-Ray Angiography Market, By Type, 2016–2023 (USD Million)
Table 163 RoAPAC: Angiography Devices Market, By Application, 2016–2023 (USD Million)
Table 164 RoAPAC: Angiography Devices Market, By Procedure, 2016–2023 (USD Million)
Table 165 RoAPAC: Coronary Angiography Market, By Indication, 2016–2023 (USD Million)
Table 166 RoAPAC: Angiography Devices Market, By End User, 2016–2023 (USD Million)
Table 167 Latin America: Angiography Devices Market, By Country, 2016–2023 (USD Million)
Table 168 Latin America: Angiography Devices Market, By Product, 2016–2023 (USD Million)
Table 169 Latin America: Angiography Systems Market, By Technology, 2016–2023 (USD Million)
Table 170 Latin America: X-Ray Angiography Market, By Type, 2016–2023 (USD Million)
Table 171 Latin America: Angiography Devices Market, By Application, 2016–2023 (USD Million)
Table 172 Latin America: Angiography Devices Market, By Procedure, 2016–2023 (USD Million)
Table 173 Latin America: Coronary Angiography Market, By Indication, 2016–2023 (USD Million)
Table 174 Latin America: Angiography Devices Market, By End User, 2016–2023 (USD Million)
Table 175 Brazil: Key Macroindicators
Table 176 Brazil: Angiography Devices Market, By Product, 2016–2023 (USD Million)
Table 177 Brazil: Angiography Systems Market, By Technology, 2016–2023 (USD Million)
Table 178 Brazil: X-Ray Angiography Market, By Type, 2016–2023 (USD Million)
Table 179 Brazil: Angiography Devices Market, By Application, 2016–2023 (USD Million)
Table 180 Brazil: Angiography Devices Market, By Procedure, 2016–2023 (USD Million)
Table 181 Brazil: Coronary Angiography Market, By Indication, 2016–2023 (USD Million)
Table 182 Brazil: Angiography Devices Market, By End User, 2016–2023 (USD Million)
Table 183 Mexico: Key Macroindicators
Table 184 Mexico: Angiography Devices Market, By Product, 2016–2023 (USD Million)
Table 185 Mexico: Angiography Systems Market, By Technology, 2016–2023 (USD Million)
Table 186 Mexico: X-Ray Angiography Market, By Type, 2016–2023 (USD Million)
Table 187 Mexico: Angiography Devices Market, By Application, 2016–2023 (USD Million)
Table 188 Mexico: Angiography Devices Market, By Procedure, 2016–2023 (USD Million)
Table 189 Mexico: Coronary Angiography Market, By Indication, 2016–2023 (USD Million)
Table 190 Mexico: Angiography Devices Market, By End User, 2016–2023 (USD Million)
Table 191 RoLA: Angiography Equipment Market, By Product, 2016–2023 (USD Million)
Table 192 RoLA: Angiography Systems Market, By Technology, 2016–2023 (USD Million)
Table 193 RoLA: X-Ray Angiography Market, By Type, 2016–2023 (USD Million)
Table 194 RoLA: Angiography Devices Market, By Application, 2016–2023 (USD Million)
Table 195 RoLA: Market, By Procedure, 2016–2023 (USD Million)
Table 196 RoLA: Coronary Angiography Market, By Indication, 2016–2023 (USD Million)
Table 197 RoLA: Angiography Devices Market, By End User, 2016–2023 (USD Million)
Table 198 Middle East & Africa: Angiography Devices Market, By Product, 2016–2023 (USD Million)
Table 199 Middle East & Africa: Angiography Systems Market, By Technology, 2016–2023 (USD Million)
Table 200 Middle East & Africa: X-Ray Angiography Market, By Type, 2016–2023 (USD Million)
Table 201 Middle East & Africa: Angiography Devices Market, By Application, 2016–2023 (USD Million)
Table 202 Middle East & Africa: Angiography Devices Market, By Procedure, 2016–2023 (USD Million)
Table 203 Middle East & Africa: Coronary Angiography Market, By Indication, 2016–2023 (USD Million)
Table 204 Middle East & Africa: Angiography Devices Market, By End User, 2016–2023 (USD Million)
Table 205 Growth Strategy Matrix (January 2015–April 2018)
Table 206 Product Launches and Enhancements, 2015–2018 (Till April)
Table 207 Partnerships, Agreements, & Collaborations, 2015–2018 (Till April)
Table 208 Acquisitions, 2015–2018 ( Till April)
Table 209 Expansions, 2015–2017
List of Figures (47 Figures)
Figure 1 Global Angiography Devices Market
Figure 2 Research Design
Figure 3 Primary Sources
Figure 4 Breakdown of Primary Interviews (Supply Side): By Company Type, Designation, and Region
Figure 5 Breakdown of Primary Interviews (Demand Side): By Type of Facility and Region
Figure 6 Bottom-Up Approach
Figure 7 Top-Down Approach
Figure 8 Data Triangulation Methodology
Figure 9 Angiography Devices Market, By Product, 2018 vs 2023 (USD Million)
Figure 10 Angiography Devices Market, By Application, 2018 vs 2023 (USD Million)
Figure 11 Angiography Devices Market, By Procedure, 2018 vs 2023
Figure 12 Angiography Devices Market, By End User, 2018 vs 2023
Figure 13 Europe Accounted for the Largest Share of the Angiography Devices Market in 2017
Figure 14 Growth in Aging Population and Incidence of CVDs is the Key Driver for This Market
Figure 15 Coronary Angiography Segment Accounted for the Largest Market Share of APAC Angiography Devices Market in 2017
Figure 16 Emerging Countries to Register Highest CAGR During the Forecast Period
Figure 17 Latin America to Register the Highest CAGR During the Forecast Period
Figure 18 Angiography Systems to Dominate the Market Till 2023
Figure 19 Angiography Devices Market: Drivers, Restraints, Opportunities, and Challenge
Figure 20 Increase in Geriatric Population, By Region (2011–2030)
Figure 21 Prevalence of Cardiovascular Diseases, 2015–2035
Figure 22 Porter’s Five Forces Analysis: Angiography Devices Market
Figure 23 Angiography Systems to Dominate the Market During the Forecast Period
Figure 24 X-Ray Angiography Segment to Dominate the Market During the Forecast Period
Figure 25 Coronary Artery Disease Segment Will Dominate the Coronary Angiography Market During the Forecast Period
Figure 26 Therapeutics Segment to Register the Highest CAGR During the Forecast Period
Figure 27 Hospitals & Clinics Segment to Register the Highest CAGR During the Forecast Period
Figure 28 Geographical Snapshot of the Angiography Devices Market
Figure 29 North America: Angiography Devices Market Snapshot
Figure 30 Europe: Angiography Devices Market Snapshot
Figure 31 Asia Pacific: Angiography Devices Market Snapshot
Figure 32 Key Developments in the Angiography Devices Market Between January 2015 & April 2018
Figure 33 Geographic Reach of Top Market Players (2017)
Figure 34 Angiography Systems Market Share Analysis, By Key Player, 2017
Figure 35 Angiography Catheters Market Share Analysis, By Key Player, 2017
Figure 36 GE Healthcare: Company Snapshot (2017)
Figure 37 Siemens AG: Company Snapshot (2017)
Figure 38 Philips Group: Company Snapshot (2017)
Figure 39 Shimadzu: Company Snapshot (2016)
Figure 40 Terumo: Company Snapshot (2016)
Figure 41 Abbott Laboratories: Company Snapshot (2017)
Figure 42 Boston Scientific: Company Snapshot (2017)
Figure 43 Medtronic: Company Snapshot (2017)
Figure 44 Canon: Company Snapshot (2017)
Figure 45 Cardinal Health: Company Snapshot (2017)
Figure 46 B. Braun: Company Snapshot (2017)
Figure 47 Angiodynamics: Company Snapshot (2017)

 Generating Response ...


Growth opportunities and latent adjacency in Angiography Equipment Market