Anhydrous Aluminum Chloride Market by Form (Granule, Powder), Application (Dyes & Pigments, Pesticide, Pharmaceuticals & Cosmetics, Hydrocarbon Resins, Fumed Alumina, Electrolytic Production of Aluminum, Titanium Dioxide), Region-Global Forecast to 2022


[113 Pages Report] Anhydrous aluminum chloride is an odorless, white or yellow crystalline solid having low melting and boiling point. It is primarily used as a catalyst in the chemical industry for various applications such as dyes and pigments, pesticides, reforming hydrocarbons, pharmaceuticals and as active ingredients in cosmetics. It is also used in the manufacturing of fumed alumina, electrolytic production of aluminum, and as a nucleating agent in the production of titanium dioxide
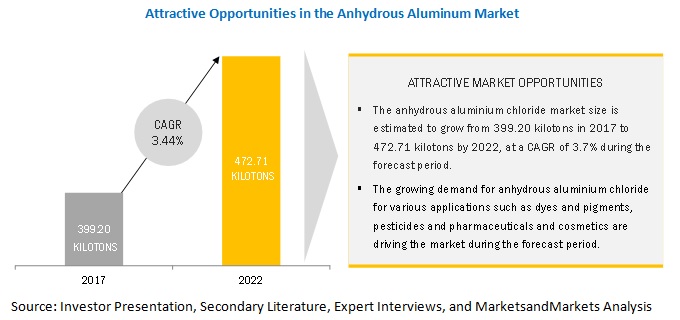
The global market size of anhydrous aluminum chloride was about USD 742.76 million in 2016 and is projected to reach USD 948.65 million by 2022, at a CAGR of 4.19% between 2017 and 2022. Also, the market is estimated to grow from 399.20 kilotons in 2017 to 472.71 kilotons by 2020, at a CAGR of 3.7% during the forecast period. The increased demand for anhydrous aluminum chloride as a catalyst to derive various chemical intermediates for dyes and pigments, pesticides, and pharmaceuticals and cosmetics application drives the growth of the market.
Granule form expected to dominate the anhydrous aluminum market during the forecast period
The market for granular anhydrous aluminum chloride held a large share in 2016, in terms of value. The market growth of granular anhydrous aluminum chloride is because of its use as a catalyst for various applications such as dyes and pigments, pesticides, pharmaceuticals and cosmetics, and reforming hydrocarbons. Also, it possesses a preferred particle size for the export market.
Dyes and pigments application DOMINATes the anhydrous aluminum chloride market during the forecast period
The dyes and pigments application held the largest share in terms of value, of the overall anhydrous aluminum chloride market in 2016.
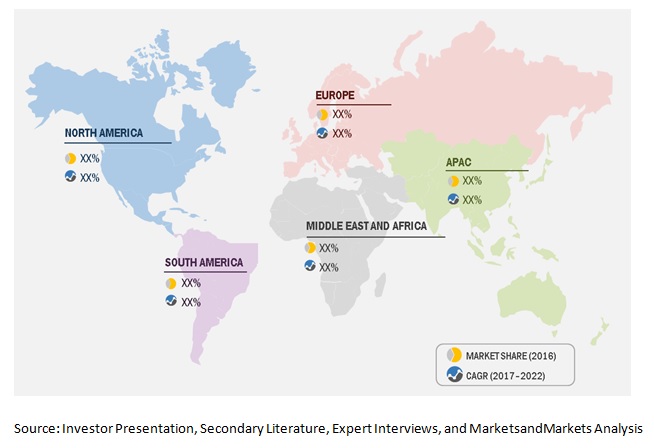
APAC to account for the largest growth in market size during the forecast period
In 2016, APAC held the largest share of the global anhydrous aluminum chloride market in terms of volume. It is also projected to register the highest CAGR in terms of volume, between 2017 and 2022.
The growing demand for dyes and pigments from emerging economies-such as China, India, South Korea, Vietnam, and other Southeast Asian countries-are likely to drive the anhydrous aluminum chloride market during the forecast period. Also, China, Japan, and India are major producers and consumers of pesticides, pharmaceutical drugs, cosmetics, and metallurgy in APAC. Therefore, all these factors influence a positive outlook in this region.
Market Dynamics
Driver: Growing demand from various applications
Anhydrous aluminum chloride is primarily used as a catalyst in the chemicals industry for various applications, such as dyes and pigments, pesticides, reforming hydrocarbons, and pharmaceuticals and cosmetics. Dyes and pigments is the largest market for anhydrous aluminum chloride as it is used to derive major dye intermediates, such as anthraquinone, phthalocyanine green, ethylbenzene, and meta phenoxy benzaldehyde. Demand for anhydrous aluminum chloride is also driven by the requirement of dyes and pigments in growing textile, printing ink, plastics, paints & coatings, and other niche industries.
Anhydrous aluminum chloride is also used as a raw material in the production of fumed alumina, electrolytic production of aluminum, and as a nucleating agent in the production of titanium dioxide. Therefore, the use of anhydrous aluminum chloride in various applications drives the market.
Restraint: Fluctuating raw materials prices
Aluminum scrap and chlorine are the raw materials required for manufacturing anhydrous aluminum chloride. Aluminum scrap is obtained from scrap dealers, and chlorine is sourced from various caustic soda and chlorine producers. As the production of anhydrous aluminum chloride is highly dependent on the supply of chlorine, the production price of anhydrous aluminum chloride varies as per the supplier price of chlorine and availability of aluminum scrap.
Opportunity: An increasing export opportunity for anhydrous aluminum chloride in APAC
Anhydrous aluminum chloride is primarily manufactured in APAC and exported globally. Stringent regulations pertaining to the manufacture of hazardous chemicals in North America and Europe play an important role in the market. The manufacture of anhydrous aluminum chloride is continuously decreasing in these regions due to its hazardous chemical properties. Hence, it is mainly imported from APAC for domestic applications. China and India are the 2 major countries exporting anhydrous aluminum chloride globally. Owing to this opportunity, Gujarat Alkalies and Chemicals increased its production capacity of anhydrous aluminum chloride plant by installing 4 additional reactors in 2016.
Challenge: Difficulty in storing anhydrous aluminum chloride
Anhydrous aluminum chloride is usually stored in a cool, dry, and well-ventilated area, and away from moisture, heat, any source of ignition, and strongly alkaline materials. Being hygroscopic and corrosive in nature, anhydrous aluminum chloride is difficult to store. Hence, it is manufactured and supplied based on the demand from various end-use applications and requires excellent packaging for distribution. Therefore, storage and packaging play an important role in maintaining the quality of this compound.
Scope of the Report
|
Report Metric |
Details |
|
Market size available for years |
2015 � 2022 |
|
Base year considered |
2016 |
|
Forecast period |
2017 � 2022 |
|
Forecast units |
Million/Billion(USD), Kilotons |
|
Segments covered |
Form, Application, and Region |
|
Geographies covered |
North America, Europe, APAC, RoW (South America, Middle East, and Africa) |
|
Companies covered |
Gulbrandsen (US), Gujarat Alkalies & Chemicals Limited (India), BASF (Germany), Aditya Birla Chemicals (India), Kemira Oyj (Finland), NipponLight Metal (Japan), Kemira (Finland). NipponSoda Co., Ltd (Japan), Dongying Kunbao Chemical (China), Kanto Denka Kogyo (Japan), Base Metal Group (India), Umiya Group Of Companies (India),Nike Chemical India (India),Vanchlor (US), Seabert Chemicals (India), Upra Chem (India), Avi-Chem Industries (India), Weifang Menjie Chemicals (China), American Elemants (US), Lynwon Group (China), Anmol Chloro Chem (India), Real Metalchem Private Limited (India), Chemtex Specialty Limited (India), Alfa Aesar (US), Dcm Shriram Industries (India) |
The research report categorizes the Anhydrous Aluminum Market to forecast the revenues and analyze the trends in each of the following sub-segments:
Anhydrous Aluminum Market, By Form
- Granule
- Powder
Anhydrous Aluminum Market, By Application
- Dyes & Pigments
- Pesticides
- Pharmaceuticals & Cosmetics
- Hydrocarbons Resins
- Fumed Aluminia
- Electrolytic Production of Aluminum
- Titanium Dioxide
- Others
Anhydrous Aluminum Market, By Geography
- North America
- Europe
- Asia Pacific (APAC)
- South America
- Middle East & Africa
Key Market Players
Gulbrandsen (US), Gujarat Alkalies & Chemicals Limited (India), BASF (Germany), Aditya Birla Chemicals (India), and Kemira Oyj (Finland).
Recent Developments
|
Month & Year |
Company Name |
Synergy |
|
August 2017 |
DCM Shriram Industries |
The company has announced a project to develop a plant in Bharuch, India, that would produce 60 TPD of anhydrous aluminum chloride. The project is expected to initiate in June 2018. Moreover, the company focuses on strengthening the chlor-alkali business by expanding its production capacity. |
|
March 2017 |
Gujarat Alkalies and Chemicals |
The company has increased its production of anhydrous aluminum chloride, from 63 TPD to 72 TPD, by installing four more reactors in Dahej, India. It also has plans to set up a 16,500-TPA plant at an estimated cost of USD 5.21 million for the production of anhydrous aluminum chloride in Dahej, India. The expansion helps the company cater to the overall demand of the anhydrous aluminum chloride market. |
Critical questions the report answers:
- What are the upcoming trends for the Anhydrous Aluminum Chloride market?
- Which segment provides the most opportunity for growth?
- Who are the leading vendors operating in this market?
- What are the opportunities for new market entrants?
To speak to our analyst for a discussion on the above findings, click Speak to Analyst
 Exclusive indicates content/data unique to MarketsandMarkets and not available with any competitors.
Table of Contents
1 Introduction (Page No. - 14)
1.1 Objectives of the Study
1.2 Definition
1.3 Market Scope
1.3.1 Years Considered for the Study
1.4 Currency
1.5 Unit Considered
1.6 Stakeholders
2 Research Methodology (Page No. - 17)
2.1 Research Data
2.1.1 Secondary Data
2.1.1.1 Secondary Sources
2.1.2 Primary Data
2.1.2.1 Key Data From Primary Sources
2.1.2.2 Key Industry Insights
2.1.2.3 Breakdown of Primary Interviews
2.2 Market Size Estimation
2.2.1 Top-Down and Bottom-Up Approach
2.3 Data Triangulation
2.3.1 Assumptions
2.4 Limitations
3 Executive Summary (Page No. - 25)
4 Premium Insights (Page No. - 28)
4.1 Attractive Market Opportunities in Anhydrous Aluminum Chloride
4.2 Market of Anhydrous Aluminum Chloride, By Form
4.3 Market Growth of Anhydrous Aluminum Chloride, By Application
4.4 Market of Anhydrous Aluminum Chloride in APAC, By Country and Application
5 Market Overview (Page No. - 31)
5.1 Introduction
5.2 Market Dynamics
5.2.1 Drivers
5.2.1.1 Growing Demand From Various Applications
5.2.1.2 High Demand for Anhydrous Aluminum Chloride in APAC
5.2.2 Restraints
5.2.2.1 Fluctuating Raw Materials Prices
5.2.3 Opportunities
5.2.3.1 Increasing Export Opportunity for Anhydrous Aluminum Chloride in APAC
5.2.4 Challenges
5.2.4.1 Difficulty in Storing Anhydrous Aluminum Chloride
5.3 Porter�s Five Forces Analysis
5.3.1 Threat of New Entrants
5.3.2 Threat of Substitutes
5.3.3 Bargaining Power of Suppliers
5.3.4 Bargaining Power of Buyers
5.3.5 Intensity of Competitive Rivalry
6 Anhydrous Aluminum Chloride Market, By Form (Page No. - 35)
6.1 Introduction
6.2 Granule
6.3 Powder
7 Anhydrous Aluminum Chloride Market, By Application (Page No. - 39)
7.1 Introduction
7.2 Dyes & Pigments
7.3 Pesticides
7.4 Pharmaceuticals and Cosmetics
7.5 Hydrocarbon Resins
7.6 Fumed Alumina
7.7 Electrolytic Production of Aluminum
7.8 Titanium Dioxide
7.9 Others
8 Anhydrous Aluminum Chloride Market, By Region (Page No. - 50)
8.1 Introduction
8.2 APAC
8.2.1 China
8.2.2 India
8.2.3 Japan
8.2.4 South Korea
8.2.5 Indonesia
8.2.6 Australia
8.2.7 Vietnam
8.2.8 Rest of APAC
8.3 Europe
8.3.1 Germany
8.3.2 France
8.3.3 Italy
8.3.4 Uk
8.3.5 Spain
8.3.6 Belgium
8.3.7 Turkey
8.3.8 Russia
8.3.9 Rest of Europe
8.4 North America
8.4.1 Us
8.4.2 Mexico
8.4.3 Canada
8.5 South America
8.5.1 Brazil
8.5.2 Argentina
8.5.3 Colombia
8.5.4 Rest of South America
8.6 Middle East & Africa
8.6.1 Saudi Arabia
8.6.2 South Africa
8.6.3 Uae
8.6.4 Qatar
8.6.5 Rest of Middle East & Africa
9 Competitive Landscape (Page No. - 85)
9.1 Overview
9.2 Market Ranking
9.2.1 Market Ranking of Key Players (2016)
9.3 Competitive Situation and Trends
9.3.1 Investment and Expansion
10 Company Profiles (Page No. - 87)
10.1 Gulbrandsen
10.2 Aditya Birla Chemicals
10.3 Gujarat Alkalies and Chemicals Limited
10.4 BASF
10.5 Nippon Light Metal
10.6 Kemira
10.7 Nippon Soda Co., Ltd
10.8 Dongying Kunbao Chemical
10.9 Juhua Group Corporation
10.10 Kanto Denka Kogyo
10.11 Other Key Players
10.11.1 Base Metal Group
10.11.2 Umiya Group of Companies
10.11.3 Nike Chemical India
10.11.4 Vanchlor
10.11.5 Seabert Chemicals
10.11.6 Upra Chem
10.11.7 Avi-Chem Industries
10.11.8 Weifang Menjie Chemicals
10.11.9 American Elements
10.11.10 Lynwon Group
10.11.11 Anmol Chloro Chem
10.11.12 Real Metalchem Private Limited
10.11.13 Chemtex Speciality Limited
10.11.14 Alfa Aesar
10.11.15 DCM Shriram Industries
11 Appendix (Page No. - 106)
11.1 Insights From Industry Experts
11.2 Discussion Guide
11.3 Knowledge Store: Marketsandmarkets Subscription Portal
11.4 Introducing RT: Real Time Market Intelligence
11.5 Available Customizations
11.6 Related Reports
11.7 Authors Details
List of Tables (77 Tables)
Table 1 Anhydrous Aluminum Chloride Market, By Form, 2015�2022 (USD Million)
Table 2 Market, By Form, 2015�2022 (Kiloton)
Table 3 Market for Granule Form, By Region, 2015�2022 (USD Million)
Table 4 Market for Granule Form, By Region, 2015�2022 (Kiloton)
Table 5 Market for Powder Form, By Region, 2015�2022 (USD Million)
Table 6 Market for Powder Form, By Region, 2015�2022 (Kiloton)
Table 7 Market, By Application, 2015�2022 (USD Million)
Table 8 Market, By Application, 2015�2022 (Kiloton)
Table 9 Market for Dyes & Pigments, By Region, 2015�2022 (USD Million)
Table 10 Market for Dyes & Pigments, By Region, 2015�2022 (Kiloton)
Table 11 Market for Pesticides, By Region, 2015�2022 (USD Million)
Table 12 Market for Pesticides, By Region, 2015�2022 (Kiloton)
Table 13 Market for Pharmaceuticals and Cosmetics, By Region, 2015�2022 (USD Million)
Table 14 Market for Pharmaceuticals and Cosmetics, By Region, 2015�2022 (Kiloton)
Table 15 Market for Hydrocarbon Resins, By Region, 2015�2022 (USD Million)
Table 16 Market for Hydrocarbon Resins, By Region, 2015�2022 (Kiloton)
Table 17 Market for Fumed Alumina, By Region, 2015�2022 (USD Million)
Table 18 Market for Fumed Alumina, By Region, 2015�2022 (Kiloton)
Table 19 Market for Electrolytic Production of Aluminum, By Region, 2015�2022 (USD Million)
Table 20 Market for Electrolytic Production of Aluminum, By Region, 2015�2022 (Kiloton)
Table 21 Market for Titanium Dioxide, By Region, 2015�2022 (USD Million)
Table 22 Market for Titanium Dioxide, By Region, 2015�2022 (Kiloton)
Table 23 Market for Others, By Region, 2015�2022 (USD Million)
Table 24 Market for Others, By Region, 2015�2022 (Kiloton)
Table 25 Market, By Region, 2015�2022 (USD Million)
Table 26 Market, By Region, 2015�2022 (Kiloton)
Table 27 Market in APAC, By Country, 2015�2022 (USD Million)
Table 28 Market in APAC, By Country, 2015�2022 (Kiloton)
Table 29 Market in APAC, By Form, 2015�2022 (USD Million)
Table 30 Market in APAC, By Form, 2015�2022 (Kiloton)
Table 31 Market in APAC, By Application2015�2022 (USD Million)
Table 32 Market in APAC, By Application, 2015�2022 (Kiloton)
Table 33 Market in China, By Application, 2015�2022 (USD Million)
Table 34 Market in China, By Application, 2015�2022 (Kiloton)
Table 35 Market in India, By Application, 2015�2022 (USD Million)
Table 36 Market in India, By Application, 2015�2022 (Kiloton)
Table 37 Market in Japan, By Application, 2015�2022 (USD Million)
Table 38 Market in Japan, By Application, 2015�2022 (Kiloton)
Table 39 Market Europe, By Country, 2015�2022 (USD Million)
Table 40 Market in Europe, By Country, 2015�2022 (Kiloton)
Table 41 Market in Europe, By Form, 2015�2022 (USD Million)
Table 42 Market in Europe, By Form, 2015�2022 (Kiloton)
Table 43 Market in Europe, By Application, 2015�2022 (USD Million)
Table 44 Market in Europe, By Application, 2015�2022 (Kiloton)
Table 45 Market in Germany, By Applciation, 2015�2022 (USD Million)
Table 46 Market in Germany, By Application, 2015�2022 (Kiloton)
Table 47 Market in France, By Application, 2015�2022 (USD Million)
Table 48 Market in France, By Applciation, 2015�2022 (Kiloton)
Table 49 Market in Italy, By Application, 2015�2022 (USD Million)
Table 50 Market in Italy, By Applciation, 2015�2022 (Kiloton)
Table 51 Market in North America, By Country, 2015�2022 (USD Million)
Table 52 Market in North America, By Country, 2015�2022 (Kiloton)
Table 53 Market in North America, By Form, 2015�2022 (USD Million)
Table 54 Market in North America, By Form, 2015�2022 (Kiloton)
Table 55 Market in North America, By Application, 2015�2022 (USD Million)
Table 56 Market in North America, By Application, 2015�2022 (Kiloton)
Table 57 Market in Us, By Application, 2015�2022 (USD Million)
Table 58 Market in Us, By Application, 2015�2022 (Kiloton)
Table 59 Market in Mexico, By Application, 2015�2022 (USD Million)
Table 60 Market in Mexico, By Application, 2015�2022 (Kiloton)
Table 61 Market in South America, By Country, 2015�2022 (USD Million)
Table 62 Market in South America, By Country, 2015�2022 (Kiloton)
Table 63 Market in South America, By Form, 2015�2022 (USD Million)
Table 64 Market in South America, By Form, 2015�2022 (Kiloton)
Table 65 Market in South America, By Application, 2015�2022 (USD Million)
Table 66 Market in South America, By Application, 2015�2022 (Kiloton)
Table 67 Market in Brazil, By Application, 2015�2022 (USD Million)
Table 68 Market in Brazil, By Application, 2015�2022 (Kiloton)
Table 69 Market in Middle East & Africa, By Country, 2015�2022 (USD Million)
Table 70 Market in Middle East & Africa, By Country, 2015�2022 (Kiloton)
Table 71 Market in Middle East & Africa, By Form, 2015�2022 (USD Million)
Table 72 Market in Middle East & Africa, By Form, 2015�2022 (Kiloton)
Table 73 Market in Middle East & Africa, By Application, 2015�2022 (USD Million)
Table 74 Market in Middle East & Africa, By Application, 2015�2022 (Kiloton)
Table 75 Market in Saudi Arabia, By Application, 2015�2022 (USD Million)
Table 76 Market in Saudi Arabia, By Application, 2015�2022 (Kiloton)
Table 77 Investment and Expansion, 2014�2017
List of Figures (33 Figures)
Figure 1 Anhydrous Aluminum Chloride Market: Research Design
Figure 2 Market Size Estimation: Top-Down Approach
Figure 3 Market Size Estimation: Bottom-Up Approach
Figure 4 Market: Data Triangulation
Figure 5 Granule Form Expected to Dominate the Anhydrous Aluminum Market During the Forecast Period
Figure 6 Dyes and Pigments Application Dominates the Market of Anhydrous Aluminum Chloride During the Forecast Period
Figure 7 Market: Snapshot
Figure 8 Emerging Economies Offer High Growth Opportunities in Market of Anhydrous Aluminum Chloride
Figure 9 Granular Anhydrous Aluminum Chloride Expected to Register A Higher Cagr Between 2017 and 2022
Figure 10 Anhydrous Aluminum Chloride for Dyes and Pigments Expected to Register the Highest Cagr During the Forecast Period
Figure 11 China Accounted for the Largest Share of Market in Anhydrous Aluminum Chloride in 2016
Figure 12 Factors Governing Market of Anhydrous Aluminum Chloride
Figure 13 Granule Form Expected to Lead the Market of Anhydrous Aluminum Chloride During the Forecast Period
Figure 14 Market of Anhydrous Aluminum Chloride for Dyes & Pigments to Grow at Highest Cagr During Forecast Period
Figure 15 Regional Snapshot: India and China to Be Fast-Growing Markets for Anhydrous Aluminum Chloride During 2017�2022
Figure 16 Market Snapshot of Anhydrous Aluminum Chloride in APAC
Figure 17 Market Snapshot of Anhydrous Aluminum Chloride in Europe
Figure 18 Germany to Dominate Market of Anhydrous Aluminum Chloride During Forecast Period
Figure 19 US Expected to Continue to Lead North American Market of Anhydrous Aluminum Chloride During 2017�2022
Figure 20 Brazil Expected to Continue to Dominate South American Market of Anhydrous Aluminum Chloride During 2017�2022
Figure 21 Saudi Arabia Expected to Continue to Lead the Market of Anhydrous Aluminum Chloride During Forecast Period
Figure 22 Investment & Expansion is the Key Growth Strategy Between 2014 and 2017
Figure 23 Gulbrandsen: SWOT Analysis
Figure 24 Aditya Birla Chemicals: Company Snapshot
Figure 25 Aditya Birla Chemicals: SWOT Analysis
Figure 26 Gujarat Alkalies and Chemicals Limited: Company Snapshot
Figure 27 Gujarat Alkalies and Chemicals Limited: SWOT Analysis
Figure 28 BASF: Company Snapshot
Figure 29 BASF: SWOT Analysis
Figure 30 Nippon Light Metal: Company Snapshot
Figure 31 Kemira: Company Snapshot
Figure 32 Kemira: SWOT Analysis
Figure 33 Nippon Soda Co., Ltd: Company Snapshot


Growth opportunities and latent adjacency in Anhydrous Aluminum Chloride Market