Antibody Production Market by Process (Upstream Processing, Downstream Processing, and Filtration), End-User (Pharmaceutical & Biotechnology Companies, Diagnostic Laboratories, and Research Institutes) - Global Forecast to 2021


The global antibody production market size is projected grow at a CAGR of 12.3%. The market comprises products that are required during the different stages of bioprocessing of antibodies, such as upstream processing, downstream processing, and filtration. The improved approval rate of therapeutic antibodies by regulatory authorities, patent expiry of blockbuster monoclonal antibodies, increasing adoption of targeted immunotherapy, and increased R&D expenditure of pharmaceutical and biotechnology companies are driving the overall market. The increasing prevalence of infectious diseases and rising demand for protein therapeutics are expected to provide growth opportunities for players operating in this market.
Objectives of the Study
- To define, describe, and forecast the global antibody production market on the basis of process, end user, and region
- To provide detailed information regarding major factors influencing growth of the market (drivers, restraints, opportunities, and industry-specific challenges)
- To strategically analyze micromarkets with respect to individual growth trends, future prospects, and contributions to the overall market
- To analyze opportunities in the market for stakeholders and provide details of the competitive landscape for market leaders
- To forecast the size of the market with respect to four main regions, namely, North America, Europe, Asia-Pacific, and the Rest of the World
- To strategically profile the key players in the global antibody production market and comprehensively analyze their core competencies
- To track and analyze competitive developments such as joint ventures and alliances, mergers and acquisitions, new product/technology development, and research and development activities of the leading players in the global market
Research Methodology
Top-down and bottom-up approaches were used to validate the size of the global antibody production market and estimate the size of various other dependent submarkets. Various secondary sources such as directories, industry journals, databases such as Hoover’s, Bloomberg Business, Factiva, and Avention, and annual reports of the companies have been used to identify and collect information useful for the study of this market. Primary sources such as experts from both supply and demand sides have been interviewed to obtain and validate information as well as to assess dynamics of this market. The breakdown of profiles of primaries is shown in the figure below:
To know about the assumptions considered for the study, download the pdf brochure
The prominent players in the antibody production market include GE Healthcare (U.S.), Thermo Fisher Scientific, Inc. (U.S.), Sartorius AG (Germany), Merck KGaA (Germany), Pall Corporation (U.S.), Sigma-Aldrich Corporation (Germany), Eppendorf AG (Germany), Cellab GmbH (Germany), INTEGRA Biosciences AG (Switzerland), and FiberCell Systems Inc. (U.S.).
Target Audience
- Equipment and consumable manufacturing companies
- Equipment and consumable suppliers and distributors
- Research institutes
- Venture capitalists
- Biotechnology and pharmaceutical companies
- Diagnostic laboratories
Antibody Production Market Report Scope
The research report categorizes the global market into the following segments and subsegments
By Process
-
Upstream Processing
-
Bioreactors
- Large-scale bioreactors
- Single-use bioreactors
-
Consumables
- Media
- Buffers and reagents
-
Bioreactors
-
Downstream Processing
- Chromatography Systems
- Chromatography Resins
-
Filtration
- Filtration Systems
- Filtration Consumables and Accessories
By End User
- Pharmaceutical and Biotechnology Companies
- Diagnostic Laboratories
- Research Institutes
By Region
-
North America
- U.S.
- Canada
-
Europe
- Germany
- U.K.
- France
- Italy
- Rest of Europe (RoE)
-
Asia-Pacific
- Japan
- China
- India
- Rest of Asia-Pacific
-
RoW
- Latin America
- Middle East and Africa
Available Customizations
With the given market data, MarketsandMarkets offers customizations as per the company’s specific needs. The following customization options are available for the report:
Product Analysis
- Product matrix, which gives a detailed comparison of the product portfolios of each company
Geographic Analysis
- Further breakdown of the Rest of Asia-Pacific market into South Korea, Australia, New Zealand, and others
- Further breakdown of the Latin American market into Brazil, Argentina, and the Rest of Latin America
Company Information
- Detailed analysis and profiling of additional market players (up to 5)
The market is segmented on the basis of process and end users. By process, the market is segmented into upstream processing, downstream processing, and filtration. The downstream processing segment is expected to account for the largest share of the market, and is projected to grow at the highest CAGR during the forecast period. This large share can be attributed to the requirement of sensitive and sophisticated equipment in the process.
Based on end users, the market is segmented into pharmaceutical and biotechnology companies, research institutes, and diagnostic laboratories. The pharmaceutical and biotechnology companies segment is expected to register the highest CAGR, and is estimated to account for the largest share of the antibody production market. The large number of drug development procedures to meet the shortened industry timelines is driving significant investments by companies towards research and development activities; this is a key market driver for this end-user segment.
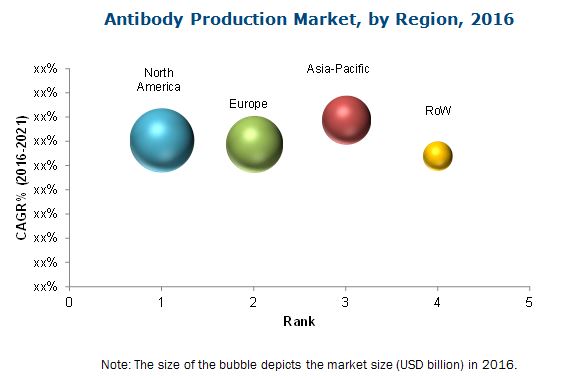
On the basis of regions, the antibody production market is segmented into North America, Europe, Asia-Pacific, and the Rest of the World (RoW). North America is expected to account for the largest share of the market. The rising cancer incidence, government funding for medical research in the U.S., need for quality cancer treatment, and regulatory approvals and authorization for use of mAbs in Canada are key market drivers in this geographic segment.
The Asia-Pacific region is expected to register the highest CAGR during the forecast period.
Source: The Antibody Society, American Society of Laboratory Animal Practitioners (ASLAP), National Cancer Institute (NCI), European Medicines Agency (EMA), Pharmaceutical Research and Manufacturers of America (PhRMA), the National Institutes of Health (NIH), American Medical Association, British Society for Immunology (BSI), the Association of Medical Laboratory Immunologists (AMLI), American Society of Clinical Oncology (ASCO), British Infection Association (BIA), American Association for Cancer Research (AACR), Expert Interviews, and MarketsandMarkets Analysis
The prominent players in the antibody production market include GE Healthcare (U.S.), Thermo Fisher Scientific, Inc. (U.S.), Sartorius AG (Germany), Merck KGaA (Germany), Pall Corporation (U.S.), Sigma-Aldrich Corporation (Germany), Eppendorf AG (Germany), Cellab GmbH (Germany), INTEGRA Biosciences AG (Switzerland), and FiberCell Systems Inc. (U.S.).
Frequently Asked Questions (FAQ):
What is the size of Antibody Production Market ?
The global Antibody Production Market size is growing at a CAGR of 12.3%
What are the major growth factors of Antibody Production Market ?
The increasing prevalence of infectious diseases and rising demand for protein therapeutics are expected to provide growth opportunities for players operating in this market.
Who all are the prominent players of Antibody Production Market ?
The prominent players in the antibody production market include GE Healthcare (U.S.), Thermo Fisher Scientific, Inc. (U.S.), Sartorius AG (Germany), Merck KGaA (Germany), Pall Corporation (U.S.), Sigma-Aldrich Corporation (Germany), Eppendorf AG (Germany), Cellab GmbH (Germany), INTEGRA Biosciences AG (Switzerland), and FiberCell Systems Inc. (U.S.). .
To speak to our analyst for a discussion on the above findings, click Speak to Analyst
 Exclusive indicates content/data unique to MarketsandMarkets and not available with any competitors.
Table of Contents
1 Introduction (Page No. - 21)
1.1 Antibody Production Market: Objectives of the Study
1.2 Market Definition
1.3 Market Scope
1.3.1 Markets Covered
1.3.2 Years Considered for the Study
1.4 Currency
1.5 Limitations
1.6 Stakeholders
2 Research Methodology (Page No. - 24)
2.1 Research Methodology Steps
2.2 Secondary and Primary Research Methodology
2.2.1 Secondary Research
2.2.1.1 Key Data From Secondary Sources
2.2.2 Primary Research
2.2.2.1 Key Industry Insights
2.2.2.2 Key Data From Primary Sources
2.2.2.3 Key Insights From Primary Sources
2.3 Antibody Production Market Size Estimation Methodology
2.4 Market Forecast Methodology
2.5 Market Data Validation and Triangulation
2.6 Assumptions for the Study
3 Executive Summary (Page No. - 33)
3.1 Introduction
3.2 Current and Future Scenario
3.3 Conclusion
4 Premium Insights (Page No. - 37)
4.1 Antibody Production Market Overview
4.2 Market Size, By Process, 2016 vs 2021
4.3 Market Size, By End User, 2016 vs 2021
5 Market Overview (Page No. - 40)
5.1 Introduction of Antibody Production Market
5.2 Market Segmentation
5.3 Market Dynamics
5.3.1 Drivers
5.3.1.1 U.S. Fda Clearance of Therapeutic Mabs
5.3.1.2 Increasing Adoption of Targeted Immunotherapy
5.3.1.3 Increasing R&D Expenditure in Pharmaceutical and Biotechnological Companies
5.3.1.4 Rising Number of Fast Track and Orphan Drug Designations
5.3.2 Restraints
5.3.2.1 Cost Constraints Related to the Adoption of Membrane Filters
5.3.3 Opportunities
5.3.3.1 Rising Demand for Protein Therapeutics
5.3.3.2 Increasing Risk of Infectious Diseases
5.3.3.3 Patent Expiry of Blockbuster Mabs
5.3.4 Challenges
5.3.4.1 High Costs of Primary Antibodies
6 Antibody Production Market, By Process (Page No. - 48)
6.1 Introduction
6.2 Upstream Processing
6.2.1 Bioreactors
6.2.1.1 Large-Scale Bioreactors
6.2.1.2 Single-Use Bioreactors (SUBS)
6.2.2 Consumables
6.2.2.1 Media
6.2.2.2 Reagents and Buffers
6.3 Downstream Processing
6.3.1 Chromatography Instruments
6.3.2 Chromatography Resins
6.3.2.1 Affinity Chromatography Resins
6.4 Ion Exchange (IEX) Chromatography Resins
6.5 Hydrophobic Interaction Chromatography (HIC) Resins
6.6 Multimodal Chromatography Resins
6.7 Filtration
6.7.1 Filtration Systems
6.7.2 Filtration Consumables and Accessories
7 Antibody Production Market, By End User (Page No. - 94)
7.1 Introduction
7.1.1 Pharmaceutical and Biotechnology Companies
7.1.2 Diagnostic Laboratories
7.1.3 Research Institutes
8 Global Antibody Production Market, By Region (Page No. - 99)
8.1 Introduction
8.2 North America
8.2.1 U.S.
8.2.1.1 Rising Cancer Incidence in the U.S.
8.2.1.2 Government Funding for Medical Research
8.2.1.3 Conferences, Symposia, and Seminars on Bioprocessing Technologies
8.2.2 Canada
8.2.2.1 Government Initiatives to Promote Research
8.2.2.2 Need for Quality Cancer Treatment
8.2.2.3 Regulatory Approvals and Authorization for Use of Mabs
8.3 Europe
8.3.1 Germany
8.3.1.1 Increasing Focus on R&D
8.3.1.2 Government Funding
8.3.2 U.K.
8.3.2.1 Flourishing Biotechnology and Biopharmaceutical Industry
8.3.3 France
8.3.3.1 Growing Presence of Chromatography Players in France
8.3.4 Rest of Europe (RoE)
8.3.4.1 Investments and Funding for Life Sciences to Bolster the Antibody Production Market
8.4 Asia-Pacific
8.4.1 Japan
8.4.1.1 Growing Biopharmaceutical Sector and Rise in Geriatric Population
8.4.2 China
8.4.2.1 Increasing Government and Private-Sector Investments in China’s Life Sciences Market
8.4.2.2 Outsourcing of Clinical Research Activities to China
8.4.3 India
8.4.3.1 Increasing Government Initiatives and Growing Pharmaceutical Industry in India
8.4.3.2 Development of Bioclusters to Boost India’s Biotechnology Industry
8.4.4 Rest of Asia-Pacific
8.4.4.1 Funding From the Australian Government for Scientific Research and Innovation
8.4.4.2 Infrastructural Development in Vietnam
8.4.4.3 Rising Pharmaceutical and Biotechnology R&D Activities in Korea
8.4.4.4 Government Support for Strong Academic and Commercial R&D Activities in Taiwan
8.5 Rest of the World
8.5.1 Latin America
8.5.1.1 Pharmaceutical, Biotechnology, and Research Industries in Brazil to Bolster the Market
8.5.1.2 Mexico, the Production Hub for Global Pharmaceutical Companies
8.5.2 Middle East and Africa (MEA)
8.5.2.1 Favorable Business Environment for Pharmaceutical and Biotechnology Industries in Saudi Arabia and Uae
8.5.2.2 Increasing Focus on Africa By Pharmaceutical Companies
9 Competitive Landscape (Page No. - 162)
9.1 Antibody Production Market: Overview
9.2 Strategic Overview
9.3 Competitive Situation and Trends
9.3.1 New Product Launches
9.3.2 Expansions
9.3.3 Agreements, Alliances, Partnerships, and Collaborations
9.3.4 Mergers and Acquisitions
9.3.5 Other Strategies
10 Company Profiles (Page No. - 170)
(Company at A Glance, Business Overview, Products Offered, Key Strategy, Recent Developments, SWOT Analysis & MnM View)*
10.1 Introduction
10.2 GE Healthcare (A SUBSidiary of General Electric Company)
10.3 Merck KGAA
10.4 Thermo Fisher Scientific, Inc.
10.5 Sartorius AG
10.6 Pall Corporation (Acquired By Danaher Corporation)
10.7 Sigma-Aldrich Corporation (Acquired By Merck KGAA)
10.8 Eppendorf AG
10.9 Cellab GmbH
10.10 Integra Biosciences AG
10.11 Fibercell Systems Inc.
*Details on Company at A Glance, Recent Financials, Products Offered, Strategies & Insights, & Recent Developments Might Not Be Captured in Case of Unlisted Companies.
11 Appendix (Page No. - 198)
11.1 Insights of Industry Experts
11.2 Discussion Guide
11.3 Other Developments (2013–2016)
11.3.1 GE Healthcare
11.3.2 Merck KGAA
11.3.3 Thermo Fisher Scientific, Inc.
11.3.4 Sartorius AG
11.3.5 Sigma-Aldrich Corporation (Acquired By Merck KGAA)
11.3.6 Eppendorf AG
11.3.7 Integra Biosciences Group
11.4 Knowledge Store: Marketsandmarkets’ SUBScription Portal
11.5 Introducing RT: Real-Time Market Intelligence
11.6 Available Customizations
11.7 Related Reports
List of Tables (221 Tables)
Table 1 Increasing Life Science R&D Expenditure is Propelling the Growth of the Antibody Production Market
Table 2 Cost Constraints Related to the Adoption of Membrane Filters to Restrain the Market
Table 3 Patent Expiry of Blockbuster Mabs Offers Huge Potential for the Market
Table 4 High Costs of Primary Antibodies Posing as A Challenge for the Growth of the Market
Table 5 Antibody Production Market Size, By Process, 2014–2021 (USD Million)
Table 6 Upstream Processing Market Size, By Product, 2014–2021 (USD Million)
Table 7 Upstream Processing Market Size, By Region, 2014–2021 (USD Million)
Table 8 North America: Upstream Processing Market Size, By Country, 2014–2021 (USD Million)
Table 9 Europe: Upstream Processing Market Size, By Country, 2014–2021 (USD Million)
Table 10 Asia-Pacific: Upstream Processing Market Size, By Country, 2014–2021 (USD Million)
Table 11 RoW: Upstream Processing Market Size, By Region, 2014–2021 (USD Million)
Table 12 Bioreactors Market Size, By Type, 2014–2021 (USD Million)
Table 13 Bioreactors Market Size, By Region, 2014–2021 (USD Million)
Table 14 North America: Bioreactors Market Size, By Country, 2014–2021 (USD Million)
Table 15 Europe: Bioreactors Market Size, By Country, 2014–2021 (USD Million)
Table 16 Asia-Pacific: Bioreactors Market Size, By Country, 2014–2021 (USD Million)
Table 17 RoW: Bioreactors Market Size, By Region, 2014–2021 (USD Million)
Table 18 Large-Scale Bioreactors Market Size, By Region, 2014–2021 (USD Million)
Table 19 North America: Large-Scale Bioreactors Market Size, By Country, 2014–2021 (USD Million)
Table 20 Europe: Large-Scale Bioreactors Market Size, By Country, 2014–2021 (USD Million)
Table 21 Asia-Pacific: Large-Scale Bioreactors Market Size, By Country, 2014–2021 (USD Million)
Table 22 RoW: Large-Scale Bioreactors Market Size, By Region, 2014–2021 (USD Million)
Table 23 Single-Use Bioreactors Market Size, By Region, 2014–2021 (USD Million)
Table 24 North America: Single-Use Bioreactors Market Size, By Country, 2014–2021 (USD Million)
Table 25 Europe: Single-Use Bioreactors Market Size, By Country, 2014–2021 (USD Million)
Table 26 Asia-Pacific: Single-Use Bioreactors Market Size, By Country, 2014–2021 (USD Million)
Table 27 RoW: Single-Use Bioreactors Market Size, By Region, 2014–2021 (USD Million)
Table 28 Consumables Market Size, By Type, 2014–2021 (USD Million)
Table 29 Consumables Market Size, By Region, 2014–2021 (USD Million)
Table 30 North America: Consumables Market Size, By Country, 2014–2021 (USD Million)
Table 31 Europe: Consumables Market Size, By Country, 2014–2021 (USD Million)
Table 32 Asia-Pacific: Consumables Market Size, By Country, 2014–2021 (USD Million)
Table 33 RoW: Consumables Market Size, By Region, 2014–2021 (USD Million)
Table 34 Media Market Size, By Region, 2014–2021 (USD Million)
Table 35 North America: Media Market Size, By Country, 2014–2021 (USD Million)
Table 36 Europe: Media Market Size, By Country, 2014–2021 (USD Million)
Table 37 Asia-Pacific: Media Market Size, By Country, 2014–2021 (USD Million)
Table 38 RoW: Media Market Size, By Region, 2014–2021 (USD Million)
Table 39 Reagents and Buffers Market Size, By Region, 2014–2021 (USD Million)
Table 40 North America: Reagents and Buffers Market Size, By Country, 2014–2021 (USD Million)
Table 41 Europe: Reagents and Buffers Market Size, By Country, 2014–2021 (USD Million)
Table 42 Asia-Pacific: Reagents and Buffers Market Size, By Country, 2014–2021 (USD Million)
Table 43 RoW: Reagents and Buffers Market Size, By Region, 2014–2021 (USD Million)
Table 44 Downstream Processing Market Size, By Product, 2014–2021 (USD Million)
Table 45 Downstream Processing Market Size, By Region, 2014–2021 (USD Million)
Table 46 North America: Downstream Processing Market Size, By Country, 2014–2021 (USD Million)
Table 47 Europe: Downstream Processing Market Size, By Country, 2014–2021 (USD Million)
Table 48 Asia-Pacific: Downstream Processing Market Size, By Country, 2014–2021 (USD Million)
Table 49 RoW: Downstream Processing Market Size, By Region, 2014–2021 (USD Million)
Table 50 Chromatography Instruments Market Size, By Region, 2014–2021 (USD Million)
Table 51 North America: Chromatography Instruments Market Size, By Country, 2014–2021 (USD Million)
Table 52 Europe: Chromatography Instruments Market Size, By Country, 2014–2021 (USD Million)
Table 53 Asia-Pacific: Chromatography Instruments Market Size, By Country, 2014–2021 (USD Million)
Table 54 RoW: Chromatography Instruments Market Size, By Region, 2014–2021 (USD Million)
Table 55 Chromatography Resins Market Size, By Technique, 2014–2021 (USD Million)
Table 56 Chromatography Resins Market Size, By Region, 2014–2021 (USD Million)
Table 57 North America: Chromatography Resins Market Size, By Country, 2014–2021 (USD Million)
Table 58 Europe: Chromatography Resins Market Size, By Country, 2014–2021 (USD Million)
Table 59 Asia-Pacific: Chromatography Resins Market Size, By Country, 2014–2021 (USD Million)
Table 60 RoW: Chromatography Resins Market Size, By Region, 2014–2021 (USD Million)
Table 61 Affinity Chromatography Resins Market Size, By Region, 2014–2021 (USD Million)
Table 62 North America: Affinity Chromatography Resins Market Size, By Country, 2014–2021 (USD Million)
Table 63 Europe: Affinity Chromatography Resins Market Size, By Country, 2014–2021 (USD Million)
Table 64 Asia-Pacific: Affinity Chromatography Resins Market Size, By Country, 2014–2021 (USD Million)
Table 65 RoW: Affinity Chromatography Resins Market Size, By Region, 2014–2021 (USD Million)
Table 66 IEX Chromatography Resins Market Size, By Region, 2014–2021 (USD Million)
Table 67 North America: IEX Chromatography Resins Market Size, By Country, 2014–2021 (USD Million)
Table 68 Europe: IEX Chromatography Resins Market Size, By Country, 2014–2021 (USD Million)
Table 69 Asia-Pacific: IEX Chromatography Resins Market Size, By Country, 2014–2021 (USD Million)
Table 70 RoW: IEX Chromatography Resins Market Size, By Region, 2014–2021 (USD Million)
Table 71 HIC Chromatography Resins Market Size, By Region, 2014–2021 (USD Million)
Table 72 North America: HIC Resins Market Size, By Country, 2014–2021 (USD Million)
Table 73 Europe: HIC Resins Market Size, By Country, 2014–2021 (USD Million)
Table 74 Asia-Pacific: HIC Resins Market Size, By Country, 2014–2021 (USD Million)
Table 75 RoW: HIC Resins Market Size, By Region, 2014–2021 (USD Million)
Table 76 Multimodal Chromatography Resins Market Size, By Region, 2014–2021 (USD Million)
Table 77 North America: Multimodal Chromatography Resins Market Size, By Country, 2014–2021 (USD Million)
Table 78 Europe: Multimodal Chromatography Resins Market Size, By Country, 2014–2021 (USD Million)
Table 79 Asia-Pacific: Multimodal Chromatography Resins Market Size, By Country, 2014–2021 (USD Million)
Table 80 RoW: Multimodal Chromatography Resins Market Size, By Region, 2014–2021 (USD Million)
Table 81 Filtration Market Size, By Type, 2014–2021 (USD Million)
Table 82 Filtration Market Size, By Region, 2014–2021 (USD Million)
Table 83 North America: Filtration Market Size, By Country, 2014–2021 (USD Million)
Table 84 Europe: Filtration Market Size, By Country, 2014–2021 (USD Million)
Table 85 Asia-Pacific: Filtration Market Size, By Country, 2014–2021 (USD Million)
Table 86 RoW: Filtration Market Size, By Region, 2014–2021 (USD Million)
Table 87 Filtration Systems Market Size, By Region, 2014–2021 (USD Million)
Table 88 North America: Filtration Systems Market Size, By Country, 2014–2021 (USD Million)
Table 89 Europe: Filtration Systems Market Size, By Country, 2014–2021 (USD Million)
Table 90 Asia-Pacific: Filtration Systems Market Size, By Country, 2014–2021 (USD Million)
Table 91 RoW: Filtration Systems Market Size, By Region, 2014–2021 (USD Million)
Table 92 Filtration Consumables and Accessories Market Size, By Region, 2014–2021 (USD Million)
Table 93 North America: Filtration Consumables and Accessories Market Size, By Country, 2014–2021 (USD Million)
Table 94 Europe: Filtration Consumables and Accessories Market Size, By Country, 2014–2021 (USD Million)
Table 95 Asia-Pacific: Filtration Consumables and Accessories Market Size, By Country, 2014–2021 (USD Million)
Table 96 RoW: Filtration Consumables and Accessories Market Size, By Region, 2014–2021 (USD Million)
Table 97 Antibody Production Market Size, By End User, 2014-2021 (USD Million)
Table 98 Market Size for Pharmaceutical and Biotechnology Companies, By Region, 2014–2021 (USD Million)
Table 99 Market Size for Diagnostic Laboratories, By Region, 2014–2021 (USD Million)
Table 100 Market Size for Research Institutes, By Region, 2014–2021 (USD Million)
Table 101 Market Size, By Region, 2014–2021 (USD Million)
Table 102 North America: Antibody Production Market Size, By Country, 2014–2021 (USD Million)
Table 103 North America: Market Size, By Process, 2014–2021 (USD Million)
Table 104 North America: Upstream Processing Market Size, By Product, 2014–2021 (USD Million)
Table 105 North America: Bioreactors Market Size, By Type, 2014–2021 (USD Million)
Table 106 North America: Consumables Market Size, By Type, 2014–2021 (USD Million)
Table 107 North America: Downstream Processing Market Size, By Product, 2014–2021 (USD Million)
Table 108 North America: Chromatography Resins Market Size, By Technique, 2014–2021 (USD Million)
Table 109 North America: Filtration Market Size, By Product, 2014–2021 (USD Million)
Table 110 U.S.: Antibody Production Market Size, By Process, 2014–2021 (USD Million)
Table 111 U.S.: Upstream Processing Market Size, By Product, 2014–2021 (USD Million)
Table 112 U.S.: Bioreactors Market Size, By Type, 2014–2021 (USD Million)
Table 113 U.S.: Consumables Market Size, By Type, 2014–2021 (USD Million)
Table 114 U.S.: Downstream Processing Market Size, By Product, 2014–2021 (USD Million)
Table 115 U.S.: Chromatography Resins Market Size, By Technique, 2014–2021 (USD Million)
Table 116 U.S.: Filtration Market Size, By Product, 2014–2021 (USD Million)
Table 117 Canada: Antibody Production Market Size, By Process, 2014–2021 (USD Million)
Table 118 Canada: Upstream Processing Market Size, By Product, 2014–2021 (USD Million)
Table 119 Canada: Bioreactors Market Size, By Type, 2014–2021 (USD Million)
Table 120 Canada: Consumables Market Size, By Type, 2014–2021 (USD Million)
Table 121 Canada: Downstream Processing Market Size, By Product, 2014–2021 (USD Million)
Table 122 Canada: Chromatography Resins Market Size, By Technique, 2014–2021 (USD Million)
Table 123 Canada: Filtration Market Size, By Product, 2014–2021 (USD Million)
Table 124 Europe: Antibody Production Market Size, By Country, 2014–2021 (USD Million)
Table 125 Europe: Market Size, By Process, 2014–2021 (USD Million)
Table 126 Europe: Upstream Processing Market Size, By Product, 2014–2021 (USD Million)
Table 127 Europe: Bioreactors Market Size, By Type, 2014–2021 (USD Million)
Table 128 Europe: Consumables Market Size, By Type, 2014–2021 (USD Million)
Table 129 Europe: Downstream Processing Market Size, By Product, 2014–2021 (USD Million)
Table 130 Europe: Chromatography Resins Market Size, By Technique, 2014–2021 (USD Million)
Table 131 Europe: Filtration Market Size, By Product, 2014–2021 (USD Million)
Table 132 Germany: Antibody Production Market Size, By Process, 2014–2021 (USD Million)
Table 133 Germany: Upstream Processing Market Size, By Product, 2014–2021 (USD Million)
Table 134 Germany: Bioreactors Market Size, By Type, 2014–2021 (USD Million)
Table 135 Germany: Consumables Market Size, By Type, 2014–2021 (USD Million)
Table 136 Germany: Downstream Processing Market Size, By Product, 2014–2021 (USD Million)
Table 137 Germany: Chromatography Resins Market Size, By Technique, 2014–2021 (USD Million)
Table 138 Germany: Filtration Market Size, By Product, 2014–2021 (USD Million)
Table 139 U.K.: Antibody Production Market Size, By Process, 2014–2021 (USD Million)
Table 140 U.K.: Upstream Processing Market Size, By Product, 2014–2021 (USD Million)
Table 141 U.K.: Bioreactors Market Size, By Type, 2014–2021 (USD Million)
Table 142 U.K.: Consumables Market Size, By Type, 2014–2021 (USD Million)
Table 143 U.K.: Downstream Processing Market Size, By Product, 2014–2021 (USD Million)
Table 144 U.K.: Chromatography Resins Market Size, By Technique, 2014–2021 (USD Million)
Table 145 U.K.: Filtration Market Size, By Product, 2014–2021 (USD Million)
Table 146 France: Antibody Production Market Size, By Process, 2014–2021 (USD Million)
Table 147 France: Upstream Processing Market Size, By Product, 2014–2021 (USD Million)
Table 148 France: Bioreactors Market Size, By Type, 2014–2021 (USD Million)
Table 149 France: Consumables Market Size, By Type, 2014–2021 (USD Million)
Table 150 France: Downstream Processing Market Size, By Product, 2014–2021 (USD Million)
Table 151 France: Chromatography Resins Market Size, By Technique, 2014–2021 (USD Million)
Table 152 France: Filtration Market Size, By Product, 2014–2021 (USD Million)
Table 153 RoE: Antibody Production Market Size, By Process, 2014–2021 (USD Million)
Table 154 RoE: Upstream Processing Market Size, By Product, 2014–2021 (USD Million)
Table 155 RoE: Bioreactors Market Size, By Type, 2014–2021 (USD Million)
Table 156 RoE: Consumables Market Size, By Type, 2014–2021 (USD Million)
Table 157 RoE: Downstream Processing Market Size, By Product, 2014–2021 (USD Million)
Table 158 RoE: Chromatography Resins Market Size, By Technique, 2014–2021 (USD Million)
Table 159 RoE: Filtration Market Size, By Product, 2014–2021 (USD Million)
Table 160 Asia-Pacific: Antibody Production Market Size, By Country, 2014–2021 (USD Million)
Table 161 Asia-Pacific: Market Size, By Process, 2014–2021 (USD Million)
Table 162 Asia-Pacific: Upstream Processing Market Size, By Product, 2014–2021 (USD Million)
Table 163 Asia-Pacific: Bioreactors Market Size, By Type, 2014–2021 (USD Million)
Table 164 Asia-Pacific: Consumables Market Size, By Type, 2014–2021 (USD Million)
Table 165 Asia-Pacific: Downstream Processing Market Size, By Product, 2014–2021 (USD Million)
Table 166 Asia-Pacific: Chromatography Resins Market Size, By Technique, 2014–2021 (USD Million)
Table 167 Asia-Pacific: Filtration Market Size, By Product, 2014–2021 (USD Million)
Table 168 Japan: Antibody Production Market Size, By Process, 2014–2021 (USD Million)
Table 169 Japan: Upstream Processing Market Size, By Product, 2014–2021 (USD Million)
Table 170 Japan: Bioreactors Market Size, By Type, 2014–2021 (USD Million)
Table 171 Japan: Consumables Market Size, By Type, 2014–2021 (USD Million)
Table 172 Japan: Downstream Processing Market Size, By Product, 2014–2021 (USD Million)
Table 173 Japan: Chromatography Resins Market Size, By Technique, 2014–2021 (USD Million)
Table 174 Japan: Filtration Market Size, By Product, 2014–2021 (USD Million)
Table 175 China: Antibody Production Market Size, By Process, 2014–2021 (USD Million)
Table 176 China: Upstream Processing Market Size, By Product, 2014–2021 (USD Million)
Table 177 China: Bioreactors Market Size, By Type, 2014–2021 (USD Million)
Table 178 China: Consumables Market Size, By Type, 2014–2021 (USD Million)
Table 179 China: Downstream Processing Market Size, By Product, 2014–2021 (USD Million)
Table 180 China: Chromatography Resins Market Size, By Technique, 2014–2021 (USD Million)
Table 181 China: Filtration Market Size, By Product, 2014–2021 (USD Million)
Table 182 India: Antibody Production Market Size, By Process, 2014–2021 (USD Million)
Table 183 India: Upstream Processing Market Size, By Product, 2014–2021 (USD Million)
Table 184 India: Bioreactors Market Size, By Type, 2014–2021 (USD Million)
Table 185 India: Consumables Market Size, By Type, 2014–2021 (USD Million)
Table 186 India: Downstream Processing Market Size, By Product, 2014–2021 (USD Million)
Table 187 India: Chromatography Resins Market Size, By Technique, 2014–2021 (USD Million)
Table 188 India: Filtration Market Size, By Product, 2014–2021 (USD Million)
Table 189 RoAPAC: Antibody Production Market Size, By Process, 2014–2021 (USD Million)
Table 190 RoAPAC: Upstream Processing Market Size, By Product, 2014–2021 (USD Million)
Table 191 RoAPAC: Bioreactors Market Size, By Type, 2014–2021 (USD Million)
Table 192 RoAPAC: Consumables Market Size, By Type, 2014–2021 (USD Million)
Table 193 RoAPAC: Downstream Processing Market Size, By Product, 2014–2021 (USD Million)
Table 194 RoAPAC: Chromatography Resins Market Size, By Technique, 2014–2021 (USD Million)
Table 195 RoAPAC: Filtration Market Size, By Product, 2014–2021 (USD Million)
Table 196 RoW: Antibody Production Market Size, By Region, 2014–2021 (USD Million)
Table 197 RoW: Market Size, By Process, 2014–2021 (USD Million)
Table 198 RoW: Upstream Processing Market Size, By Product, 2014–2021 (USD Million)
Table 199 RoW: Bioreactors Market Size, By Type, 2014–2021 (USD Million)
Table 200 RoW: Consumables Market Size, By Type, 2014–2021 (USD Million)
Table 201 RoW: Downstream Processing Market Size, By Product, 2014–2021 (USD Million)
Table 202 RoW: Chromatography Resins Market Size, By Technique, 2014–2021 (USD Million)
Table 203 RoW: Filtration Market Size, By Product, 2014–2021 (USD Million)
Table 204 Latin America: Antibody Production Market Size, By Process, 2014–2021 (USD Million)
Table 205 Latin America: Upstream Processing Market Size, By Product, 2014–2021 (USD Million)
Table 206 Latin America: Bioreactors Market Size, By Type, 2014–2021 (USD Million)
Table 207 Latin America: Consumables Market Size, By Type, 2014–2021 (USD Million)
Table 208 Latin America: Downstream Processing Market Size, By Product, 2014–2021 (USD Million)
Table 209 Latin America: Chromatography Resins Market Size, By Technique, 2014–2021 (USD Million)
Table 210 Latin America: Filtration Market Size, By Product, 2014–2021 (USD Million)
Table 211 MEA: Antibody Production Market Size, By Process, 2014–2021 (USD Million)
Table 212 MEA: Upstream Processing Market Size, By Product, 2014–2021 (USD Million)
Table 213 MEA: Bioreactors Market Size, By Type, 2014–2021 (USD Million)
Table 214 MEA: Consumables Market Size, By Type, 2014–2021 (USD Million)
Table 215 MEA: Downstream Processing Market Size, By Product, 2014–2021 (USD Million)
Table 216 MEA: Chromatography Resins Market Size, By Technique, 2014–2021 (USD Million)
Table 217 MEA: Filtration Market Size, By Product, 2014–2021 (USD Million)
Table 218 New Product Launches (2013–2016)
Table 219 Expansions (2013–2016)
Table 220 Agreements, Alliances, Partnerships, and Collaborations (2013–2016)
Table 221 Other Strategies (2013–2016)
List of Figures (38 Figures)
Figure 1 Global Antibody Production Market Segmentation
Figure 2 Global Market: Research Methodology Steps
Figure 3 Breakdown of Primary Interviews: By Company Type, Designation, and Region
Figure 4 Market Size Estimation Methodology: Bottom-Up Approach
Figure 5 Market Size Estimation Methodology: Top-Down Approach
Figure 6 Research Design of Antibody Production Market
Figure 7 Data Triangulation Methodology
Figure 8 Global Market Size, By Process (2016 vs 2021)
Figure 9 Global Market Size, By End User, 2016 vs 2021
Figure 10 Asia-Pacific Market to Witness the Highest Growth Rate During the Forecast Period
Figure 11 North America to Command the Largest Share of the Antibody Production Market in 2016
Figure 12 Downstream Processing Segment to Witness the Highest Growth Rate From 2016 to 2021
Figure 13 Pharmaceutical & Biotechnology Companies Segment Will Continue to Dominate the Market in 2021
Figure 14 Antibody Production Market Segmentation
Figure 15 Drivers, Restraints, Opportunities, & Challenges
Figure 16 Approvals of Therapeutic Monoclonal Antibodies in the U.S. (1995-2015)
Figure 17 Downstream Processing to Command the Largest Share of the Antibody Production Market, By Process
Figure 18 Pharmaceutical and Biotechnology Companies End-User Segment to Grow at the Highest Rate During the Forecast Period
Figure 19 Antibody Production Market, By Region, 2016
Figure 20 North America: Market Snapshot
Figure 21 Europe: Market Snapshot
Figure 22 Asia-Pacific: Market Snapshot
Figure 23 RoW: Market Snapshot
Figure 24 Leading Market Players Adopted New Product Launches as Their Key Growth Strategy From 2013 to 2016
Figure 25 Battle for Antibody Production Market Share: New Product Launches Was the Key Strategy Adopted By Market Players (2013–2016)
Figure 26 New Product Launches, By Company (2013–2016)
Figure 27 Expansions, By Company (2013–2016)
Figure 28 Agreements, Alliances, Partnerships, and Collaborations (2013–2016)
Figure 29 Merger and Acquisitions, By Company (2013–2016)
Figure 30 Other Strategies, By Company (2013–2016)
Figure 31 Geographic Revenue Mix of the Prominent Players (2015)
Figure 32 GE Healthcare: Company Snapshot
Figure 33 Merck KGAA: Company Snapshot
Figure 34 Thermo Fisher Scientific, Inc.: Company Snapshot
Figure 35 Sartorius AG: Company Snapshot
Figure 36 Pall Corporation: Company Snapshot
Figure 37 Sigma-Aldrich Corporation: Company Snapshot
Figure 38 Eppendorf AG: Company Snapshot

 Generating Response ...


Growth opportunities and latent adjacency in Antibody Production Market