Augmented Analytics Market by Software, Service (Training and Consulting, Deployment and Integration, and Support and Maintenance), Organization Size (SMEs and Large Enterprises), Deployment Type, Vertical, and Region - Global Forecast to 2023


[121 Pages Report] The global augmented analytics market size is expected to grow from USD 4.8 billion in 2018 to USD 18.4 billion by 2023, at a Compound Annual Growth Rate (CAGR) of 30.6% during the forecast period. Major growth drivers for the market include increasing volume of complex data and growing adoption of advanced business analytics tools. However, there are restraining factors that may slow down the growth of the augmented analytics market, such as apprehension about technologies replacing humans. Apart from these restraints, the vendors are expected to face various challenges in the near future, such as lack of skilled workforce and difficulty in managing data quality and safety, huge data volumes and a wide variety of data can increase the likelihood of poor quality data, which can negatively impact businesses and their revenues, and stall operations.
Augmented analytics is the latest disruption seen in the world of BI. This technology uses ML and NLG to automate insights so that business users can quickly gather, collate, prepare, and analyze data to extract on-demand intelligence whenever they need it during their daily work. Currently, augmented analytics automates tedious data preparation tasks, such as data cleaning, data labeling, and data collection, and serve as a great complement to existing data scientists or analysts. Augmented analytics holds the capability to revolutionize business operations, and has seen adoption in various verticals, as organizations look toward becoming data-driven and agile in nature.

To know about the assumptions considered for the study, Request for Free Sample Report
COVID-19 impact
The augmented analytics market is expected to gain growth opportunities during the COVID-19 pandemic era. As several organizations face the challenges posed by the COVID-19 pandemic, the need to offer quick and mass communication with updates and guidelines has gained momentum. With business leaders demanding to act rapidly, the crisis provided a chance for analytics and AI-based techniques to augment decision-making. Augmented Analytics uses AI algorithms to automate data preparation for analysis by labeling and structuring it. AI also facilitates analytics by streamlining the insight discovery process. It can highlight notable trends and insights without a particular user query.
Market Dynamics
Driver: Increasing volume of complex business data
In the recent years, organizations have started inculcating various technology facets in their business processes. This has led to the creation of vast amounts of data. This data contains significant information, but, most of the times, it is large in volume and unstructured. Storing and gaining knowledge from the data is a matter of concern for most organizations. To analyze the data, there is a growing need for augmented analytics technologies, such as ML and Natural Language Processing (NLP). Augmented analytics makes it possible to analyze structured, semi-structured, and unstructured data sets available within organizations. The variety and volume of data produced are expected to considerably increase in the years to come, due to the evolution of digital technologies across business functions. This increasing volume of complex data is expected to drive the growth of the augmented analytics market.
Opportunity: Increase in adoption of artificial intelligence, machine learning, and natural language processing technologies
The generation of a massive amount of data and the need to analyze it in real-time have compelled organizations to adopt new technologies, such as AI, ML, and NLP. These technologies have eased the whole process of gathering insights from data. Usually, data analysis was done through graphs and charts. To an untrained eye, the data analysis was not user-friendly, and there was a risk of misinterpretation and poor decision-making. The NLP technology overcomes this issue. The strategic streamlining and harnessing of these technologies can comprehend huge datasets to generate valuable insights that eventually help develop customized and impactful solutions. There has been a widescale adoption of AI, ML, and NLP, as these technologies solve problems and build solutions. Augmented analytics is one of the areas wherein these technologies are being used.
All organizations, despite their size, produce some sort of data. The data may be large in volume and highly unstructured. Its analysis can help organizations in gathering insights into their business functions for addressing their various business problems. Data analysis can be an expensive affair. Earlier, SMEs did not have access to modern BI tools, which large enterprises used. However, the recent advancements in cloud technologies have helped the SMEs in accessing various powerful tools that help them in their business operations. Augmented analytics makes the use of AI, ML, and NLP technologies to gather insights and take business decisions. This technology partially eliminates the need for a large number of data science professionals, due to which the adoption of augmented analytics solutions and services has increased among the SMEs.
Challenge: Lack of skilled workforce
To gain business insights from data, organizations use advanced analytics techniques, which are complex in nature and require in-depth analytical knowledge. Augmented analytics is very complex, due to the architecture that is being used for the technology. To use augmented analytics, a person requires technical skills, analysis, and critical thinking. Many end users do not have resources, and the required analytical skills and knowledge. The lack of understanding of augmented analytics is also a key challenge. Furthermore, business knowledge is needed in conjunction with appropriate training for building a data-driven and decision-making culture. Thus, the lack of skilled workforce, which is needed to use complex augmented analytics solutions, is one of the biggest challenges faced by many business end users.
Difficulty in managing data quality and safety, huge data volumes and a wide variety of data can increase the likelihood of poor quality data, which can negatively impact businesses and their revenues, and stall operations. Data quality is an essential factor that determines data reliability for gaining insights using augmented analytics. There is a rising concern among businesses to share their critical business data on cloud. The sharing of critical business data exposes systems to unauthorized access, which can sabotage systems or cause system outages. As enterprises are very sensitive when it comes to data storage and access, they are afraid to transfer their data on cloud. Hence, it is necessary to monitor the data storage process continuously to minimize security risks.
The software segment is expected to account for the largest market share during the forecast period Artificial intelligence (AI) and Machine Learning (ML) technologies are being increasingly integrated into analytics platforms and are expected to drive the augmented analytics market space over the future. The analytics market space is experiencing an increasing transformation from traditional manual process of generating insights into an advanced AI, and ML enabled BI tools. Augmented analytics solutions are composed of such modern BI tools that automate the data insights using ML and Natural-Language Generation (NLG). Augmented analytics provides functionalities, such as preparing data, deciphering data patterns and building models, and distributing and operationalizing the data findings. Owing to the increasing trend of organizations on building models and integrating data for simplifying and automating their tasks, augmented analytics proves to be an effective solution. These solutions save both time and resources used for getting relevant business insights from the data.
North America to account for largest market size during the forecast period
North America is expected to hold the largest market size during the forecast period in the augmented analytics market, owing to the early adoption and innovative initiatives for advanced analytics solutions and practices, such as Natural Language Processing (NLP), ML, and smart data preparation and discovery. The factors driving the growth of augmented analytics software and services are state-of-the-art infrastructure, high funding opportunities, widespread customer base across several industries, conducive environment for innovation, and availability of highly-skilled workforce

To know about the assumptions considered for the study, download the pdf brochure
Key Market Players
Salesforce (US), SAP (Germany), IBM (US), Microsoft (US), Oracle (US), Tableau (US), MicroStrategy (US), SAS (US), Qlik (US), TIBCO Software (US), Sisense (US), Information Builders (US), Yellowfin (Australia), ThoughtSpot (US), and Domo (US).
Scope of the Report
|
Report Metric |
Details |
|
Market size available for years |
2016�2023 |
|
Base year considered |
2017 |
|
Forecast period |
2018�2023 |
|
Forecast unit |
Value (USD) |
|
Segments covered |
Components, Services, Organization Size, Deployment Type, Verticals, and Region |
|
Geographies covered |
North America, Europe, Asia Pacific (APAC), Middle East and Africa (MEA), and Latin America |
|
Companies covered |
Salesforce (US), SAP (Germany), IBM (US), Microsoft (US), Oracle (US), Tableau (US), MicroStrategy (US), SAS (US), Qlik (US), TIBCO Software (US), Sisense (US), Information Builders (US), Yellowfin (Australia), ThoughtSpot (US), and Domo (US) |
The research report categorizes the augmented analytics market to forecast the revenues and analyze the trends in each of the following subsegments:
Augmented Analytics Market By Component
- Software
- Services
Augmented Analytics Market By Services
- Training and Consulting
- Deployment and Integration
- Support and Maintenance
Augmented Analytics Market By Organization Size
- Large enterprises
- Small and Medium-sized Enterprises (SMEs)
Augmented Analytics Market By Deployment Type
- On-Premises
- Cloud
Augmented Analytics Market By Vertical
- Banking, Financial Services, and Insurance (BFSI)
- Telecom and IT
- Retail and Consumer Goods
- Healthcare and Life sciences
- Manufacturing
- Governments and Defense
- Energy and Utilities
- Transportation and Logistics
- Media and Entertainment
- Others (Travel and hospitality, and research and academia)
Augmented Analytics Market By Region
- North America
- US
- Canada
- Europe
- UK
- Germany
- France
- Rest of Europe
- Asia Pacific (APAC)
- Australia and New Zealand (ANZ)
- Japan
- China
- Rest of APAC
- Latin America
- Brazil
- Mexico
- Rest of Latin America
- Middle East and Africa (MEA)
- Kingdom of Saudi Arabia (KSA)
- South Africa
- United Arab Emirates (UAE)
- Rest of MEA
Recent Developments:
- In December 2018, Microsoft announced integration between Power BI dataflows and Azure Data Lake Storage Gen2. The integration enabled organizations to unify data across Power BI and Azure Data services. With this integration, the business analysts and BI professionals working in Power BI can easily collaborate with the data analysts, engineers, and scientists working in Azure.
- In October 2018, IBM partnered with Motio to accelerate the upgrades to Cognos Analytics 11.1. The Motio software is designed to enhance the development and administration processes for Cognos. This software would also help in the upgradation process.
- In September 2018, SAP added new ML feature to its SAP Analytics Cloud solution. This enhancement helped businesses uncover correlations in their data and assisted users in faster and better decision-making.
- In September 2018, IBM launched IBM Cognos Analytics 11.1 with advanced features and functionalities for augmented intelligence, ML, pattern detection, and data science. The advanced features included AI conversational assistant, advanced analytics, AI-recommended visualizations and insights, and user-centric data prep and modeling.
- In May 2018, SAP opened a cloud data center in Saudi Arabia. With the aid of this data center, SAP would be offering its cloud-based services to the Saudi government and enterprise customers in the Middle East.
Frequently Asked Questions (FAQ):
What is Augmented analytics?
Augmented analytics solutions are a sub-part of modern Business Intelligence (BI) tools that automate insights using Machine Learning (ML) and Natural Language Generation (NLG). It uses ML to automate data preparation, insight discovery, and insight sharing. These tools provide data scientists with the most relevant insights, without any biases. This advantage reduces the time required by data scientists in exploring data and enables them to focus on specialized problems.
Which countries are considered in the European region?
The report comprises the countries such as the UK, Germany, and France in the European region.
Which type of deployment modal is covered under the scope of the augmented analytics market?
The deployment mode in the market includes on-premises and cloud. Deployment refers to the setting-up of an IT infrastructure with hardware, operating systems, and applications that are required to manage the IT ecosystem. The deployment mode chosen by an organization depends on the organization�s financial stability and IT infrastructure.
Which are the verticals covered in the augmented analytics market?
The augmented analytics market is segmented into the following verticals: BFSI, telecom and IT, retail and consumer goods, healthcare and life sciences, manufacturing, government and defense, energy and utilities, transportation and logistics, media and entertainment, and others (travel and hospitality, and research and academia).
Who are the major vendors in the augmented analytics market?
Some of the major vendors in the augmented analytics market are Salesforce (US), SAP (Germany), IBM (US), Microsoft (US), Oracle (US), Tableau (US), MicroStrategy (US), SAS (US), Qlik (US), TIBCO Software (US), Sisense (US), Information Builders (US), Yellowfin (Australia), ThoughtSpot (US), and Domo (US). .
To speak to our analyst for a discussion on the above findings, click Speak to Analyst
 Exclusive indicates content/data unique to MarketsandMarkets and not available with any competitors.
Table of Contents
1 Introduction (Page No. - 15)
1.1 Objectives of the Study
1.2 Market Definition
1.3 Market Scope
1.3.1 Market Segmentation
1.4 Years Considered for the Study
1.5 Currency Considered
1.6 Stakeholders
2 Research Methodology (Page No. - 18)
2.1 Research Data
2.1.1 Secondary Data
2.1.2 Primary Data
2.1.2.1 Breakup of Primary Profiles
2.1.2.2 Key Industry Insights
2.2 Market Breakup and Data Triangulation
2.3 Market Size Estimation
2.3.1 Top-Down Approach
2.3.2 Bottom-Up Approach
2.4 Market Forecast
2.5 Assumptions for the Study
2.6 Limitations of the Study
3 Executive Summary (Page No. - 25)
4 Premium Insights (Page No. - 28)
4.1 Attractive Opportunities in the Augmented Analytics Market
4.2 Market in North America, By Component and Country
4.3 Market Major Countries
5 Market Overview and Industry Trends (Page No. - 30)
5.1 Introduction
5.2 Market Dynamics
5.2.1 Drivers
5.2.1.1 Increasing Volume of Complex Business Data
5.2.1.2 Growing Adoption of Advanced Business Intelligence and Analytics Tools
5.2.2 Restraints
5.2.2.1 Apprehension About Technologies Replacing Humans
5.2.3 Opportunities
5.2.3.1 Increase in Adoption of Artificial Intelligence, Machine Learning, and Natural Language Processing Technologies
5.2.3.2 High Adoption of Augmented Analytics Solutions Among SMEs
5.2.4 Challenges
5.2.4.1 Lack of Skilled Workforce
5.2.4.2 Difficulty in Managing Data Quality and Safety
5.3 Industry Trends
5.3.1 Market Evolution
5.3.2 Augmented Analytics: Use Cases
5.3.2.1 Use Case #1: to Identify Marketing Efforts for Measuring Business Growth
5.3.2.2 Use Case #2: to Improve Decision Process for Increasing Return on Investment
6 Augmented Analytics Market, By Component (Page No. - 35)
6.1 Introduction
6.2 Software
6.2.1 Innovations in Machine Learning and Artificial Intelligence to Drive the Adoption of Augmented Analytics Software for Forecasting the Business Growth
6.3 Services
6.3.1 Training and Consulting Services
6.3.1.1 Focus on Improving Technical Capabilities and Increasing the Demand for Better Strategic Outlook of Business to Drive the Growth of Training and Consulting Services
6.3.2 Deployment and Integration
6.3.2.1 Rise in Demand for Integrating Augmented Analytics Solutions With Existing Software to Drive the Growth of Deployment and Integration Services
6.3.3 Support and Maintenance
6.3.3.1 Growing Need for Seamless Performance of Software to Increase the Demand for Support and Maintenance Services
7 Augmented Analytics Market, By Organization Size (Page No. - 42)
7.1 Introduction
7.2 Large Enterprises
7.2.1 Need for Enhancing Business Functions and Maintaining ITs Position in the Competitive World to Drive the Adoption of Augmented Analytics in Large Enterprises
7.3 Small and Medium-Sized Enterprises
7.3.1 Need for Cost-Effective Analytical Solution to Drive the Demand for Augmented Analytics Solutions in Small and Medium-Sized Enterprises
8 Augmented Analytics Market, By Deployment Type (Page No. - 46)
8.1 Introduction
8.2 On-Premises
8.2.1 Need for Data Security Among Enterprises to Drive the Adoption of On-Premises Augmented Analytics Solutions
8.3 Cloud
8.3.1 Factors, Such as Cost-Effectiveness, Scalability, Accessibility of Real Time Information From Remote Location to Boost the Adoption Rate of Cloud-Based Augmented Analytics Solution
9 Augmented Analytics Market, By Vertical (Page No. - 50)
9.1 Introduction
9.2 Banking, Financial Services, and Insurance
9.2.1 Increasing Need for Generating Actionable Insights for Sensitive Data to Positively Impact the Demands for Augmented Analytics in the BFSI Vertical
9.3 Telecom and IT
9.3.1 Rapid Technological Advancement to Drive the Demand for Augmented Analytics in the Telecom and IT Vertical
9.4 Retail and Consumer Goods
9.4.1 Increasing Need for Enhanced User Experience and Better Understanding of Consumer Purchasing Power to Drive the Growth of Augmented Analytics in the Retail and Consumer Goods Vertical
9.5 Healthcare and Life Sciences
9.5.1 Need for Enhancing the Operational Efficiency to Boost Augmented Analytics in the Healthcare and Life Sciences Vertical
9.6 Manufacturing
9.6.1 Need for Resource Optimization and Achieving Maximum Productivity With Minimum Investment to Drive the Growth of Augmented Analytics in the Manufacturing Vertical
9.7 Government and Defense
9.7.1 Adoption of Digitalization to Boost the Growth Opportunities of Augmented Analytics in the Government and Defense Vertical
9.8 Energy and Utilities
9.8.1 Demand for Minimizing the Operational Cost to Drive the Adoption of Augmented Analytics in the Energy and Utilities Vertical
9.9 Transportation and Logistics
9.9.1 Need for Effectively Analyzing Data Related to Goods and Raw Materials to Boost the Adoption of Augmented Analytics in the Transportation and Logistics Vertical
9.10 Media and Entertainment
9.10.1 Increasing Need for Analyzing Customers� Media Consumption Preferences to Drive the Growth of Augmented Analytics in the Media and Entertainment Vertical
9.11 Others
10 Augmented Analytics Market, By Region (Page No. - 62)
10.1 Introduction
10.2 North America
10.2.1 United States
10.2.1.1 Early Adoption of Technologies and High Focus on Innovations to Boost the Market Growth in the United States
10.2.2 Canada
10.2.2.1 Adoption of Augmented Analytics Solutions Across Verticals to Drive the Market Growth in Canada
10.3 Europe
10.3.1 United Kingdom
10.3.1.1 Rise in Demand of Augmented Analytics Solution for Analyzing the Growth of Business to Drive the Growth of Market in the United Kingdom
10.3.2 Germany
10.3.2.1 Growth of the Retail and Consumer Goods Industry to Drive the Market in Germany
10.3.3 France
10.3.3.1 Increase in the Number of Technology Strat-ups to Drive the Growth of Market in France
10.3.4 Rest of Europe
10.4 Asia Pacific
10.4.1 Australia and New Zealand
10.4.1.1 Increasing Adoption of Technologies in Various Industries to Boost the Demand for Augmented Analytics in Australia and New Zealand
10.4.2 China
10.4.2.1 High Investment in Advanced Analytics Solutions to Drive the Market in China
10.4.3 Japan
10.4.3.1 Efficiency and Indirect Presence of Augmented Analytics Vendors to Drive the Market in Japan
10.4.4 Rest of Asia Pacific
10.5 Middle East and Africa
10.5.1 Kingdom of Saudi Arabia
10.5.1.1 Growing Need for Delivering Actionable Insights to Drive the Market in Kingdom of Saudi Arabia
10.5.2 South Africa
10.5.2.1 Increasing Demand for Enhanced Operational Efficiency to Drive the Growth of Market in South Africa
10.5.3 United Arab Emirates
10.5.3.1 Increasing Focus on Digital Transformation to Drive the Demand for Market in United Arab Emirates
10.5.4 Rest of Middle East and Africa
10.6 Latin America
10.6.1 Brazil
10.6.1.1 Rise in Number of IT Companies to Drive the Growth of Market in Brazil
10.6.2 Mexico
10.6.2.1 Increasing Awareness of Augmented Analytical Solution to Drive the Augmented Analytics Market in Mexico
10.6.3 Rest of Latin America
11 Competitive Landscape (Page No. - 83)
11.1 Overview
11.1.1 Product/Solution Launches and Enhancements
11.1.2 Business Expansions
11.1.3 Partnerships, Agreements, and Collaborations
12 Company Profiles (Page No. - 86)
12.1 Introduction
(Business Overview, Products, Solutions, & Services, Key Insights, Recent Developments, SWOT Analysis, MnM View)*
12.2 Salesforce
12.3 Sap
12.4 IBM
12.5 Microsoft
12.6 Oracle
12.7 Tableau Software
12.8 Microstrategy
12.9 SAS
12.10 Qlik
12.11 Tibco Software
12.12 Sisense
12.13 Information Builders
12.14 Yellowfin
12.15 ThoughtSpot
12.16 Domo
*Details on Business Overview, Products, Solutions, & Services, Key Insights, Recent Developments, SWOT Analysis, MnM View Might Not Be Captured in Case of Unlisted Companies.
13 Appendix (Page No. - 114)
13.1 Discussion Guide
13.2 Knowledge Store: MarketsandMarkets� Subscription Portal
13.3 Available Customizations
13.4 Related Reports
13.5 Author Details
List of Tables (60 Tables)
Table 1 United States Dollar Exchange Rate, 2015�2017
Table 2 Factor Analysis
Table 3 Augmented Analytics Market Size, By Component, 2016�2023 (USD Million)
Table 4 Software: Market Size, By Region, 2016�2023 (USD Million)
Table 5 Services: Market Size, By Region, 2016�2023 (USD Million)
Table 6 Services: Market Size, By Type, 2016�2023 (USD Million)
Table 7 Training and Consulting Services: Market Size By Region, 2016�2023 (USD Million)
Table 8 Deployment and Integration Services: Market Size By Region, 2016�2023 (USD Million)
Table 9 Support and Maintenance Services: Market Size By Region, 2016�2023 (USD Million)
Table 10 Augmented Analytics Market Size, By Organization Size, 2018�2023 (USD Million)
Table 11 Large Enterprises: Market Size By Region, 2018�2023 (USD Million)
Table 12 Small and Medium-Sized Enterprises: Market Size By Region, 2018�2023 (USD Million)
Table 13 Augmented Analytics Market Size By Deployment Type, 2016�2023 (USD Million)
Table 14 On-Premises: Market Size By Region, 2016�2023 (USD Million)
Table 15 Cloud: Market Size By Region, 2016�2023 (USD Million)
Table 16 Augmented Analytics Market Size, By Vertical, 2016�2023 (USD Million)
Table 17 Banking, Financial Services, and Insurance: Market Size By Region, 2016�2023 (USD Million)
Table 18 Telecom and IT: Market Size By Region, 2016�2023 (USD Million)
Table 19 Retail and Consumer Goods: Market Size By Region, 2016�2023 (USD Million)
Table 20 Healthcare and Life Sciences: Market Size By Region, 2016�2023 (USD Million)
Table 21 Manufacturing: Market Size By Region, 2016�2023 (USD Million)
Table 22 Government and Defense: Market Size By Region, 2016�2023 (USD Million)
Table 23 Energy and Utilities: Market Size By Region, 2016�2023 (USD Million)
Table 24 Transportation and Logistics: Market Size By Region, 2016�2023 (USD Million)
Table 25 Media and Entertainment: Market Size By Region, 2016�2023 (USD Million)
Table 26 Others: Market Size By Region, 2016�2023 (USD Million)
Table 27 Augmented Analytics Market Size, By Region, 2016�2023 (USD Million)
Table 28 North America: Market Size By Country, 2016�2023 (USD Million)
Table 29 North America: Market Size By Component, 2016�2023 (USD Million)
Table 30 North America: Market Size By Service, 2016�2023 (USD Million)
Table 31 North America: Market Size By Organization Size, 2016�2023 (USD Million)
Table 32 North America: Market Size By Deployment Type, 2016�2023 (USD Million)
Table 33 North America: Market Size By Vertical, 2016�2023 (USD Million)
Table 34 Europe: Market Size, By Country, 2016�2023 (USD Million)
Table 35 Europe: Market Size By Component, 2016�2023 (USD Million)
Table 36 Europe: Market Size By Service, 2016�2023 (USD Million)
Table 37 Europe: Market Size By Organization Size, 2016�2023 (USD Million)
Table 38 Europe: Market Size By Deployment Type, 2016�2023 (USD Million)
Table 39 Europe: Market Size By Vertical, 2016�2023 (USD Million)
Table 40 Asia Pacific: Augmented Analytics Market Size, By Country, 2016�2023 (USD Million)
Table 41 Asia Pacific: Market Size By Component, 2016�2023 (USD Million)
Table 42 Asia Pacific: Market Size By Service, 2016�2023 (USD Million)
Table 43 Asia Pacific: Market Size By Organization Size, 2016�2023 (USD Million)
Table 44 Asia Pacific: Market Size By Deployment Type, 2016�2023 (USD Million)
Table 45 Asia Pacific: Market Size By Vertical, 2016�2023 (USD Million)
Table 46 Middle East and Africa: Market Size, By Country, 2016�2023 (USD Million)
Table 47 Middle East and Africa: Market Size By Component, 2016�2023 (USD Million)
Table 48 Middle East and Africa: Market Size By Service, 2016�2023 (USD Million)
Table 49 Middle East and Africa: Market Size By Organization Size, 2016�2023 (USD Million)
Table 50 Middle East and Africa: Market Size By Deployment Type, 2016�2023 (USD Million)
Table 51 Middle East and Africa: Market Size By Vertical, 2016�2023 (USD Million)
Table 52 Latin America: Augmented Analytics Market Size, By Country, 2016�2023 (USD Million)
Table 53 Latin America: Market Size By Component, 2016�2023 (USD Million)
Table 54 Latin America: Market Size By Service, 2016�2023 (USD Million)
Table 55 Latin America: Market Size By Organization Size, 2016�2023 (USD Million)
Table 56 Latin America: Market Size By Deployment Type, 2016�2023 (USD Million)
Table 57 Latin America: Market Size By Vertical, 2016�2023 (USD Million)
Table 58 Product/Solution Launches and Enhancements, 2016�2018
Table 59 Business Expansions, 2018
Table 60 Partnerships, Agreements, and Collaborations, 2018
List of Figures (33 Figures)
Figure 1 Augmented Analytics Market: Research Design
Figure 2 Market Top-Down and Bottom-Up Approaches
Figure 3 Software Segment Held the Highest Market Share in the Market in 2018
Figure 4 Banking, Financial Services, and Insurance Dominated the Market in 2018
Figure 5 North America Accounted for the Highest Share of the Market in 2018
Figure 6 Increasing Demand for Gathering Insights From Business Data is One of the Factors Driving the Market
Figure 7 Software and United States Accounted for the Highest Share in North America for the Market in 2018
Figure 8 Australia and New Zealand to Grow at the Fastest Rate During the Forecast Period
Figure 9 Augmented Analytics Market: Drivers, Restraints, Opportunities, and Challenges
Figure 10 Evolution of Augmented Analytics
Figure 11 Services Segment to Have A Higher CAGR During the Forecast Period
Figure 12 Deployment and Integration Services Segment to Grow at the Highest CAGR During the Forecast Period
Figure 13 Small and Medium-Sized Enterprises Segment to Grow at A Higher CAGR During the Forecast Period
Figure 14 Cloud Deployment Model to Grow at A Higher CAGR During the Forecast Period
Figure 15 Retail and Consumer Goods Vertical to Grow at the Highest CAGR During the Forecast Period
Figure 16 Asia Pacific to Grow at the Highest CAGR During the Forecast Period
Figure 17 North America: Market Snapshot
Figure 18 Asia Pacific: Market Snapshot
Figure 19 Key Developments By the Leading Players in the Augmented Analytics Market, 2018
Figure 20 Geographic Revenue Mix of the Top Market Players
Figure 21 Salesforce: Company Snapshot
Figure 22 SWOT Analysis: Salesforce
Figure 23 Sap: Company Snapshot
Figure 24 SWOT Analysis: Sap
Figure 25 IBM: Company Snapshot
Figure 26 SWOT Analysis: IBM
Figure 27 Microsoft: Company Snapshot
Figure 28 SWOT Analysis: Microsoft
Figure 29 Oracle: Company Snapshot
Figure 30 SWOT Analysis: Oracle
Figure 31 Tableau Software: Company Snapshot
Figure 32 Microstrategy: Company Snapshot
Figure 33 SAS: Company Snapshot
The study involved 4 major steps to estimate the current market size of the augmented analytics market. Exhaustive secondary research was done to collect information about the market, the peer market, and the parent market. The next step was to validate these findings, assumptions, and sizing with industry experts across the value chain through primary research. Both top-down and bottom-up approaches were employed to estimate the complete market size. After that, the market breakup and data triangulation procedures were used to estimate the market size of the segments and subsegments.
Secondary Research
The market size for companies offering augmented analytics solutions and services was arrived at on the basis of the secondary data available through paid and unpaid sources, and by analyzing the product portfolios of the major companies in the ecosystem and rating them according to their performance and quality. In the secondary research process, various sources were referred to, for identifying and collecting information for this study. The secondary sources included annual reports, press releases and investor presentations of companies, white papers, journals, certified publications, and articles from recognized authors, directories, and databases.
Secondary research was mainly used to obtain key information about the industry�s supply chain, the total pool of key players, market classification and segmentation according to industry trends to the bottom-most level, regional markets, and key developments from both the market and technology-oriented perspectives, all of which were further validated by primary sources.
Primary Research
In the primary research process, various sources from both supply and demand sides were interviewed to obtain qualitative and quantitative information for making this report. The primary sources from the supply side included industry experts, such as Chief Executive Officers (CEOs), Vice Presidents (VPs), marketing directors, technology and innovation directors, and related key executives from various key companies and organizations operating in the augmented analytics market.
After the complete market engineering (including calculations for market statistics, market breakup, market size estimations, market forecasting, and data triangulation), extensive primary research was conducted to gather information, and verify and validate the critical numbers arrived at. Primary research was also conducted to identify the segmentation types; the competitive landscape of augmented analytics solution and service providers; and key market dynamics, such as drivers, restraints, opportunities, challenges, industry trends, and key players� strategies.
The following figure depicts the breakup of the primary profiles:
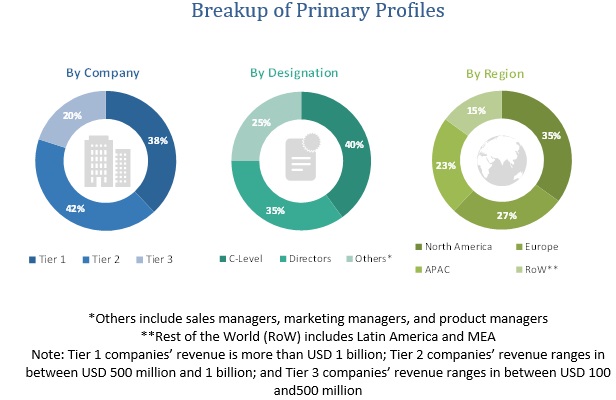
To know about the assumptions considered for the study, download the pdf brochure
Augmented Analytics Market Size Estimation
Both top-down and bottom-up approaches were used to estimate and validate the total size of the market. They were also used extensively to estimate the size of various subsegments in the market. The research methodology used to estimate the market size includes the following:
- The key players in the industry and markets have been identified through extensive secondary research.
- The industry�s supply chain and market size, in terms of value, have been determined through primary and secondary research processes.
- All percentage shares, splits, and breakups have been determined using secondary sources and verified through primary sources.
Data Triangulation
After arriving at the overall market size using the market size estimation processes as explained above�the market was split into several segments and subsegments. To complete the overall market engineering process and arrive at the exact statistics of each market segment and subsegment, the data triangulation and market breakup procedures were employed, wherever applicable. The data was triangulated by studying several factors and trends from both, the demand and supply sides in the augmented analytics market.
Report Objectives
- To define, segment, and project the global market size of the market
- To understand the structure of the market by identifying its various subsegments
- To provide detailed information about the key factors (drivers, restraints, opportunities, and industry-specific challenges) influencing the growth of the market
- To analyze the micromarkets with respect to individual growth trends, prospects, and their contribution to the total market
- To project the size of the market and its submarkets, in terms of value, with respect to the 5 major regions (along with their respective key countries)
- To profile key players and comprehensively analyze their core competencies
- To understand the competitive landscape and identify major growth strategies adopted by players across key regions
- To analyze the competitive developments, such as expansions and investments, new product launches, mergers and acquisitions, joint ventures, and agreements, in the augmented analytics market
Available Customizations
With the given market data, MarketsandMarkets offers customizations as per the company�s specific needs and on best effort basis for profiling of additional market players.


Growth opportunities and latent adjacency in Augmented Analytics Market
Interested in knowing about the competitive analysis and how is the market being affected by COVID-19.
Interested in knowing more about the competition in the market