Automatic Power Factor Controller Market by Type (Active APFC and Passive APFC), Component (Relays, Capacitors, Displays, Microcontrollers, Switches, and Resistors), Industry and Geography - Global Forecast to 2035


Automatic Power Factor Controller Market Summary
The Automatic Power Factor Controller Market is witnessing steady expansion as industries, utilities, commercial facilities, and infrastructure operators increasingly prioritize electrical efficiency, power quality, and reduction of reactive power losses. The global market was valued at approximately USD 4.3 billion in 2024 and is projected to reach nearly USD 5.4 billion by 2030, registering a CAGR of about 4% during the forecast period. The market is being supported by rising electricity costs, industrial automation, increasing deployment of motors and other inductive loads, smart-grid modernization, and stricter energy-efficiency requirements. At the same time, digital transformation is making APFC systems more intelligent through IoT-enabled monitoring, cloud connectivity, predictive analytics, and automated control. Active power factor controllers remain particularly important where high power-factor correction and dynamic load management are required, while passive solutions continue to serve cost-sensitive and conventional electrical installations.
Key Market Trends & Insights
The Asia Pacific region is emerging as a major growth engine for the Automatic Power Factor Controller Market because of rapid industrialization, infrastructure development, manufacturing expansion, and increasing electricity consumption.
Active automatic power factor controllers represent a leading technology segment. Their ability to respond dynamically to changing electrical loads makes them suitable for modern manufacturing facilities, data centers, automation systems, and other applications where power quality must be maintained continuously.
Another important trend is the integration of IoT and digital monitoring. Modern APFC systems increasingly provide real-time measurements of voltage, current, reactive power, harmonics, temperature, and power factor, enabling operators to identify inefficiencies and optimize compensation strategies.
Industrial automation is strengthening demand because automated production lines use large numbers of motors, drives, transformers, and other inductive equipment. APFC systems help maintain an appropriate power factor as these loads fluctuate.
The transition toward smart energy management is also creating opportunities for intelligent APFC systems that communicate with energy-management platforms, supervisory control systems, and cloud-based analytics environments.
Market Size & Forecast
-
Base year market size: Approximately USD 4.3 billion in 2024.
-
Forecast value by 2030: Approximately USD 5.4 billion.
-
CAGR: Approximately 4% during 2024–2030.
-
Growth factors: Rising electricity demand, industrial automation, power-quality requirements, energy-efficiency initiatives, smart-grid investments, and increasing adoption of digitally monitored electrical systems.
-
Long-term opportunity: Integration with IoT, AI-driven analytics, cloud platforms, and intelligent energy-management systems is expected to expand the functionality of APFC solutions beyond conventional capacitor switching.
Automatic Power Factor Controller Market Top 10 key takeaway
-
The global Automatic Power Factor Controller Market is projected to grow steadily through the end of the decade.
-
The market was valued at approximately USD 4.3 billion in 2024.
-
The market is expected to reach approximately USD 5.4 billion by 2030.
-
Active power factor controllers remain an important segment because of their dynamic correction capabilities.
-
Asia Pacific is a major regional growth opportunity because of industrialization and infrastructure expansion.
-
China is expected to remain a significant market for APFC solutions.
-
Manufacturing is a key demand center because of its extensive use of motors, transformers, drives, and automated equipment.
-
IoT connectivity is transforming APFC systems into remotely monitored power-management solutions.
-
Energy-efficiency requirements and rising electricity costs are encouraging organizations to improve power-factor performance.
-
AI, predictive analytics, and smart-grid integration are expected to create new opportunities for intelligent power-factor management.
Product Insights
The Automatic Power Factor Controller Market can broadly be categorized into active and passive power factor controller solutions. Active power factor controllers have traditionally attracted strong demand because they can dynamically respond to variations in electrical loads and provide precise power-factor correction.
Active solutions are particularly valuable in facilities where loads change frequently, including automated manufacturing plants, commercial buildings, data centers, and process industries. Their ability to support higher power-factor performance makes them suitable for modern electrical environments containing nonlinear and rapidly changing loads.
Passive APFC solutions remain relevant because of their comparatively straightforward architecture and cost advantages. They are commonly used in applications where electrical loads are relatively predictable and the required level of compensation can be achieved through conventional capacitor-based arrangements.
The product landscape is also moving toward intelligent APFC panels equipped with digital displays, communication interfaces, advanced switching technologies, harmonic monitoring, and remote diagnostics. Integration with IoT gateways allows operators to monitor electrical parameters remotely, while AI-enabled analytics can help identify abnormal operating conditions and predict maintenance requirements.
Technology / Component Insights
Technology innovation is becoming an increasingly important differentiator in the Automatic Power Factor Controller Market. Conventional APFC systems primarily rely on controllers, capacitor banks, contactors, reactors, switching devices, and measurement circuits to automatically maintain the desired power factor. Newer systems combine these components with digital controllers, sensors, communication interfaces, and software-based monitoring.
IoT technology enables APFC systems to continuously transmit operational data to centralized energy-management platforms. Facility managers can monitor power factor, voltage, current, reactive power, capacitor-bank status, and system alarms without physically inspecting electrical panels.
AI and machine learning can further improve this functionality by analyzing historical load patterns and identifying trends in reactive power demand. Predictive algorithms can potentially optimize capacitor switching, reduce unnecessary switching cycles, and identify early signs of component degradation.
Cloud connectivity is also creating opportunities for multi-site energy management. Organizations operating multiple manufacturing plants, commercial buildings, or infrastructure facilities can consolidate APFC performance information into centralized dashboards.
Another technological direction involves thyristor-based switching and advanced harmonic mitigation. These technologies are increasingly relevant in environments containing variable-frequency drives, power electronics, renewable-energy systems, and other nonlinear loads. Future APFC platforms are expected to combine power-factor correction with broader power-quality management capabilities.
Application Insights
The industrial sector represents one of the most important application areas for the Automatic Power Factor Controller Market. Manufacturing plants operate motors, pumps, compressors, transformers, welding equipment, HVAC systems, and automated production machinery that can create substantial reactive-power requirements. Maintaining an appropriate power factor helps improve electrical-system utilization and can reduce utility-related penalties in markets where such charges apply.
Process industries such as oil and gas, chemicals, metals, mining, food processing, and pharmaceuticals represent significant opportunities because their facilities often operate continuously and contain large electrical loads. The increasing adoption of industrial automation is further increasing the need for sophisticated power-management solutions.
Commercial buildings are another important application area. Shopping centers, office complexes, hospitals, hotels, and large institutional facilities use substantial HVAC, lighting, elevator, pumping, and electrical equipment. APFC systems can support energy-efficiency objectives while improving utilization of electrical infrastructure.
Utilities and infrastructure operators also represent an expanding opportunity as grids become more digitally managed. Future APFC systems can increasingly interact with energy-management platforms and distributed-energy resources, supporting improved visibility and control of reactive power.
Data centers are an emerging application area because of rapidly increasing electricity consumption associated with cloud computing, AI workloads, and high-performance computing. The growing concentration of power electronics in these facilities creates additional requirements for efficient power-quality management.
Regional Insights
North America represents a mature market characterized by established industrial infrastructure, high awareness of energy efficiency, and extensive adoption of advanced electrical-management technologies. The United States remains a major market, with one recent assessment estimating its APFC market at approximately USD 1.1 billion in 2024. Demand is supported by manufacturing modernization, commercial infrastructure, data-center development, and smart-energy initiatives.
Europe continues to emphasize energy efficiency, industrial sustainability, and modernization of electrical infrastructure. Germany, France, and other industrial economies offer opportunities for advanced APFC solutions as manufacturers invest in energy-efficient production and digital monitoring.
Asia Pacific is expected to demonstrate strong growth due to industrialization, urbanization, infrastructure development, and rising electricity demand. China and India are especially important markets, while Japan and South Korea contribute through advanced manufacturing and automation. Earlier industry research also identified Asia Pacific as a significant market because of infrastructure development and industrial expansion.
-
North America: Strong demand from mature industrial and commercial infrastructure.
-
Europe: Energy-efficiency regulations and industrial modernization support adoption.
-
Asia Pacific: Rapid industrialization makes the region a major growth opportunity.
-
China: Manufacturing expansion and power-management investments support APFC demand.
-
India: Industrialization, infrastructure development, and energy-efficiency initiatives create long-term opportunities.
Country-Specific Market Trends
In China, the Automatic Power Factor Controller Market is benefiting from extensive manufacturing activity, industrial automation, infrastructure investment, and electricity-demand growth. China is projected to be among the faster-growing national markets, with one forecast estimating a 7.1% CAGR through 2030. Japan represents a technologically mature market where high-efficiency manufacturing, automation, and sophisticated electrical infrastructure support demand for advanced power-management systems.
In North America, the United States remains a significant market because of its large industrial base, commercial infrastructure, and data-center expansion. Canada benefits from investments in industrial facilities, utilities, and energy-management systems, while Mexico offers opportunities through manufacturing expansion and nearshoring-related industrial investment.
In Europe, Germany is a major demand center because of its strong manufacturing sector and emphasis on industrial automation. France is also investing in energy efficiency, infrastructure modernization, and industrial digitalization, supporting the adoption of intelligent electrical-management technologies.
For country-level market growth, the precise CAGR varies by source and segmentation methodology; therefore, country-specific figures should be treated as market estimates rather than directly comparable values.
-
China: Strongest growth potential among major APAC markets, supported by industrial expansion.
-
Japan: Demand is influenced by advanced manufacturing and high-efficiency electrical systems.
-
United States: Large installed industrial base and data-center expansion support APFC adoption.
-
Germany: Industrial automation and energy-efficiency priorities strengthen demand.
-
France: Infrastructure modernization and energy-management initiatives create opportunities.
Key Automatic Power Factor Controller Company Insights
The competitive landscape includes major electrical-equipment, power-management, and semiconductor companies. Key participants include ABB, Schneider Electric, Eaton, Siemens, General Electric, Larsen & Toubro, TDK/EPCOS, Texas Instruments, STMicroelectronics, and onsemi. Industry reports identify several of these companies among the leading participants in the market.
These companies are increasingly competing through product reliability, power-quality capabilities, digital connectivity, energy monitoring, compact designs, and integration with broader electrical-management platforms. Large electrical-equipment companies are particularly well positioned to combine APFC hardware with switchgear, energy-management software, automation systems, and digital services.
Semiconductor companies contribute through microcontrollers, power-management ICs, sensing components, switching technologies, and control electronics. This convergence between electrical equipment and digital technologies is expected to influence the next generation of APFC solutions.
-
ABB: Focuses on intelligent electrification and digital power-management solutions.
-
Schneider Electric: Emphasizes connected energy-management and automation ecosystems.
-
Eaton: Targets power-quality, electrical protection, and energy-efficiency applications.
-
Siemens: Combines industrial automation with digital electrical infrastructure.
-
Larsen & Toubro: Benefits from industrial and infrastructure demand, particularly in India.
-
TDK/EPCOS: Provides components supporting power-factor correction systems.
-
Texas Instruments: Contributes control and semiconductor technologies for power-management applications.
Recent Developments
The market is moving toward digitally connected APFC panels capable of transmitting electrical measurements to energy-management platforms. Remote monitoring is becoming increasingly valuable for industrial facilities seeking to reduce manual inspections and improve operational visibility.
Another important development is the incorporation of advanced switching technologies and harmonic mitigation into power-factor correction systems. This is particularly relevant as industrial facilities adopt variable-frequency drives, robotics, renewable-energy equipment, and other power-electronic loads.
AI and predictive analytics are also emerging as strategic technologies. Future APFC systems are expected to use historical load information to improve switching decisions, identify abnormal capacitor behavior, and support predictive maintenance.
Market Segmentation
The Automatic Power Factor Controller Market is segmented primarily by product, technology/component, application, and region. By product, the market includes active and passive power factor controllers, with active solutions maintaining a strong position because of their dynamic response to changing loads. By technology and components, the ecosystem includes controllers, capacitors, relays, contactors, thyristor switches, microcontrollers, displays, harmonic filters, reactors, sensors, and communication modules. By application, demand comes from process industries, discrete manufacturing, commercial facilities, utilities, infrastructure, data centers, and other energy-intensive environments. Geographically, the market covers North America, Europe, Asia Pacific, South America, and the Middle East & Africa, with Asia Pacific expected to remain a major growth region.
-
By Product: Active and passive automatic power factor controllers.
-
By Component: Controllers, capacitors, switching devices, sensors, displays, and communication modules.
-
By Application: Process industries, discrete industries, commercial buildings, utilities, and infrastructure.
-
By Technology: Conventional capacitor switching, active correction, thyristor switching, IoT monitoring, and intelligent control.
-
By Region: North America, Europe, Asia Pacific, South America, and Middle East & Africa.
The Automatic Power Factor Controller Market is positioned for consistent growth as organizations seek to reduce energy losses, improve electrical-system utilization, and strengthen power quality. Based on current market assessments, the market is expected to expand from approximately USD 4.3 billion in 2024 to USD 5.4 billion by 2030, representing roughly 4% CAGR.
The next phase of market development will extend beyond conventional capacitor switching. AI, IoT, automation, cloud connectivity, predictive maintenance, and smart-grid technologies will increasingly influence APFC product design. Intelligent systems capable of monitoring electrical conditions in real time and coordinating compensation with changing loads will become increasingly valuable.
For businesses, APFC technology represents more than an electrical-efficiency investment. It can form part of a broader digital energy-management strategy that supports operational efficiency, equipment protection, sustainability objectives, and cost optimization. As industrial automation and electricity-intensive technologies continue to expand through 2030 and toward 2035, intelligent power-factor management is likely to remain strategically important across manufacturing, infrastructure, commercial buildings, utilities, and data centers.
FAQs
1. What is the market size of the Automatic Power Factor Controller Market?
The global Automatic Power Factor Controller Market was valued at approximately USD 4.3 billion in 2024 and is projected to reach around USD 5.4 billion by 2030.
2. What is the growth rate of the Automatic Power Factor Controller Market?
The market is expected to grow at approximately 4% CAGR during 2024–2030. Growth is supported by energy-efficiency requirements, industrial automation, electricity-demand growth, and increasing investment in power-quality management.
3. What are the key drivers of the Automatic Power Factor Controller Market?
Major drivers include rising electricity costs, industrial automation, increasing use of inductive electrical loads, smart-grid modernization, power-quality requirements, energy-efficiency initiatives, and the growing use of IoT-enabled electrical monitoring systems.
4. Which region leads the Automatic Power Factor Controller Market?
North America represents a major established market, while Asia Pacific is a key growth region due to rapid industrialization, infrastructure development, urbanization, and increasing electricity consumption. China is expected to be among the faster-growing national markets.
5. Who are the key companies in the Automatic Power Factor Controller Market?
Major companies include ABB, Schneider Electric, Eaton, Siemens, General Electric, Larsen & Toubro, TDK/EPCOS, Texas Instruments, STMicroelectronics, and onsemi.
To speak to our analyst for a discussion on the above findings, click Speak to Analyst
 Exclusive indicates content/data unique to MarketsandMarkets and not available with any competitors.
Table of Contents
1 Introduction (Page No. - 13)
1.1 Objectives of the Study
1.2 Market Definition
1.3 Study Scope
1.3.1 Markets Covered
1.3.2 Years Considered for the Study
1.4 Currency
1.5 Limitations
1.6 Stakeholders
2 Research Methodology (Page No. - 16)
2.1 Research Data
2.1.1 Secondary Data
2.1.1.1 Key Data From Secondary Sources
2.1.2 Primary Data
2.1.2.1 Key Data From Primary Sources
2.1.2.2 Key Industry Insights
2.1.2.3 Breakdown of Primaries
2.2 Market Size Estimation
2.2.1 Bottom-Up Approach
2.2.2 Top-Down Approach
2.3 Data Triangulation
2.4 Research Assumption
2.4.1 Assumption
3 Executive Summary (Page No. - 24)
4 Premium Insights (Page No. - 29)
4.1 Attractive Growth Opportunities in the Automatic Power Factor Controller Market Between 2016 and 2022
4.2 Automatic Power Factor Controller Market, By Type
4.3 Automatic Power Factor Controller Market, 2015
4.4 U.S. Held the Largest Share of the APFC Market in 2015
5 Market Overview (Page No. - 32)
5.1 Introduction
5.2 Market Segmentation
5.2.1 Automatic Power Factor Controller Market, By Type
5.2.2 Market, By Component
5.2.3 Market, By Industry
5.2.4 Market By Installation Type
5.2.5 Market, By Geography
5.3 Market Dynamics
5.3.1 Drivers
5.3.1.1 Increasing Need for Energy Conservation in Industries and Home Utilities to Reduce Power Losses
5.3.1.2 Growing Requirement of Preventing Damage to Appliances and Equipment Due to Overvoltage Conditions
5.3.2 Restraints
5.3.2.1 High Initial Cost of Installation of Automatic Power Factor Controller Panels for Industrial Verticals
5.3.3 Opportunities
5.3.3.1 Growing Investments in Developing Economies in Infrastructure
5.3.4 Challanges
5.3.4.1 Designing Complex Circuits By Following Standards and Regulatory Requirements to Enhance the Power Factor
6 Industry Trends (Page No. - 39)
6.1 Introduction
6.2 Value Chain Analysis
6.3 Porter’s Five Forces Analysis
6.3.1 Intensity of Competitive Rivalry
6.3.2 Threat of Substitutes
6.3.3 Bargaining Power of Buyers
6.3.4 Bargaining Power of Suppliers
6.3.5 Threat of New Entrants
7 Automatic Power Factor Controller Market, By Type (Page No. - 47)
7.1 Introduction
7.2 Passive APFCs
7.3 Active APFCs
8 Automatic Power Factor Controller Market, By Component (Page No. - 52)
8.1 Introduction
8.2 Relays
8.3 Capacitors
8.4 Resistors
8.5 Displays
8.6 Microcontrollers
8.7 Switches
9 Automatic Power Factor Controller Market, By Installation Type (Page No. - 57)
9.1 Introduction
9.2 Self-Standing APFC Panels
9.3 Wall-Mounted APFC Panels
10 Automatic Power Factor Controller Market, By Industry (Page No. - 60)
10.1 Introduction
10.2 Manufacturing
10.3 Utility
10.4 Commercial
10.5 Enterprise
10.6 Military
11 Automatic Power Factor Controller Market, By Geography (Page No. - 81)
11.1 Introduction
11.2 North America
11.2.1 U.S.
11.2.2 Canada
11.2.3 Mexico
11.3 Europe
11.3.1 U.K.
11.3.2 Germany
11.3.3 France
11.3.4 Rest of Europe
11.4 Asia-Pacific (APAC)
11.4.1 China
11.4.2 Japan
11.4.3 India
11.4.4 South Korea
11.4.5 Rest of APAC
11.5 Rest of the World (RoW)
11.5.1 Middle East and Africa
11.5.2 South America
12 Competitive Landscape (Page No. - 102)
12.1 Introduction
12.2 Ranking of Top 5 Players in the Market
12.3 Competitive Analysis
12.4 Recent Developments
12.4.1 New Product Launches & Developments: Automatic Power Factor Controller Market
12.4.2 Partnerships, Joint Ventures, & Collaborations
12.4.3 Agreements
12.4.4 Others
13 Company Profile (Page No. - 109)
(Overview, Products and Services, Financials, Strategy & Development)*
13.1 Introduction
13.2 ABB Ltd.
13.3 General Electric Company
13.4 Eaton Corporation PLC
13.5 Schneider Electric SE
13.6 EPCOS AG
13.7 Texas Instruments, Inc.
13.8 Fairchild Semiconductor International, Inc.
13.9 on Semiconductor Corporation
13.10 Stmicroelectronics N.V.
13.11 Crompton Greaves Ltd.
13.12 Larsen & Toubro Limited
*Details on Overview, Products and Services, Financials, Strategy & Development Might Not Be Captured in Case of Unlisted Companies.
14 Appendix (Page No. - 135)
14.1 Insights of Industry Experts
14.2 Discussion Guide
14.3 Knowledge Store: Marketsandmarkets’ Subscription Portal
14.4 Introducing RT: Real-Time Market Intelligence
14.5 Available Customization
14.6 Related Reports
List of Tables (65 Tables)
Table 1 Global APFC Market in Terms of Value and Vollume, 2013–2022
Table 2 Global APFC Market, By Type, 2013–2022 (USD Billion)
Table 3 Global Passive APFC Market, By Industry, 2013–2022 (USD Billion)
Table 4 Global Active APFC Market, By Industry, 2013–2022 (USD Billion)
Table 5 Global APFC Market, By Component, 2013–2022 (USD Billion)
Table 6 Global APFC Market Size, By Component, 2013-2022 (Million Units)
Table 7 Global APFC Market, By Industry, 2013–2022 (USD Billion)
Table 8 APFC Market for Manufacturing Industry Market, By Type, 2013–2022 (USD Billion)
Table 9 APFC Market for Manufacturing Industry, By Region, 2013–2022 (USD Billion)
Table 10 APFC Market for Manufacturing Industry in North America, By Country, 2013–2022 (USD Billion)
Table 11 APFC Market for Manufacturing Industry in Europe, By Country, 2013–2022 (USD Billion)
Table 12 APFC Market for Manufacturing Industry in APAC, By Country, 2013–2022 (USD Billion)
Table 13 APFC Market for Manufacturing Industry in RoW, By Region, 2013–2022 (USD Billion)
Table 14 APFC Market for Utility Industry , By Type, 2013–2022 (USD Billion)
Table 15 APFC Market for Utility Industry, By Region, 2013–2022 (USD Billion)
Table 16 APFC Market for Utility Industry in North Ameirca, By Country, 2013–2022 (USD Billion)
Table 17 APFC Market for Utility Industry in Europe, By Country, 2013–2022 (USD Billion)
Table 18 APFC Market for Utility Industry in APAC, By Country, 2013–2022 (USD Billion)
Table 19 APFC Market for Utility Industry in RoW, By Region, 2013–2022 (USD Billion)
Table 20 APFC Market for Commercial Industry, By Type, 2013–2022 (USD Billion)
Table 21 APFC Market for Commercial Industry, By Region, 2013–2022 (USD Billion)
Table 22 APFC Market for Commercial Industry in North America, By Country, 2013–2022 (USD Billion)
Table 23 APFC Market for Commercial Industry in Europe, By Country, 2013–2022 (USD Billion)
Table 24 APFC Market for Commercial Industry in APAC, By Country, 2013–2022 (USD Billion)
Table 25 APFC Market for Commercial Industry in RoW, By Region, 2013–2022 (USD Billion)
Table 26 APFC Market for Enterprise Industry, By Type, 2013–2022 (USD Billion)
Table 27 APFC Market for Enterprise Industry, By Region, 2013–2022 (USD Billion)
Table 28 APFC Market for Enterprise Industry in North America, By Country, 2013–2022 (USD Billion)
Table 29 APFC Market for Enterprise Industry in Europe, By Country, 2013–2022 (USD Billion)
Table 30 APFC Market for Enterprise Industry in APAC, By Country, 2013–2022 (USD Billion)
Table 31 APFC Market for Enterprise Industry in RoW, By Region, 2013–2022 (USD Billion)
Table 32 APFC Market for Military Industry, By Type, 2013–2022 (USD Billion)
Table 33 APFC Market for Military Industry, By Region, 2013–2022 (USD Billion)
Table 34 APFC Market for Military Industry in North America, By Country, 2013–2022 (USD Billion)
Table 35 APFC Market for Military Industry in Europe, By Country, 2013–2022 (USD Million)
Table 36 APFC Market for Military Industry in APAC, By Country, 2013–2022 (USD Million)
Table 37 APFC Market for Military Industry in RoW, By Region, 2013–2022 (USD Billion)
Table 38 Global APFC Market, By Region, 2013–2022 (USD Billion)
Table 39 APFC Market in North America, By Industry, 2013–2022 (USD Million)
Table 40 APFC Market in North America, By Country, 2013–2022 (USD Million)
Table 41 APFC Market in U.S., By Industry, 2013–2022 (USD Billion)
Table 42 APFC Market in Canada, By Industry, 2013–2022 (USD Billion)
Table 43 APFC Market in Mexico, By Industry, 2013–2022 (USD Billion)
Table 44 APFC Market in Europe, By Industry, 2013–2022 (USD Million)
Table 45 APFC Market in Europe, By Country, 2013–2022 (USD Million)
Table 46 APFC Market in U.K., By Industry, 2013–2022 (USD Million)
Table 47 APFC Market in Germany, By Industry, 2013–2022 (USD Billion)
Table 48 APFC Market in France, By Industry, 2013–2022 (USD Million
Table 49 APFC Market in Rest of Europe, By Industry, 2013–2022 (USD Million)
Table 50 APFC Market in APAC, By Industry, 2013–2022 (USD Billion)
Table 51 APFC Market in APAC, By Country, 2013–2022 (USD Billion)
Table 52 APFC Market in China, By Industry, 2013–2022 (USD Billion)
Table 53 APFC Market in Japan, By Industry, 2013–2022 (USD Million)
Table 54 APFC Market in India, By Industry, 2013–2022 (USD Billion)
Table 55 APFC Market in South Korea, By Industry, 2013–2022 (USD Million)
Table 56 APFC Market in Rest of APAC, By Industry, 2013–2022 (USD Million)
Table 57 APFC Market in RoW, By Industry, 2013–2022 (USD Billion)
Table 58 APFC Market in RoW, By Region, 2013–2022 (USD Billion)
Table 59 APFC Market in Middle East and Africa, By Industry, 2013–2022 (USD Billion)
Table 60 APFC Market in South America, By Industry, 2013–2022 (USD Million)
Table 61 Ranking of Top 5 Players in the Automatic Power Factor Controller Market
Table 62 New Product Launches & Developments, 2013–2016
Table 63 Partnerships, Joint Ventures, Collaborations, and Expansions, 2013–2016
Table 64 Agrements, 2013–2016
Table 65 Others, 2013–2016
List of Figures (60 Figures)
Figure 1 Market Segmentation
Figure 2 Automatic Power Factor Controller Market: Research Design
Figure 3 Market Size Estimation Methodology: Bottom-Up Approach
Figure 4 Market Size Estimation Methodology: Top-Down Approach
Figure 5 Assumption of the Research Study
Figure 6 The APFC Market in Terms of Volume Expected to Grow at A Significant Rate Between 2016 and 2022
Figure 7 Displays Expected to Hold the Largest Size of the APFC Market By 2022
Figure 8 Utility Industry Expected to Have the Highest CAGR in Market During the Forecast Period
Figure 9 Market for Utility Industry Expected to Grow at the Highest CAGR Between 2016 and 2022
Figure 10 North America Held the Largest Share of the Market in 2015
Figure 11 APFC Market Expected to Grow at A Moderate Rate During the Forecast Period
Figure 12 Active Automatic Power Factor Controller Market to Exhibit High Growth During the Forecast Period
Figure 13 Utility Industry Held the Largest Market Share in 2015
Figure 14 U.S. Held the Largest Market Share in 2015
Figure 15 Market: Drivers, Restraints, Opportunities, and Challenges
Figure 16 Value Chain Analysis (2015): Major Value is Added During the Manufacturing Phase
Figure 17 Porter’s Five Forces Analysis for the Market, 2015
Figure 18 The Impact Analysis of Porter’s Five Force Model, 2015
Figure 19 The Impact Analysis of Intensity of Competitive Rivalry
Figure 20 Imapact Analysis of Threat of Substitutes
Figure 21 Impact Analysis of Bargaining Power of Buyers
Figure 22 Impact Analysis of Bargaining Power of Suppliers
Figure 23 Impact Analysis of Thrat of New Enterants
Figure 24 Active Automatic Power Factor Controller Market Likely to Grow at A Highest CAGR During the Forecast Period
Figure 25 Displays Expected to Have the Highest CAGR During Forecast Period
Figure 26 Installation Type for APFC Equipment
Figure 27 Utility Industry Expected to Lead the Active Automatic Power Factor Market During the Forecast Period
Figure 28 U.S. Likely to Dominate the APFC Market for Manufacturing Industry During the Forecast Period
Figure 29 Utility Industry in APAC Expected to Lead the APFC Market During the Forecast Period
Figure 30 Active APFCs Expected to Dominate the Market During the Forecast Period
Figure 31 APFC Market for Enterprise Industry in APAC Expected to Grow at the Highest CAGR Between 2016 and 2022
Figure 32 Active APFCs for Military Industry Held the Largest Size of the Market in 2015
Figure 33 Geographical Snapshot: Automatic Power Factor Controller Market
Figure 34 Overview of the Market in North America, 2015
Figure 35 APFC Market in North America for Utility Industry Expected to Grow at the Highest CAGR During the Forecast Period
Figure 36 APFC Market in Germany Expected to Grow at the Highest Rate During the Forecast Period
Figure 37 APFC Market for Utility Industry in France Likely to Grow at the Highest CAGR During the Forecast Period
Figure 38 Overview of the Automatic Power Factor Controller Market in APAC, 2015
Figure 39 Utility Industry to Lead the APFC Market in APAC During the Forecast Period
Figure 40 APFC Market for Utility Industry in RoW Expected to Grow at the Highest CAGR Between 2016 and 2022
Figure 41 Companies Adopted New Product Launches & Developments as the Key Growth Strategy Between 2013 and 2016
Figure 42 Market Evaluation Framework: (2013–2016)
Figure 43 Battle for Market Share for Automatic Power Factor Controllers: New Product Launches & Developments Were the Key Strategies
Figure 44 Geographic Revenue Mix of the Major Market Players
Figure 45 ABB Ltd.: Company Snapshot
Figure 46 ABB Ltd.: SWOT Analysis
Figure 47 General Electric Company: Company Snapshot
Figure 48 General Electric Company: SWOT Analysis
Figure 49 Eaton Corporation PLC: Company Snapshot
Figure 50 Eaton Corporation: SWOT Analysis
Figure 51 Schneider Electric SE: Company Snapshot
Figure 52 Schneider Electric SE: SWOT Analysis
Figure 53 EPCOS AG: Company Snapshot
Figure 54 EPCOS AG: SWOT Analysis
Figure 55 Texas Instruments, Inc.: Company Snapshot
Figure 56 Fairchild Semiconductor International, Inc.: Company Snapshot
Figure 57 On Semiconductor Corporation: Company Snapshot
Figure 58 Stmicroelectronics N.V.: Company Snapshot
Figure 59 Crompton Greaves Ltd.: Company Snapshot
Figure 60 Larsen & Toubro Limited (L&T): Company Snapshot
The global automatic power factor controller (APFC) market is expected to be worth USD 4.78 Billion by 2022, growing at a CAGR of 4.6% during the forecast period. In this report, 2015 has been considered as the base year, and the period between 2016 and 2022 has been considered as the forecast period for the study of automatic power factor controller market. The objective of the study of this report is to define, describe, and forecast the global automatic power factor controller market on the basis of type, component, industry, and geography. The report also forecasts the market size of various segments with regard to industry and region. The region includes four main segments, namely, North America, Europe, Asia-Pacific, and RoW. Additionally, the report provides detailed information regarding major factors influencing the growth of the market (drivers, restraints, opportunities, and industry-specific challenges). The opportunities have been analyzed in the market for stakeholders by identifying the high-growth segments of the global APFC market. The report also profiles the key players and comprehensively analyzes their market ranking and core competencies, along with detailing the competitive landscape for market leaders.
The top-down and bottom-up approaches have been considered to estimate the size of the APFC market. This research study involves an extensive usage of secondary sources, directories, and databases (such as, Factiva and OneSource) to identify and collect information useful for technical, market-oriented, and commercial aspects of APFC devices. The points below explain the research methodology applied:
- This entire research methodology includes the study of annual and financial reports of top players, presentations, press releases, journals, paid databases, and interviews with industry experts.
- To analyze the opportunities in the market for stakeholders by identifying high-growth segments in the global APFC market.
- Competitive developments such as mergers & acquisitions, new product launches & developments, and research & development in the global automatic power factor controller market have been analyzed.
- All the percentage splits and segment breakdown of the market is based on secondary and primary research.
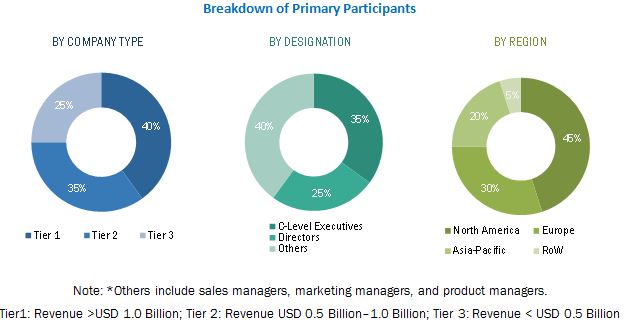
The figure below shows the breakdown of primaries on the basis of company types, designations, and regions conducted during the research study.
To know about the assumptions considered for the study, download the pdf brochure
Market Ecosystem:
The APFC ecosystems comprises of key manufacturers, such as Eaton Corporation (Ireland), EPCOS AG (Germany), and Larsen & Turbo (India) among others; APFC panels manufacturers includes ABB Ltd. (Switzerland), General Electric (U.S.), Schneider Electric (France), ON Semiconductor (U.S.), and STMicroelectronics (Switzerland) among others, of microprocessors, displays, capacitors, and other components .
The Target Audience:
- APFC device manufactures
- Software developers
- Research organizations and consulting companies
- Associations, forums, and alliances related to power factor correction
- Investors
- Key players ABB Ltd. (Switzerland), General Electric (U.S.), Schneider Electric SE (France), ON Semiconductor Corporation (U.S.), STMicroelectronics N.V. (Switzerland), and so on.
“Study answers several questions for the target audiences, primarily which market segments to focus in the next two to five years for prioritizing the efforts and investments.”
Scope of the Report:
This report categorizes the global automatic power factor controller market for automatic power factor controllers on the basis of type, component, , industry, and geography.
On the Basis of Type:
- Active APFCs
- Passive APFCs
On the Basis of Component:
- Relays
- Capacitors
- Displays
- Microcontrollers
- Switches
- Resistors
On the Basis of Industry:
- Manufacturing
- Utility
- Commercial
- Enterprise
- Military
On the Basis of Geographical Region:
-
North America
- U.S.
- Canada
- Mexico
-
Europe
- Germany
- U.K.
- France
- Rest of Europe (Spain, Ireland, Norway, Sweden, and Italy)
-
APAC
- China
- Japan
- India
- South Korea
- Rest of APAC (Australia, Malaysia, Indonesia, Thailand, and Singapore)
-
RoW
- Middle East and Africa
- South America
Available Customizations
With the given market data, MarketsandMarkets offers customizations according to the company’s specific needs. The following customization options are available for the report:
Company Information
- Detailed analysis and profiling of additional market players (up to 12)













Growth opportunities and latent adjacency in Automatic Power Factor Controller Market
I would like to receive a PDF Copy of your Report related to the Automatic Power Factor Controller Markets in India as well as the Global.
The organization used a lot of money as a compensation for paying monthly electric bill due to poor power factor. I do need a material support for designing, analysis, and controlling the Automatic power factor correction. Have you covered the materials and components of the same?
Will smart sensors or IoT/IIoT connected sensors or devices be used for automatic power factor controller market? Which is the leading type of APFCs?