Automotive Coolant & Lubricant Market by Vehicle Type (Passenger Car, LCV, & HCV), Application (Coolant-Engine & HVAC, Lubricant-Engine, Brake, & Transmission), Region & by Aftermarket - Global Trends & Forecast to 2019


[168 Pages Report] The market for coolant and lubricant is very huge and is anticipated to increase rapidly in terms of value at a CAGR of 7.38% and 9.21% for the period under consideration. The rapid increase in sales of vehicle in developing countries and development of infrastructure has created a strong demand for these coolants and lubricants, where the coolant contributes approximately 65% to the total coolant and lubricants market in terms of value.
The other drivers of lubricant and coolant market are the increasing demand for light passenger vehicles and heavy-duty vehicles, increasing prices of conventional fuels, and the rise in the average lifespan of vehicles in operation. In addition, stringent emission norms imposed by governments will also drive the lubricant and coolant markets for automotive. The adoption of bio-based lubricants which will reduce harmful environmental effects is the current trend and it will boost the overall growth of the market. The demand for fuel efficiency of vehicles has led to the replacement of traditional lubricants with synthetic lubricants.
This report classifies and defines sizes of the global automotive coolant and lubricant markets in terms of volume and value. Market size in terms of volume is provided in million gallons from 2012 to 2019, whereas the market value is provided in terms of $million.
The report also provides a comprehensive review of market drivers, restraints, opportunities, challenges, and key issues faced in the global automotive coolant and lubricant markets. The global automotive coolant and lubricant markets are dominated by a few major players, and contain several other small/medium players as well. Some of the key players are Sinopec Corporation (China), Royal Dutch Shell Plc (Netherland), Exxon Mobil Corporation (U.S.), BP Plc (U.K.), Total S.A. (France), Chevron Corporation (U.S.), and PETRONAS (Malaysia). The major strategies adopted by these key market players are geographic expansion and new product development.
Scope of the Report
In this research study, the global automotive coolant and lubricant markets are classified into four major segments
- Automotive Lubricant and Coolant Market, by Vehicle Type
- Passenger Car
- LCV
- HCV
- Automotive Lubricant and Coolant Market, By Application
- Engine coolant
- HVAC coolant
- Engine Lubricant
- Brake Lubricant
- Transmission lubricant
- Automotive Lubricant and Coolant Market, By Region
- Asia-Oceania
- China
- Japan
- South Korea
- India
- Europe
- Germany
- France
- U.K
- Italy
- North America
- U.S.
- Canada
- Mexico
- Rest of the World (RoW)
- Brazil
- Russia
- Asia-Oceania
Additional Customizations Available:
- Automotive Lubricant and Coolant Market, By Grade
- Automotive Lubricant and Coolant Market, Engine Oil Type
- Who Supplies Whom
- Additional Company Profiles
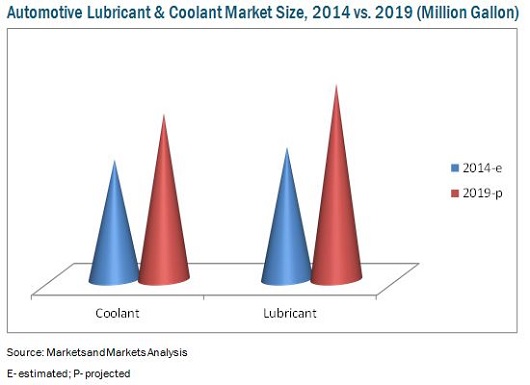
The sizes of the lubricant and coolant markets, in terms of volume, are projected to grow at a CAGR of 8.10% and 6.73% respectively from 2014 to 2019 and reach 408.48 Million gallon and 346.62 Million gallon by 2019.
Lubricant and coolant form an integral part of any vehicle. The increasing demand for light passenger vehicles and heavy-duty vehicles and the rising average lifespan of vehicles in operation are factors driving the demand for lubricant and coolant. In addition to this, growing vehicle sales and production in developing countries have created an opportunity for lubricant and coolant manufacturers.
The global market volume for lubricant and coolant is projected to reach 408.48 Million gallon and 346.62 Million gallon respectively by 2019. The markets for lubricant and coolant are estimated to be the largest in the Asia-Oceania region, which has a market share of about 52.1% and 50.0% for lubricant and coolant respectively in 2014. China is the major contributor to the growth of the lubricant and coolant markets in the Asia-Oceania region. The global demand for the lubricant and coolant markets are propelled by the increasing number of vehicles across the globe, the upcoming government regulations, and the increasing average lifespan of vehicles. North America is estimated to hold the second position in the markets for lubricant and coolant in 2014. A major contributor to these markets in the North American region is the U.S., which has the largest production of vehicles in this region.
On the basis of vehicle types, the passenger cars segment of the lubricant and coolant markets accounted for the maximum share, followed by light commercial vehicles and heavy commercial vehicles in 2014.
The global lubricant and coolant markets are dominated by major players such as Royal Dutch Shell (Netherlands), Chevron Corporation (U.S.), Total S.A. (France), and Exxon Mobil Corp. (U.S.).
 Exclusive indicates content/data unique to MarketsandMarkets and not available with any competitors.
Table of Contents
1 Introduction (Page No. - 14)
1.1 Objectives of the Study
1.2 Market Definition
1.3 Market Scope
1.3.1 Markets Covered
1.3.2 Years Considered in the Report
1.4 Currency & Pricing
1.5 Package Size
1.6 Limitations
1.7 Stakeholders
2 Research Methodology (Page No. - 17)
2.1 Automotive Coolant & Lubricant Markets
2.2 Market Size Estimation
2.3 Key Industry Insights
2.4 Breakdown of Primary Interviews: By Company Type, Designation, & Region
2.5 Market Breakdown & Data Triangulation
2.6 Market Share Estimation
2.6.1 Key Data From Secondary Sources
2.6.2 Key Data From Primary Sources
2.6.3 Assumptions
3 Executive Summary (Page No. - 25)
4 Premium Insights (Page No. - 30)
4.1 Automotive Coolant Market Overview
4.2 Automotive Lubricant Market Overview
4.3 Attractive Opportunities in the Automotive Coolant & Lubricant Markets
4.4 Global Market Outlook for the Automotive Coolant & Lubricant Markets, By Key Countries
4.5 Global Market Outlook for the Automotive Coolant & Lubricant Markets, By Key Application
4.6 Global Market Outlook for the Automotive Coolant & Lubricant Markets, By Vehicle Type
4.7 Global Market Outlook for the Automotive Coolant & Lubricant Markets, By Aftermarket
4.8 Life Cycle Analysis, By Region
5 Market Overview (Page No. - 38)
5.1 Introduction
5.2 Market Segmentation
5.2.1 By Application
5.2.2 By Vehicle Type
5.2.3 By Region
5.2.4 Aftermarket
5.3 Types of Lubricants
5.4 Market Dynamics
5.4.1 Drivers
5.4.1.1 Increasing Demand for Light Passenger Vehicles and Heavy- Duty Vehicles
5.4.1.2 Rise in Average Age of Vehicles in Operation
5.4.1.3 Government Legislations for Automotive Coolant and Lubricant
5.4.2 Restraints
5.4.2.1 Volatile Price of Raw Materials
5.4.3 Opportunities
5.4.3.1 Partnerships Between Major Automakers and Domestic Players
5.4.3.2 Growing Vehicle Sales and Production in Developing Countries
5.4.4 Challenges
5.4.4.1 Increasing Engine Downsizing in Passenger Car Segment
5.5 Burning Issue
5.5.1 Stringent Co2 Targets are Boosting Electric Vehicles
6 Industry Trends (Page No. - 50)
6.1 Introduction
6.2 Value Chain Analysis
6.3 Porter�s Five Forces Analysis
6.3.1 Threat of New Entrants
6.3.2 Threat of Substitutes
6.3.3 Bargaining Power of Suppliers
6.3.4 Bargaining Power of Buyers
6.3.5 Intensity of Rivalry
6.4 Pest Analysis
6.4.1 Political Factors
6.4.2 Economic Factors
6.4.3 Social Factors
6.4.4 Technological Factors
7 Automotive Coolant & Lubricant Markets, By Application* (Page No. - 57)
(*Note: the Coolant and Lubricant Market By Application is Covered at Regional Level (North America, Asia-Oceania, Europe, and RoW))
7.1 Introduction
7.2 Engine Coolant
7.3 HVAC Coolant
7.4 Engine Lubricant
7.5 Brake Lubricant
7.6 Transmission Lubricant
8 Automotive Coolant & Lubricant Markets, By Vehicle Type* (Page No. - 67)
(*Note: the Coolant and Lubricant Market By Vehicle Type is Represented By Application (Engine Coolant, HVAC Coolant, Engine Oil, Transmission Oil, and Brake Oil) for All Vehicle Type Considered in the Study )
8.1 Introduction
8.2 Passenger Car (PC)
8.3 Light Commercial Vehicle (LCV)
8.4 Heavy Commercial Vehicle (HCV)
9 Geographic Analysis* (Page No. - 76)
(*Note: the Coolant and Lubricant Market is Covered at Country Level and the Representation of Data is By Vehicle Type (Passenger Car, LCV and HCV) for Both the Applications (Coolant and Lubricant))
9.1 Introduction
9.2 North America
9.2.1 U.S.
9.2.2 Canada
9.2.3 Mexico
9.3 Asia-Oceania
9.3.1 China
9.3.2 Japan
9.3.3 South Korea
9.3.4 India
9.4 Europe
9.4.1 Germany
9.4.2 France
9.4.3 U.K.
9.4.4 Italy
9.5 Rest of the World (RoW)
9.5.1 Brazil
9.5.2 Russia
10 Automotive Coolant and Lubricant Aftermarket* (Page No. - 109)
(*Note: the Coolant and Lubricant Market is Covered at Regional Level and the Representation of Data is at Application Level (Engine Coolant, HVAC Coolant, Engine Oil, Transmission Oil, and Brake Oil))
10.1 Introduction
10.2 Engine Coolant
10.3 HVAC Coolant
10.4 Engine Oil
10.5 Transmission Lubricant
10.6 Brake Lubricant
11 Competitive Landscape (Page No. - 115)
11.1 Overview
11.2 Market Share Analysis
11.3 Competitive Situation and Trends
11.4 Battle for Market Share: Expansion Was the Key Strategy
11.5 New Product Launches
11.6 Agreements,Partnerships, Collaborations, & Joint Ventures
11.7 Mergers & Acquisitions
11.8 Expansions
11.9 Supply Contracts
12 Company Profiles (Page No. - 125)
(Company at A Glance, Recent Financials, Products & Services, Strategies & Insights, & Recent Developments)*
12.1 Introduction
12.2 Royal Dutch Shell PLC
12.3 British Petroleum PLC
12.4 Exxon Mobil Corporation
12.5 Chevron Corporation
12.6 Total S.A.
12.7 Lukoil OAO
12.8 JX Holdings, Inc.
12.9 Petronas
12.10 Sinopec Corporation
12.11 Idemitsu Kosan Company Ltd.
*Details on Company at A Glance, Recent Financials, Products & Services, Strategies & Insights, & Recent Developments Might Not Be Captured in Case of Unlisted Companies.
13 Appendix (Page No. - 164)
13.1 Available Customizations
13.1.1 Automotive Coolant and Lubricant Market, By Grade
13.1.4 Automotive Coolant and Lubricant Market, Engine Oil Type
13.1.4.1 Synthetic
13.1.4.2 Semi-Synthetic
13.1.4.3 Organic
13.1.3 Who Supplies to Whom
13.1.2 Additional Company Profiles
13.2 Insights of Key Industry Experts
13.3 Discussion Guide
13.4 Introducing RT: Real Time Market Intelligence
13.5 Related Reports
List of Tables (81 Tables)
Table 1 Global Automotive Coolant Market Size, By Region, 2012-2019 (Million Gallon)
Table 2 Global Automotive Coolant Market Size By, By Region, 2012-2019 ($Million)
Table 3 Global Automotive Lubricant Market Size , By Region, 2012-2019 (Million Gallon)
Table 4 Global Automotve Lubricant Market Size By, By Region, 2012-2019 ($Million)
Table 5 U.S.: Automotive Coolant, Market Size , By Vehicle Type , 2012-2019 (Million Gallon)
Table 6 U.S.: Automotive Coolant Market Size , By Vehicle Type, 2012-2019 ($Million)
Table 7 U.S.: Automotive Lubricant Market Size , By Vehicle Type, 2012-2019 (Million Gallon)
Table 8 U.S.: Automotive Lubricant Market Size , By Vehicle Type, 2012-2019 ($Million)
Table 9 Mexico: Automotive Coolant Market Size , By Vehicle Type, 2012-2019 (Million Gallon)
Table 10 Mexico: Automotive Coolant Market Size , By Vehicle Type, 2012-2019 ($Million)
Table 11 Mexico: Automotive Lubricant Market Size, By Vehicle Type, 2012-2019 (Million Gallon)
Table 12 Mexico: Automotive Lubricant Market Size, By Vehicle Type, 2012-2019 ($Million)
Table 13 Canada: Automotive Coolant Market Size, By Vehicle Type, 2012-2019 (Million Gallon)
Table 14 Canada: Automotive Coolant Market Size, By Vehicle Type, 2012-2019 ($Million)
Table 15 Canada: Automotive Lubricant Market Size, By Vehicle Type, 2012-2019 (Million Gallon)
Table 16 Canada: Automotive Lubricant Market Size, By Vehicle Type, 2012-2019 ($Million)
Table 17 Germany: Automotive Coolant Market Size , By Vehicle Type, 2012-2019 (Million Gallon)
Table 18 Germany: Automotive Coolant Market Size , By Vehicle Type, 2012-2019 ($Million)
Table 19 Germany: Automotive Lubricant Market Size , By Vehicle Type, 2012-2019 (Million Gallon)
Table 20 Germany: Automotive Lubricant Market Size , By Vehicle Type, 2012-2019 ($Million)
Table 21 U.K.: Automotive Coolant Market Size , By Vehicle Type, 2012-2019 (Million Gallon)
Table 22 U.K.: Automotive Coolant Market Size , By Vehicle Type, 2012-2019 ($Million)
Table 23 U.K.: Automotive Lubricantarket Size , By Vehicle Type, 2012-2019 (Million Gallon)
Table 24 U.K.: Automotive Lubricant Market Size , By Vehicle Type, 2012-2019 ($Million)
Table 25 France: Automotive Coolant Market Size, By Vehicle Type, 2012-2019 (Million Gallon)
Table 26 France: Automotive Coolant Market Size , By Vehicle Type, 2012-2019 ($Million)
Table 27 France: Automotive Lubricant Market Size , By Vehicle Type, 2012-2019 (Million Gallon)
Table 28 France: Automotive Lubricant Market Size , By Vehicle Type, 2012-2019 ($Million)
Table 29 Italy: Automotive Coolant Market Size , By Vehicle Type, 2012-2019 (Million Gallon)
Table 30 Italy: Automotive Coolant Market Size, By Vehicle Type, 2012-2019 ($Million)
Table 31 Italy: Automotive Lubricant Market Size, By Vehicle Type, 2012-2019 (Million Gal)
Table 32 Italy: Automotive Lubricant Market Size, By Vehicle Type, 2012-2019 ($Million)
Table 33 China: Automotive Coolant Market Size, By Vehicle Type, 2012-2019 (Million Gallon)
Table 34 China: Automotive Coolant Market Size, By Vehicle Type, 2012-2019 ($Million)
Table 35 China: Automotive Lubricant Market Size , By Vehicle Type, 2012-2019 (Million Gallon)
Table 36 China: Automotive Lubricant Market Size, By Vehicle Type, 2012-2019 ($Million)
Table 37 India: Automotive Coolant Market Size, By Vehicle Type, 2012-2019 (Million Gallon)
Table 38 India: Automotive Coolant Market Size , By Vehicle Type, 2012-2019 ($Million)
Table 39 India: Automotive Lubricant Market Size, By Vehicle Type, 2012-2019 (Million Gallon)
Table 40 India: Automotive Lubricant Market Size, By Vehicle Type, 2012-2019 ($Million)
Table 41 Japan: Automotive Coolant Market Size , By Vehicle Type, 2012-2019 (Million Gallon)
Table 42 Japan: Automotive Coolant Market Size , By Vehicle Type, 2012-2019 ($Million)
Table 43 Japan: Automotive Lubricant Market Size , By Vehicle Type, 2012-2019 (Million Gallon)
Table 44 Japan: Automotive Lubricant Market Size , By Vehicle Type, 2012-2019 ($Million)
Table 45 South Korea: Automotive Coolant Market Size, By Vehicle Type, 2012-2019 (Million Gallon)
Table 46 South Korea: Automotive Coolant Market Size, By Vehicle Type, 2012-2019 ($Million)
Table 47 South Korea: Automotive Lubricant Market Size, By Vehicle Type, 2012-2019 (Million Gallon)
Table 48 South Korea: Automotive Lubricant Market Size, By Vehicle Type, 2012-2019 ($Million)
Table 49 Global: Automotive Coolant Market Size, By Vehicle Type, 2012-2019 (Million Gallon)
Table 50 Global: Automotive Lubricant Market Size, By Vehicle Type, 2012-2019 (Million Gallon)
Table 51 Passenger Car: Automotive Coolant Market Size, By Application Type, 2012-2019 (Million Gallon)
Table 52 Passenger Car: Automotive Lubricant Market Size, By Application Type, 2012-2019 (Million Gallon)
Table 53 Light Commercial Vehicle: Automotive Coolant Market Size, By Application Type, 2012-2019 (Million Gallon)
Table 54 Light Commercial Vehicle: Automotive Lubricant Market Size, By Application Type, 2012-2019 (Million Gallon)
Table 55 Heavy Commercial Vehicle: Automotive Coolant Market Size, By Application Type, 2012-2019 (Million Gallon)
Table 56 Heavy Commercial Vehicle: Automotive Lubricant Market Size, By Application Type, 2012-2019 (Million Gallon)
Table 57 Global: Automotive Coolant Market Size, By Application Type, 2012-2019 (Million Gallon)
Table 58 Global: Automotive Coolant Market Size, By Application Type, 2012-2019 ($Million)
Table 59 Global: Automotive Lubricant Market Size, By Application Type, 2012-2019 (Million Gallon)
Table 60 Global: Automotive Lubricant Market Size, By Application Type, 2012-2019 ($Million)
Table 61 Engine Coolant: Automotive Coolant Market Size, By Region, 2012-2019 (Million Gallon)
Table 62 Engine Coolant: Automotive Coolant Market Size, By Region, 2012-2019 ($Million)
Table 63 HVAC Coolant: Automotive Coolant Market Size, By Region, 2012-2019 (Million Gallon)
Table 64 HVAC Coolant: Automotive Coolant Market Size, By Region, 2012-2019 ($Million)
Table 65 Engine Lubricant: Automotive Lubricant Market Size, By Region, 2012-2019 (Million Gallon)
Table 66 Engine Lubricant: Automotive Lubricant Market Size, By Region, 2012-2019 ($Million)
Table 67 Brake Lubricant: Automotive Lubricant Market Size, By Region, 2012-2019 (Million Gallon)
Table 68 Brake Lubricant: Automotive Lubricant Market Size, By Region, 2012-2019 ($Million)
Table 69 Transmission Lubricant: Automotive Lubricant Market Size, By Region, 2012-2019 (Million Gallon)
Table 70 Transmission Lubricant: Automotive Lubricant Market Size, By Region, 2012-2019 ($Million)
Table 71 Global: Automotive Coolant Aftermarket Size, By Region, 2012-2019 (Million Gallon)
Table 72 Global: Automotive Lubricant Aftermarket Size, By Region, 2012-2019 (Million Gallon)
Table 73 Engine Coolant: Automotive Coolant Aftermarket Size, By Region, 2012-2019 (Million Gallon)
Table 74 HVAC Coolant: Automotive Coolant Aftermarket Size, By Region, 2012-2019 (Million Gallon)
Table 75 Engine Lubricnat: Automotive Lubricant Aftermarket Size, By Region, 2012-2019 (Million Gallon)
Table 76 Brake Lubricant: Automotive Lubricant Aftermarket Size, By Region, 2012-2019 (Million Gallon)
Table 77 Transmission Lubricant: Automotive Lubricant Aftermarket Size, By Region, 2012-2019 (Million Gallon)
Table 78 New Product Launches, 2011�2014
Table 79 Agreement/Partnership/Collaborations/Joint Ventures/Supply Contracts, 2012-2019
Table 80 Mergers and Acquisitions, 2012-2019
Table 81 Expansions, 2011-2014
List of Tables (50 Figures)
Figure 1 Global Automotive Coolant and Lubricant Market: Research Methodology
Figure 2 Market Size Estimation Methodology: Bottom-Up Approach
Figure 3 Breakdown of Primary Interviews: By Company Type, Designation, & Region
Figure 4 Automotive Coolant and Lubricant: Data Triangulation Procedure
Figure 5 Automotive Coolant and Lubricant Market Snapshot (2014 vs. 2019)
Figure 6 Automotive Coolant and Lubricant Market Share (Volume), By Region, 2014
Figure 7 Automotive Coolant and Lubricant Market Size, By Region, Vehicle Type, & Application Type Snapshot (2014)
Figure 8 Attractive Market Opportunities in Coolant and Lubricant Market
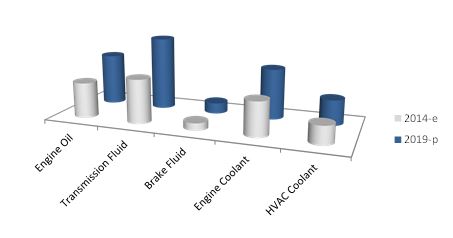
Figure 9 Engine Coolant and Transmission Fluid are the Fastest Growing Coolant and Lubricant Respectively in the Automotive Coolant and Lubricant Market
Figure 10 China Commands Over the Maximum Market for Automotive Coolants and Lubricants
Figure 11 Automotive Coolant and Lubricant Market, By Vehicle Type
Figure 12 Product Life Cycle of Automotive Coolant and Lubricant Market
Figure 13 Passenger Cars and Commercial Vehicles Sales From 2008-2013
Figure 14 Crude Oil Prices From 2008-2013
Figure 15 China has the Highest Production of Vehicles in 2013 Amongst the Developing Countries
Figure 16 Automotive Coolant and Lubricant Market Segmentation
Figure 17 Increasing Demand of Passenger Cars and Commercial Vehicles Globally Will Spur the Demand for Automotive Coolants and Lubricants
Figure 18 Value Chain Analysis: Major Value is Added During Manufacturing Phase
Figure 19 Porter's Five Forces Analysis (2013):
Figure 20 Automotive Coolant and Lubricant Market: Rapidly Growing Regions
Figure 21 Automotive Coolant and Lubricant Market, By Region
Figure 22 Automotive Coolant and Lubricant Market, By Key Country
Figure 23 Automotive Coolant and Lubricant Market, By Application Type
Figure 24 Market Segmentation: By Application Type
Figure 25 Market Segmentation: By Vehicle Type
Figure 26 Market Segmentation: By Region
Figure 27 Geographic Snapshot (2014)
Figure 28 Asia-Oceania Market Snapshot (2014): Largest Market for Automotive Coolant and Lubricant
Figure 29 North America Market Snapshot (2014): Projected to Grow at the Highest CAGR Between 2014 & 2019
Figure 30 Automotive Coolant and Lubricant Market Trend, By Vehicle Type, 2012-2019 ($Million)
Figure 31 Passenger Cars: Coolant and Lubricant Market Size, By Region & Application Type, 2014 vs. 2019 ($Million)
Figure 32 LCV: Coolant and Lubricant Market Size, By Region & Application Type, 2014 vs. 2019 ($Million)
Figure 33 HCV: Coolant and Lubricant Market Size, By Region & Application Type, 2014 vs. 2019 ($Million)
Figure 34 Automotive Coolant and Lubricant Market Trend, By Application Type & Region, 2012-2019 ($Million)
Figure 35 Companies Adopted Ex[Pansions as the Key Growth Strategy Over the Last Four Years
Figure 36 Sinopec Corporation Grew at the Highest Rate Between 2010 and 2013
Figure 37 Automotive Coolant and Lubricant Market Share, By Key Player, 2013
Figure 38 Market Evolution Framework - Significant Expansions Increased the Global Market Size Between 2012 & 2014
Figure 39 Geographic Revenue Mix of Top 5 Players
Figure 40 Competitive Benchmarking of Key Players (2008-2013)
Figure 41 Royal Dutch Shell PLC: Business Overview
Figure 42 BP PLC: Business Overview
Figure 43 Exxon Mobil Corporation: Business Overview
Figure 44 Chevron Corporation: Business Overview
Figure 45 Total S.A.: Business Overview
Figure 46 Petronas: Business Overview
Figure 47 Lukoil OAO: Business Overview
Figure 48 JX Holdings, Inc..: Business Overview
Figure 49 Sinope Corporation..: Business Overview
Figure 50 Idemitsu Kosan Co. Ltd..: Business Overview


Growth opportunities and latent adjacency in Automotive Coolant & Lubricant Market