Antifreeze/Coolant Market by Application (Automotive, Industrial), Base Fluid (Ethylene Glycol, Propylene Glycol and Glycerine), Technology, Regions (North America, Europe, APAC, Middle East & Africa, and South America) - Global Forecast to 2025


Updated on : June 18, 2024
Antifreeze Coolant Market
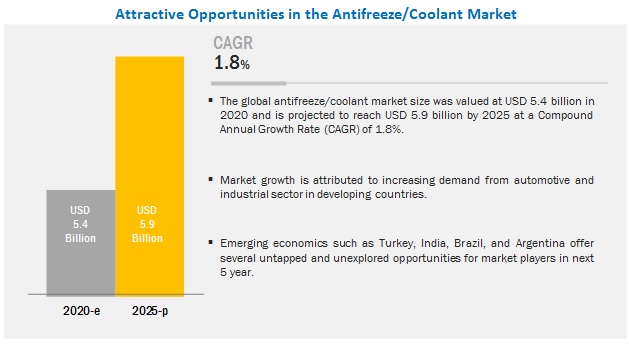
The global antifreeze coolant market was valued at USD 5.4 billion in 2020 and is projected to reach USD 5.9 billion by 2025, growing at 1.8% cagr from 2020 to 2025. The global industry will be driven primarily by the increasing number of vehicles in operation worldwide. The growth in the HVAC systems and construction equipment industry are the other key factors contributing to the growth of the market.
The automotive segment is projected to lead the antifreeze/coolant market from 2020 to 2025.
Based on application, the automotive segment is projected to be the largest market for antifreeze/coolant. The number of vehicles in operation at the global level is one of the factors driving the antifreeze/coolant market. This growth in the automotive sector can be attributed to growing population, improved socio-economic conditions, emerging economies, expanding e-commerce industry, improved infrastructure, increasing vehicle fleet, and others. The growth of the automotive engine coolant market is directly related to the increase in the number of motor vehicles operating and total miles driven per year, as they play a mandatory role in the engine cooling system of a vehicle.
Ethylene glycol segment is projected to lead the overall antifreeze/coolant market from 2020 to 2025.
Based on Base fluid, the ethylene glycol segment is estimated to be the largest segment in the antifreeze/coolant market. Growth of ethylene glycol as a base fluid for antifreeze/coolants is primarily attributed because of its cost-effectiveness and ability to be used in all climatic conditions making it the most preferred base fluid across the globe. It is used as antifreeze in automotive engine cooling and is also used in many industrial cooling applications. Recycling of ethylene glycol from processes such as distillation, reverse osmosis, and ion exchange is also gradually making its mark for utilization as an engine coolant.
The OAT segment dominates the overall antifreeze/coolant market.
Based on technology, the OAT (organic acid technology) segment is expected to be the largest segment in the antifreeze/coolant market. OAT technology is projected to have significant growth opportunities by 2025. Organic acid technology (OAT) is based primarily on carbon-based molecules, typically organic acids, to protect cooling system components. This technology has life of about 5 years or 250,000 km in automotive applications if. The technology is generally safe for both aluminum engines and rubber parts.
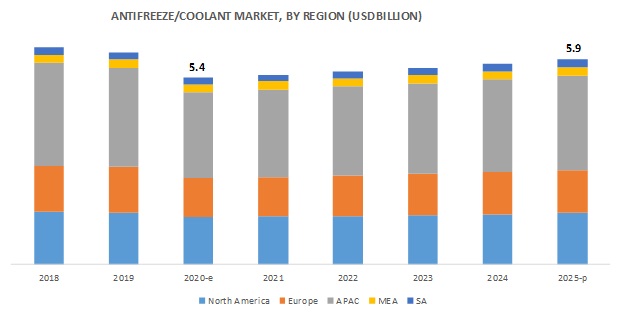
APAC is estimated to account for the highest share in the global antifreeze/coolant market during the forecast period.
The APAC region accounted for the largest market share in 2019. Growth in the automotive and manufacturing sector offers a constantly evolving and lucrative market opportunity for the antifreeze/coolant market in APAC. The rising income levels, developing transport infrastructure, growing ambition to own private vehicles, increasing mobility, and increasing demand for goods carriers from micro, small & medium-size enterprises are fueling the demand for antifreeze/coolant in the APAC region.
Antifreeze Coolant Market Players
The global antifreeze/coolants market comprises major manufacturers, such as BP Plc (UK), ExxonMobil Corporation (US), Royal Dutch Shell Plc (Netherland), Chevron Corporation (US), Total S.A. (France), BASF SE (Germany), and LUKOIL (Russia).
BP Plc. has a strong brand name across the value chain of the oil & gas industry. The company had to bear huge losses because of the environmental lawsuits against it after the Gulf of Mexico spill. The company was able to surpass all the losses because of its huge upstream assets. The vertical integration of the company is a major reason for the huge growth. BP Plc. has a strong presence across the globe and is highly focused on OEM contracts for the supply of lubricants. The company provides coolants under the lubricant business segments, and Castrol is the flagship lubricant brand of the company that has a vast product line and caters to a wide range of industries such as automotive, industrial, marine, and energy markets. In order to meet its growth target, the company is focusing on enhancing its lubricant market reach by entering into partnerships with other companies. Castrol is one of the leading brands in the world. The company capitalizes its market share by creating a high brand value of the product.
Antifreeze Coolant Market Report Scope
|
Report Metric |
Details |
|
Market Size Value in 2020 |
USD 5.4 billion |
|
Revenue Forecast in 2025 |
USD 5.9 billion |
|
CAGR |
1.8% |
|
Market size available for years |
2018–2025 |
|
Base year considered |
2019 |
|
Forecast period |
2020–2025 |
|
Forecast units |
Value (USD Million) and Volume (Million Gallons) |
|
Segments covered |
Base Fluid, technology, application, and region |
|
Geographies covered |
North America, Asia Pacific, Europe, Middle East & Africa, and South America |
|
Companies covered |
BP Plc (UK), Royal Dutch Shell Plc. (Netherlands), Chevron Corporation (US), ExxonMobil Corporation (US), Total S.A.(France), LUKOIL (Russia), Petronas (Malaysia), BASF (Germany), Valvoline Inc. (US), and Cummins Inc. (US) |
This research report categorizes the antifreeze/coolant market based on base fluid, technology, application, and region.
Antifreeze coolant market, by base fluid:
- EG
- PG
- Glycerine
Antifreeze coolant market, by technology:
- OAT
- HOAT
- IAT
Antifreeze coolant, by application:
- Automotive
- Industrial
- Others (aerospace and electronics)
Antifreeze coolant market, by region:
- North America
- Europe
- Asia Pacific
- Middle East & Africa
- South Africa
Recent Developments
- In December 2019, Chevron Australia Downstream Pty Ltd., a wholly-owned subsidiary of Chevron Corporation, signed a conditional Share Sale Agreement with Puma Energy Asia Pacific B.V. with the aim to acquire all the shares and equity interests of Puma Energy (Australia) Holdings Pty Ltd. for USD 291 million (AU$425 million).
- In May 2019, Chevron Corporation entered into a definitive agreement with Anadarko Petroleum Corporation to acquire all of the outstanding shares of Anadarko in a stock and cash transaction valued at USD 33 billion. This acquisition of Anadarko will significantly enhance Chevron’s upstream portfolio and further strengthen its leading positions in large shale and natural gas resource basins.
- In June 2018, ExxonMobil Corporation acquired PT Federal Karyatama (FKT), a leading manufacturer of motorcycle lubricants in Indonesia. This acquisition includes the manufacturing plant at Cilegon, Indonesia. This strategic initiative will strengthen the company’s lubricant business and enhance Mobil's brand presence in the growing Indonesian market.
Key Questions Addressed by the Report:
- What are the global trends in the antifreeze/coolant market? Would the market witness an increase or decline in the demand in the coming years?
- What is the estimated demand for the different types of antifreeze/coolant?
- Where will the strategic developments take the industry in the mid to long-term?
- What are the upcoming industry regulations and trends for the antifreeze/coolant market?
- Who are the major players in the antifreeze/coolant market globally?
To speak to our analyst for a discussion on the above findings, click Speak to Analyst
 Exclusive indicates content/data unique to MarketsandMarkets and not available with any competitors.
TABLE OF CONTENTS
1 INTRODUCTION (Page No. - 19)
1.1 OBJECTIVES OF THE STUDY
1.2 MARKET DEFINITION
1.3 SCOPE OF THE STUDY
1.3.1 MARKETS COVERED
1.3.2 REGIONAL SCOPE
1.4 YEARS CONSIDERED FOR THE STUDY
1.5 CURRENCY CONSIDERED FOR THE STUDY
1.6 UNITS CONSIDERED FOR THE STUDY
1.7 STAKEHOLDERS
1.8 SUMMARY OF CHANGES
2 RESEARCH METHODOLOGY (Page No. - 23)
2.1 RESEARCH DATA
2.2 MARKET SIZE ESTIMATION
2.2.1 APPROACH 1(BASED ON BASE FLUID, BY REGION)
2.2.2 APPROACH 2 (BASED ON AUTOMOTIVE PRODUCTION DATA)
2.3 DATA TRIANGULATION
2.4 KEY MARKET INSIGHTS
2.5 RESEARCH ASSUMPTIONS & LIMITATIONS
2.5.1 ASSUMPTIONS
2.5.2 LIMITATIONS
3 EXECUTIVE SUMMARY (Page No. - 29)
4 PREMIUM INSIGHTS (Page No. - 33)
4.1 ATTRACTIVE OPPORTUNITIES IN THE ANTIFREEZE/ COOLANT MARKET
4.2 ASIA PACIFIC: ANTIFREEZE/COOLANT MARKET, BY BASE FLUID AND COUNTRY
4.3 ANTIFREEZE/COOLANT MARKET, BY BASE FLUID
4.4 ANTIFREEZE/COOLANT MARKET, BY TECHNOLOGY
4.5 ANTIFREEZE/COOLANT MARKET, BY APPLICATION
4.6 ANTIFREEZE/COOLANT MARKET, BY COUNTRY
5 MARKET OVERVIEW (Page No. - 36)
5.1 INTRODUCTION
5.2 MARKET DYNAMICS
5.2.1 DRIVERS
5.2.1.1 Increase in number of vehicles in operation driving the demand for antifreeze/coolant
5.2.1.2 Growing sales of construction equipment fueling consumption of antifreeze/coolants
5.2.1.3 Growth in demand for HVAC systems
5.2.2 RESTRAINTS
5.2.2.1 Introduction of coolants with long service life
5.2.2.2 Increasing trend of engine downsizing
5.2.2.3 Phase-change materials and air-cooling based battery thermal management system in electric and hybrid vehicles
5.2.3 OPPORTUNITIES
5.2.3.1 Battery thermal management using liquid cooling systems in electric and hybrid vehicles
5.2.4 CHALLENGES
5.2.4.1 Volatile price of raw material
5.2.4.2 Recycling of antifreeze/coolant
5.3 TECHNOLOGICAL ANALYSIS
5.3.1 IAT (INORGANIC ACID TECHNOLOGY)
5.3.2 OAT (ORGANIC ACID TECHNOLOGY)
5.3.3 HOAT (HYBRID ORGANIC ACID TECHNOLOGY)
5.3.4 ADVANTAGES/DISADVANTAGES OF TECHNOLOGIES
5.3.5 TECHNOLOGIES AND USAGE OF CORROSION INHIBITORS DRIVEN BY REGIONAL PREFERENCE AND ENGINE SPECIFICATION
5.4 VALUE CHAIN ANALYSIS.
5.4.1 INTRODUCTION
5.4.2 RAW MATERIALS
5.4.3 MANUFACTURING
5.4.4 DISTRIBUTION & END-USE
5.5 ANTIFREEZE/COOLANT PATENT ANALYSIS
6 IMPACT OF COVID-19 ON ANTIFREEZE/COOLANT MARKET (Page No. - 48)
7 ANTIFREEZE/COOLANT MARKET, BY BASE FLUID (Page No. - 49)
7.1 INTRODUCTION
7.2 ETHYLENE GLYCOL
7.3 PROPYLENE GLYCOL
7.4 GLYCERINE
8 ANTIFREEZE/COOLANT MARKET, BY APPLICATION (Page No. - 52)
8.1 INTRODUCTION
8.2 AUTOMOTIVE
8.3 INDUSTRIAL
8.4 OTHERS
9 ANTIFREEZE/COOLANT MARKET, BY TECHNOLOGY (Page No. - 56)
9.1 INTRODUCTION
10 ANTIFREEZE/COOLANT MARKET, BY REGION (Page No. - 59)
10.1 INTRODUCTION
10.2 ASIA PACIFIC
10.2.1 CHINA
10.2.1.1 Rising consumer spending will boost the demand for automobiles in the country
10.2.2 JAPAN
10.2.2.1 Japan accounts for second-largest market share of Asia Pacific antifreeze/coolant market
10.2.3 INDIA
10.2.3.1 Increasing demand from automobile and industrial sectors
10.2.4 THAILAND
10.2.4.1 Demand for glycerine based antifreeze/coolant to decline in Thailand
10.2.5 INDONESIA
10.2.5.1 EG to be fastest-growing segment of antifreeze coolant in Indonesia
10.2.6 PHILIPPINES
10.2.6.1 Increasing vehicle in use will drive the antifreeze/coolant market in Philippines
10.2.7 MALAYSIA
10.2.7.1 Malaysia witnessing growth in the manufacturing sector
10.2.8 VIETNAM
10.2.8.1 Vietnam estimated be the fastest-growing market antifreeze/coolant
10.2.9 REST OF APAC
10.3 NORTH AMERICA
10.3.1 US
10.3.1.1 EG to grow at a faster rate in the US
10.3.2 CANADA
10.3.2.1 Growing end-use industries expected to boost the demand for antifreeze/coolant in Canada
10.3.3 MEXICO
10.3.3.1 Growth in automotive industry driving the demand for antifreeze/coolant
10.4 EUROPE
10.4.1 GERMANY
10.4.1.1 Automotive sector creating growth opportunities for antifreeze/coolant market in Europe
10.4.2 FRANCE
10.4.2.1 Evolution in manufacturing and automotive industry increasing consumption of antifreeze/coolant
10.4.3 UK
10.4.3.1 UK’s strong economy fueling the market for antifreeze/coolant
10.4.4 ITALY
10.4.4.1 Large machinery and automotive industries driving demand for antifreeze/coolant
10.4.5 RUSSIA
10.4.5.1 Antifreeze/coolant market in Russia to grow at a moderate rate
10.4.6 REST OF EUROPE
10.5 MIDDLE EAST & AFRICA
10.5.1 SOUTH AFRICA
10.5.1.1 Growing demand from Automotive and HVAC industries will drive the market
10.5.2 TURKEY
10.5.2.1 Established crude oil refineries influencing the market positively
10.5.3 REST OF MIDDLE EAST & AFRICA
10.6 SOUTH AMERICA
10.6.1 BRAZIL
10.6.1.1 Exponential growth in the machinery production drive the market demand
10.6.2 ARGENTINA
10.6.2.1 Argentina accounted for the second-largest share in South America
10.6.3 REST OF SOUTH AMERICA
11 COMPETITIVE LANDSCAPE (Page No. - 108)
11.1 OVERVIEW
11.2 COMPETITIVE SCENARIO
11.2.1 ACQUISITION
11.2.2 EXPANSION
11.2.3 PARTNERSHIP
11.2.4 NEW PRODUCT LAUNCH
11.3 MARKET RANKING
11.4 COMPETITIVE LEADERSHIP MAPPING
11.4.1 STAR
11.4.2 EMERGING LEADERS
11.4.3 PERVASIVE
11.4.4 EMERGING COMPANIES
11.5 STRENGTH OF PRODUCT PORTFOLIO
11.6 BUSINESS STRATEGY EXCELLENCE
12 COMPANY PROFILES (Page No. - 117)
(Business Overview, financial Assessment, Operational Assessment, Products Offered, Recent Developments, SWOT Analysis, winning imperatives, Threat from Competition, right to win)*
12.1 BP PLC
12.2 ROYAL DUTCH SHELL PLC
12.3 CHEVRON CORPORATION
12.4 EXXONMOBIL CORPORATION
12.5 TOTAL S.A.
12.6 LUKOIL
12.7 PETRONAS
12.8 BASF SE
12.9 VALVOLINE INC.
12.10 CUMMINS INC.
12.11 MOTUL S.A.
12.12 OTHER PLAYERS
12.12.1 DOW INC.
12.12.2 DUPONT TATE & LYLE BIO PRODUCTS COMPANY, LLC.
12.12.3 PRODUCTS OFFERED
12.12.4 RECOCHEM INC.
12.12.5 PRESTONE PRODUCTS CORPORATION
12.12.6 HUNTSMAN CORPORATION
12.12.7 SINOPEC CORPORATION
12.12.8 CCI CORPORATION
12.12.9 EVANS COOLING SYSTEMS, INC.
12.12.10 KOST USA, INC.
*Details on Business Overview, financial Assessment, Operational Assessment, Products Offered, Recent Developments, SWOT Analysis, winning imperatives, Threat from Competition, right to win might not be captured in case of unlisted companies.
13 APPENDIX (Page No. - 167)
13.1 DISCUSSION GUIDE
13.2 KNOWLEDGE STORE: MARKETSANDMARKETS SUBSCRIPTION PORTAL
13.3 AVAILABLE CUSTOMIZATIONS
13.4 RELATED REPORTS
13.5 AUTHOR DETAILS
LIST OF TABLES (150 Tables)
TABLE 1 CORROSION INHIBITION ACCEPTABILITY, BY REGION
TABLE 2 ANTIFREEZE/COOLANT MARKET SIZE, BY BASE FLUID, 2018-2025 (USD MILLION)
TABLE 3 ANTIFREEZE/COOLANT MARKET SIZE, BY BASE FLUID, 2018-2025 (MILLION GALLONS)
TABLE 4 ANTIFREEZE/COOLANT MARKET SIZE, BY APPLICATION, 2018-2025 (USD MILLION)
TABLE 5 ANTIFREEZE/COOLANT MARKET SIZE, BY APPLICATION, 2018-2025 (MILLION GALLONS)
TABLE 6 WORLD MOTOR VEHICLE PRODUCTION 2019 (UNITS)
TABLE 7 ANTIFREEZE/COOLANT MARKET SIZE, BY TECHNOLOGY, 2018–2025 (USD MILLION)
TABLE 8 ANTIFREEZE/COOLANT MARKET SIZE, BY TECHNOLOGY, 2018–2025 (MILLION GALLONS)
TABLE 9 ANTIFREEZE/COOLANT MARKET SIZE, BY REGION, 2018-2025 (USD MILLION)
TABLE 10 ANTIFREEZE/COOLANT MARKET SIZE, BY REGION, 2018-2025 (MILLION GALLONS)
TABLE 11 ASIA PACIFIC: ANTIFREEZE/COOLANT MARKET SIZE, BY COUNTRY, 2018-2025 (USD MILLION)
TABLE 12 ASIA PACIFIC: ANTIFREEZE/COOLANT MARKET SIZE, BY COUNTRY, 2018-2025 (MILLION GALLONS)
TABLE 13 ASIA PACIFIC: ANTIFREEZE/COOLANT MARKET SIZE, BY BASE FLUID, 2018-2025 (USD MILLION)
TABLE 14 ASIA PACIFIC: ANTIFREEZE/COOLANT MARKET SIZE, BY BASE FLUID, 2018-2025 (MILLION GALLONS)
TABLE 15 ASIA PACIFIC: ANTIFREEZE/COOLANT MARKET SIZE, BY APPLICATION, 2018-2025 (USD MILLION)
TABLE 16 ASIA PACIFIC: ANTIFREEZE/COOLANT MARKET SIZE, BY APPLICATION, 2018-2025 (MILLION GALLONS)
TABLE 17 ASIA PACIFIC: ANTIFREEZE/COOLANT MARKET SIZE, BY TECHNOLOGY, 2018-2025 (USD MILLION)
TABLE 18 ASIA PACIFIC: ANTIFREEZE/COOLANT MARKET SIZE, BY TECHNOLOGY, 2018-2025 (MILLION GALLONS)
TABLE 19 CHINA: ANTIFREEZE/COOLANT MARKET SIZE, BY BASE FLUID, 2018-2025 (USD MILLION)
TABLE 20 CHINA: ANTIFREEZE/COOLANT MARKET SIZE, BY BASE FLUID, 2018-2025 (MILLION GALLONS)
TABLE 21 CHINA: ANTIFREEZE/COOLANT MARKET SIZE, BY APPLICATION, 2018-2025 (USD MILLION)
TABLE 22 CHINA: ANTIFREEZE/COOLANT MARKET SIZE, BY APPLICATION, 2018-2025 (MILLION GALLONS)
TABLE 23 JAPAN: ANTIFREEZE/COOLANT MARKET SIZE, BY BASE FLUID, 2018-2025 (USD MILLION)
TABLE 24 JAPAN: ANTIFREEZE/COOLANT MARKET SIZE, BY BASE FLUID, 2018-2025 (MILLION GALLONS)
TABLE 25 JAPAN: ANTIFREEZE/COOLANT MARKET SIZE, BY APPLICATION, 2018-2025 (USD MILLION)
TABLE 26 JAPAN: ANTIFREEZE/COOLANT MARKET SIZE, BY APPLICATION, 2018-2025 (MILLION GALLONS)
TABLE 27 INDIA: ANTIFREEZE/COOLANT MARKET SIZE, BY BASE FLUID, 2018-2025 (USD MILLION)
TABLE 28 INDIA: ANTIFREEZE/COOLANT MARKET SIZE, BY BASE FLUID, 2018-2025 (MILLION GALLONS)
TABLE 29 INDIA: ANTIFREEZE/COOLANT MARKET SIZE, BY APPLICATION, 2018-2025 (USD MILLION)
TABLE 30 INDIA: ANTIFREEZE/COOLANT MARKET SIZE, BY APPLICATION, 2018-2025 (MILLION GALLONS)
TABLE 31 THAILAND: ANTIFREEZE/COOLANT MARKET SIZE, BY BASE FLUID, 2018-2025 (USD MILLION)
TABLE 32 THAILAND: ANTIFREEZE/COOLANT MARKET SIZE, BY BASE FLUID, 2018-2025 (MILLION GALLONS)
TABLE 33 THAILAND: ANTIFREEZE/COOLANT MARKET SIZE, BY APPLICATION, 2018-2025 (USD MILLION)
TABLE 34 THAILAND: ANTIFREEZE/COOLANT MARKET SIZE, BY APPLICATION, 2018-2025 (MILLION GALLONS)
TABLE 35 INDONESIA: ANTIFREEZE/COOLANT MARKET SIZE, BY BASE FLUID, 2018-2025 (USD MILLION)
TABLE 36 INDONESIA: ANTIFREEZE/COOLANT MARKET SIZE, BY BASE FLUID, 2018-2025 (MILLION GALLONS)
TABLE 37 INDONESIA: ANTIFREEZE/COOLANT MARKET SIZE, BY APPLICATION, 2018-2025 (USD MILLION)
TABLE 38 ANTIFREEZE/COOLANT MARKET SIZE, BY APPLICATION, 2018-2025 (MILLION GALLONS)
TABLE 39 PHILIPPINES: ANTIFREEZE/COOLANT MARKET SIZE, BY BASE FLUID, 2018-2025 (USD MILLION)
TABLE 40 PHILIPPINES: ANTIFREEZE/COOLANT MARKET SIZE, BY BASE FLUID, 2018-2025 (MILLION GALLONS)
TABLE 41 PHILIPPINES: ANTIFREEZE/COOLANT MARKET SIZE, BY APPLICATION, 2018-2025 (USD MILLION)
TABLE 42 PHILIPPINES: ANTIFREEZE/COOLANT MARKET SIZE, BY APPLICATION, 2018-2025 (MILLION GALLONS)
TABLE 43 MALAYSIA: ANTIFREEZE/COOLANT MARKET SIZE, BY BASE FLUID, 2018-2025 (USD MILLION)
TABLE 44 MALAYSIA: ANTIFREEZE/COOLANT MARKET SIZE, BY BASE FLUID, 2018-2025 (MILLION GALLONS)
TABLE 45 MALAYSIA: ANTIFREEZE/COOLANT MARKET SIZE, BY APPLICATION, 2018-2025 (USD MILLION)
TABLE 46 MALAYSIA: ANTIFREEZE/COOLANT MARKET SIZE, BY APPLICATION, 2018-2025 (MILLION GALLONS)
TABLE 47 VIETNAM: ANTIFREEZE/COOLANT MARKET SIZE, BY BASE FLUID, 2018-2025 (USD MILLION)
TABLE 48 VIETNAM: ANTIFREEZE/COOLANT MARKET SIZE, BY BASE FLUID, 2018-2025 (MILLION GALLONS)
TABLE 49 VIETNAM: ANTIFREEZE/COOLANT MARKET SIZE, BY APPLICATION, 2018-2025 (USD MILLION)
TABLE 50 VIETNAM: ANTIFREEZE/COOLANT MARKET SIZE, BY APPLICATION, 2018-2025 (MILLION GALLONS)
TABLE 51 REST OF APAC: ANTIFREEZE/COOLANT MARKET SIZE, BY BASE FLUID, 2018-2025 (USD MILLION)
TABLE 52 REST OF APAC: ANTIFREEZE/COOLANT MARKET SIZE, BY BASE FLUID, 2018-2025 (MILLION GALLONS)
TABLE 53 REST OF APAC: ANTIFREEZE/COOLANT MARKET SIZE, BY APPLICATION, 2018-2025 (USD MILLION)
TABLE 54 REST OF APAC: ANTIFREEZE/COOLANT MARKET SIZE, BY APPLICATION, 2018-2025 (MILLION GALLONS)
TABLE 55 NORTH AMERICA: ANTIFREEZE/COOLANT MARKET SIZE, BY COUNTRY, 2018-2025 (USD MILLION)
TABLE 56 NORTH AMERICA: ANTIFREEZE/COOLANT MARKET SIZE, BY COUNTRY, 2018-2025 (MILLION GALLONS)
TABLE 57 NORTH AMERICA: ANTIFREEZE/COOLANT MARKET SIZE, BY BASE FLUID, 2018-2025 (USD MILLION)
TABLE 58 NORTH AMERICA: ANTIFREEZE/COOLANT MARKET SIZE, BY BASE FLUID, 2018-2025 (MILLION GALLONS)
TABLE 59 NORTH AMERICA: ANTIFREEZE/COOLANT MARKET SIZE, BY APPLICATION, 2018-2025 (USD MILLION)
TABLE 60 NORTH AMERICA: ANTIFREEZE/COOLANT MARKET SIZE, BY APPLICATION, 2018-2025 (MILLION GALLONS)
TABLE 61 NORTH AMERICA: ANTIFREEZE/COOLANT MARKET SIZE, BY TECHNOLOGY, 2018-2025 (USD MILLION)
TABLE 62 NORTH AMERICA: ANTIFREEZE/COOLANT MARKET SIZE, BY TECHNOLOGY, 2018-2025 (MILLION GALLONS)
TABLE 63 US: ANTIFREEZE/COOLANT MARKET SIZE, BY BASE FLUID, 2018-2025 (USD MILLION)
TABLE 64 US: ANTIFREEZE/COOLANT MARKET SIZE, BY BASE FLUID, 2018-2025 (MILLION GALLONS)
TABLE 65 US: ANTIFREEZE/COOLANT MARKET SIZE, BY APPLICATION, 2018-2025 (USD MILLION)
TABLE 66 US: ANTIFREEZE/COOLANT MARKET SIZE, BY APPLICATION, 2018-2025 (MILLION GALLONS)
TABLE 67 CANADA: ANTIFREEZE/COOLANT MARKET SIZE, BY BASE FLUID, 2018-2025 (USD MILLION)
TABLE 68 CANADA: ANTIFREEZE/COOLANT MARKET SIZE, BY BASE FLUID, 2018-2025 (MILLION GALLONS)
TABLE 69 CANADA: ANTIFREEZE/COOLANT MARKET SIZE, BY APPLICATION, 2018-2025 (USD MILLION)
TABLE 70 CANADA: ANTIFREEZE/COOLANT MARKET SIZE, BY APPLICATION, 2018-2025 (MILLION GALLONS)
TABLE 71 MEXICO: ANTIFREEZE/COOLANT MARKET SIZE, BY BASE FLUID, 2018-2025 (USD MILLION)
TABLE 72 MEXICO: ANTIFREEZE/COOLANT MARKET SIZE, BY BASE FLUID, 2018-2025 (MILLION GALLONS)
TABLE 73 MEXICO: ANTIFREEZE/COOLANT MARKET SIZE, BY APPLICATION, 2018-2025 (USD MILLION)
TABLE 74 MEXICO: ANTIFREEZE/COOLANT MARKET SIZE, BY APPLICATION, 2018-2025 (MILLION GALLONS)
TABLE 75 EUROPE: ANTIFREEZE/COOLANT MARKET SIZE, BY COUNTRY, 2018-2025 (USD MILLION)
TABLE 76 EUROPE: ANTIFREEZE/COOLANT MARKET SIZE, BY COUNTRY, 2018-2025 (MILLION GALLONS)
TABLE 77 EUROPE: ANTIFREEZE/COOLANT MARKET SIZE, BY BASE FLUID, 2018-2025 (USD MILLION)
TABLE 78 EUROPE: ANTIFREEZE/COOLANT MARKET SIZE, BY BASE FLUID, 2018-2025 (MILLION GALLONS)
TABLE 79 EUROPE: ANTIFREEZE/COOLANT MARKET SIZE, BY APPLICATION, 2018-2025 (USD MILLION)
TABLE 80 EUROPE: ANTIFREEZE/COOLANT MARKET SIZE, BY APPLICATION, 2018-2025 (MILLION GALLONS)
TABLE 81 EUROPE: ANTIFREEZE/COOLANT MARKET SIZE, BY TECHNOLOGY, 2018-2025 (USD MILLION)
TABLE 82 EUROPE: ANTIFREEZE/COOLANT MARKET SIZE, BY TECHNOLOGY, 2018-2025 (MILLION GALLONS)
TABLE 83 GERMANY: ANTIFREEZE/COOLANT MARKET SIZE, BY BASE FLUID, 2018-2025 (USD MILLION)
TABLE 84 GERMANY: ANTIFREEZE/COOLANT MARKET SIZE, BY BASE FLUID, 2018-2025 (MILLION GALLONS)
TABLE 85 GERMANY: ANTIFREEZE/COOLANT MARKET SIZE, BY APPLICATION, 2018-2025 (USD MILLION)
TABLE 86 GERMANY: ANTIFREEZE/COOLANT MARKET SIZE, BY APPLICATION, 2018-2025 (MILLION GALLONS)
TABLE 87 FRANCE: ANTIFREEZE/COOLANT MARKET SIZE, BY BASE FLUID, 2018-2025 (USD MILLION)
TABLE 88 FRANCE: ANTIFREEZE/COOLANT MARKET SIZE, BY BASE FLUID, 2018-2025 (MILLION GALLONS)
TABLE 89 FRANCE: ANTIFREEZE/COOLANT MARKET SIZE, BY APPLICATION, 2018-2025 (USD MILLION)
TABLE 90 FRANCE: ANTIFREEZE/COOLANT MARKET SIZE, BY APPLICATION, 2018-2025 (MILLION GALLONS)
TABLE 91 UK: ANTIFREEZE/COOLANT MARKET SIZE, BY BASE FLUID, 2018-2025 (USD MILLION)
TABLE 92 UK: ANTIFREEZE/COOLANT MARKET SIZE, BY BASE FLUID, 2018-2025 (MILLION GALLONS)
TABLE 93 UK: ANTIFREEZE/COOLANT MARKET SIZE, BY APPLICATION, 2018-2025 (USD MILLION)
TABLE 94 UK: ANTIFREEZE/COOLANT MARKET SIZE, BY APPLICATION, 2018-2025 (MILLION GALLONS)
TABLE 95 ITALY: ANTIFREEZE/COOLANT MARKET SIZE, BY BASE FLUID, 2018-2025 (USD MILLION)
TABLE 96 ITALY: ANTIFREEZE/COOLANT MARKET SIZE, BY BASE FLUID, 2018-2025 (MILLION GALLONS)
TABLE 97 ITALY: ANTIFREEZE/COOLANT MARKET SIZE, BY APPLICATION, 2018-2025 (USD MILLION)
TABLE 98 ITALY: ANTIFREEZE/COOLANT MARKET SIZE, BY APPLICATION, 2018-2025 (MILLION GALLONS)
TABLE 99 RUSSIA: ANTIFREEZE/COOLANT MARKET SIZE, BY BASE FLUID, 2018-2025 (USD MILLION)
TABLE 100 RUSSIA: ANTIFREEZE/COOLANT MARKET SIZE, BY BASE FLUID, 2018-2025 (MILLION GALLONS)
TABLE 101 RUSSIA: ANTIFREEZE/COOLANT MARKET SIZE, BY APPLICATION, 2018-2025 (USD MILLION)
TABLE 102 RUSSIA: ANTIFREEZE/COOLANT MARKET SIZE, BY APPLICATION, 2018-2025 (MILLION GALLONS)
TABLE 103 REST OF EUROPE: ANTIFREEZE/COOLANT MARKET SIZE, BY BASE FLUID, 2018-2025 (USD MILLION)
TABLE 104 REST OF EUROPE: ANTIFREEZE/COOLANT MARKET SIZE, BY BASE FLUID, 2018-2025 (MILLION GALLONS)
TABLE 105 REST OF EUROPE: ANTIFREEZE/COOLANT MARKET SIZE, BY APPLICATION, 2018-2025 (USD MILLION)
TABLE 106 REST OF EUROPE: ANTIFREEZE/COOLANT MARKET SIZE, BY APPLICATION, 2018-2025 (MILLION GALLONS)
TABLE 107 MIDDLE EAST & AFRICA: ANTIFREEZE/COOLANT MARKET SIZE, BY COUNTRY, 2018-2025 (USD MILLION)
TABLE 108 MIDDLE EAST & AFRICA: ANTIFREEZE/COOLANT MARKET SIZE, BY COUNTRY, 2018-2025 (MILLION GALLONS)
TABLE 109 MIDDLE EAST & AFRICA: ANTIFREEZE/COOLANT MARKET SIZE, BY BASE FLUID, 2018-2025 (USD MILLION)
TABLE 110 MIDDLE EAST & AFRICA: ANTIFREEZE/COOLANT MARKET SIZE, BY BASE FLUID, 2018-2025 (MILLION GALLONS)
TABLE 111 MIDDLE EAST & AFRICA: ANTIFREEZE/COOLANT MARKET SIZE, BY APPLICATION, 2018-2025 (USD MILLION)
TABLE 112 MIDDLE EAST & AFRICA: ANTIFREEZE/COOLANT MARKET SIZE, BY APPLICATION, 2018-2025 (MILLION GALLONS)
TABLE 113 MIDDLE EAST & AFRICA: ANTIFREEZE/COOLANT MARKET SIZE, BY TECHNOLOGY, 2018-2025 (USD MILLION)
TABLE 114 MIDDLE EAST & AFRICA: ANTIFREEZE/COOLANT MARKET SIZE, BY TECHNOLOGY, 2018-2025 (MILLION GALLONS)
TABLE 115 SOUTH AFRICA: ANTIFREEZE/COOLANT MARKET SIZE, BY BASE FLUID, 2018-2025 (USD MILLION)
TABLE 116 SOUTH AFRICA: ANTIFREEZE/COOLANT MARKET SIZE, BY BASE FLUID, 2018-2025 (MILLION GALLONS)
TABLE 117 SOUTH AFRICA: ANTIFREEZE/COOLANT MARKET SIZE, BY APPLICATION, 2018-2025 (USD MILLION)
TABLE 118 SOUTH AFRICA: ANTIFREEZE/COOLANT MARKET SIZE, BY APPLICATION, 2018-2025 (MILLION GALLONS)
TABLE 119 TURKEY: ANTIFREEZE/COOLANT MARKET SIZE, BY BASE FLUID, 2018-2025 (USD MILLION)
TABLE 120 TURKEY: ANTIFREEZE/COOLANT MARKET SIZE, BY BASE FLUID, 2018-2025 (MILLION GALLONS)
TABLE 121 TURKEY: ANTIFREEZE/COOLANT MARKET SIZE, BY APPLICATION, 2018-2025 (USD MILLION)
TABLE 122 TURKEY: ANTIFREEZE/COOLANT MARKET SIZE, BY APPLICATION, 2018-2025 (MILLION GALLONS)
TABLE 123 REST OF MEA: ANTIFREEZE/COOLANT MARKET SIZE, BY BASE FLUID, 2018-2025 (USD MILLION)
TABLE 124 REST OF MEA: ANTIFREEZE/COOLANT MARKET SIZE, BY BASE FLUID, 2018-2025 (MILLION GALLONS)
TABLE 125 REST OF MEA: ANTIFREEZE/COOLANT MARKET SIZE, BY APPLICATION, 2018-2025 (USD MILLION)
TABLE 126 REST OF MEA: ANTIFREEZE/COOLANT MARKET SIZE, BY APPLICATION, 2018-2025 (MILLION GALLONS)
TABLE 127 SOUTH AMERICA: ANTIFREEZE/COOLANT MARKET SIZE, BY COUNTRY, 2018-2025 (USD MILLION)
TABLE 128 SOUTH AMERICA: ANTIFREEZE/COOLANT MARKET SIZE, BY COUNTRY, 2018-2025 (MILLION GALLONS)
TABLE 129 SOUTH AMERICA: ANTIFREEZE/COOLANT MARKET SIZE, BY BASE FLUID, 2018–2025 (USD MILLION)
TABLE 130 SOUTH AMERICA: ANTIFREEZE/COOLANT MARKET SIZE, BY BASE FLUID, 2018–2025 (MILLION GALLONS)
TABLE 131 SOUTH AMERICA: ANTIFREEZE/COOLANT MARKET SIZE, BY APPLICATION, 2018–2025 (USD MILLION)
TABLE 132 SOUTH AMERICA: ANTIFREEZE/COOLANT MARKET SIZE, BY APPLICATION, 2018–2025 (MILLION GALLONS)
TABLE 133 SOUTH AMERICA: ANTIFREEZE/COOLANT MARKET SIZE, BY TECHNOLOGY, 2018–2025 (USD MILLION)
TABLE 134 SOUTH AMERICA: ANTIFREEZE/COOLANT MARKET SIZE, BY TECHNOLOGY, 2018–2025 (MILLION GALLONS)
TABLE 135 BRAZIL: ANTIFREEZE/COOLANT MARKET SIZE, BY BASE FLUID, 2018–2025 (USD MILLION)
TABLE 136 BRAZIL: ANTIFREEZE/COOLANT MARKET SIZE, BY BASE FLUID, 2018–2025 (MILLION GALLONS)
TABLE 137 BRAZIL: ANTIFREEZE/COOLANT MARKET SIZE, BY APPLICATION, 2018–2025 (USD MILLION)
TABLE 138 BRAZIL: ANTIFREEZE/COOLANT MARKET SIZE, BY APPLICATION, 2018–2025 (MILLION GALLONS)
TABLE 139 ARGENTINA: ANTIFREEZE/COOLANT MARKET SIZE, BY BASE FLUID, 2018–2025 (USD MILLION)
TABLE 140 ARGENTINA: ANTIFREEZE/COOLANT MARKET SIZE, BY BASE FLUID, 2018–2025 (MILLION GALLONS)
TABLE 141 ARGENTINA: ANTIFREEZE/COOLANT MARKET SIZE, BY APPLICATION, 2018–2025 (USD MILLION)
TABLE 142 ARGENTINA: ANTIFREEZE/COOLANT MARKET SIZE, BY APPLICATION, 2018–2025 (MILLION GALLONS)
TABLE 143 REST OF SOUTH AMERICA: ANTIFREEZE/COOLANT MARKET SIZE, BY BASE FLUID, 2018–2025 (USD MILLION)
TABLE 144 REST OF SOUTH AMERICA: ANTIFREEZE/COOLANT MARKET SIZE, BY BASE FLUID, 2018–2025 (MILLION GALLONS)
TABLE 145 REST OF SOUTH AMERICA: ANTIFREEZE/COOLANT MARKET SIZE, BY APPLICATION, 2018–2025 (USD MILLION)
TABLE 146 REST OF SOUTH AMERICA: ANTIFREEZE/COOLANT MARKET SIZE, BY APPLICATION, 2018–2025 (MILLION GALLONS)
TABLE 147 ACQUISITION
TABLE 148 EXPANSION
TABLE 149 PARTNERSHIP
TABLE 150 NEW PRODUCT LAUNCH
LIST OF FIGURES (46 Figures)
FIGURE 1 ANTIFREEZE/COOLANT MARKET: SEGMENTATION
FIGURE 2 ANTIFREEZE/COOLANT MARKET, BY REGION
FIGURE 3 ANTIFREEZE/COOLANT MARKET: DATA TRIANGULATION
FIGURE 4 BREAKDOWN OF PRIMARY INTERVIEWS
FIGURE 5 ETHYLENE GLYCOL TO LED THE ANTIFREEZE/COOLANT MARKET
FIGURE 6 AUTOMOTIVE, THE LARGEST APPLICATION FOR ANTIFREEZE/COOLANT MARKET
FIGURE 7 OAT TO GROW AT A HIGHER RATE THAN OTHERS BETWEEN 2020 AND 2025
FIGURE 8 ASIA PACIFIC IS KEY CONTRIBUTOR TO THE GLOBAL ANTIFREEZE / COOLANT MARKET
FIGURE 9 EMERGING ECONOMIES OFFER ATTRACTIVE OPPORTUNITIES FOR THE MARKET PLAYERS
FIGURE 10 EG ESTIMATED TO CAPTURE THE LARGEST SHARE IN 2020
FIGURE 11 EG TO GROW AT HIGHEST RATE IN THE ANTIFREEZE/COOLANT MARKET
FIGURE 12 OAT SEGMENT TO DOMINATE THE ANTIFREEZE/COOLANT MARKET
FIGURE 13 AUTOMOTIVE TO BE LARGEST CONSUMER OF ANTIFREEZE/COOLANT
FIGURE 14 VIETNAM PROJECTED TO BE FASTEST-GROWING MARKET FOR ANTIFREEZE/COOLANT
FIGURE 15 GROWING NUMBER OF VEHICLES IN OPERATION EXPECTED TO DRIVE THE ANTIFREEZE/COOLANT MARKET
FIGURE 16 VEHICLE IN OPERATION, 2019
FIGURE 17 CONSTRUCTION EQUIPMENT SALES, BY REGION
FIGURE 18 HVAC SYSTEMS MARKET, BY REGION
FIGURE 19 CRUDE OIL PRICE FORECAST
FIGURE 20 ANTIFREEZE/COOLANT MARKET: VALUE CHAIN ANALYSIS
FIGURE 21 COVID-19 IMPACT ON AUTOMOTIVE SALES FROM JAN 2020 TO APRIL 2020
FIGURE 22 EG PROJECTED TO DOMINATE THE ANTIFREEZE/COOLANT MARKET
FIGURE 23 AUTOMOTIVE SEGMENT ESTIMATED TO DOMINATE THE ANTIFREEZE / COOLANT MARKET
FIGURE 24 OAT ANTIFREEZE/COOLANT TECHNOLOGY PROJECTED TO BE DOMINANT DURING FORECAST PERIOD
FIGURE 25 REGIONAL SNAPSHOT: ANTIFREEZE/COOLANT MARKET GROWTH (2020-2025)
FIGURE 26 COMPANIES ADOPTED MERGER & ACQUISITION AS THE KEY GROWTH STRATEGY BETWEEN 2015 AND 2020
FIGURE 27 MARKET RANKING OF KEY PLAYERS, 2019
FIGURE 28 ANTIFREEZE/COOLANT MARKET: COMPETITIVE LEADERSHIP MAPPING, 2020
FIGURE 29 PRODUCT PORTFOLIO ANALYSIS OF TOP PLAYERS IN ANTIFREEZE COOLANT MARKET
FIGURE 30 BUSINESS STRATEGY EXCELLENCE OF TOP PLAYERS IN ANTIFREEZE COOLANT MARKET
FIGURE 31 BRITISH PETROLEUM: COMPANY SNAPSHOT
FIGURE 32 BP PLC: SWOT ANALYSIS
FIGURE 33 ROYAL DUTCH SHELL PLC : COMPANY SNAPSHOT
FIGURE 34 ROYAL DUTCH SHELL PLC COMPANY: SWOT ANALYSIS
FIGURE 35 CHEVRON CORPORATION: COMPANY SNAPSHOT
FIGURE 36 CHEVRON CORPORATION: SWOT ANALYSIS
FIGURE 37 EXXONMOBIL CORPORATION: COMPANY SNAPSHOT
FIGURE 38 EXXONMOBIL CORPORATION: SWOT ANALYSIS
FIGURE 39 TOTAL SA: COMPANY SNAPSHOT
FIGURE 40 TOTAL SA: SWOT ANALYSIS
FIGURE 41 LUKOIL: COMPANY SNAPSHOT
FIGURE 42 LUKOIL: SWOT ANALYSIS
FIGURE 43 PETRONAS: COMPANY SNAPSHOT
FIGURE 44 BASF SE: COMPANY SNAPSHOT
FIGURE 45 VALVOLINE INC.: COMPANY SNAPSHOT
FIGURE 46 CUMMINS INC.: COMPANY SNAPSHOT
The study involved four major activities for estimating the current global size of the antifreeze/coolant market. Exhaustive secondary research was carried out to collect information on the market, the peer market, and the parent market. The next step was to validate these findings, assumptions, and sizes with the industry experts across the value chain of the antifreeze/coolant market through primary research. Both the top-down and bottom-up approaches were employed to estimate the overall size of the antifreeze/coolant market. After that, market breakdown and data triangulation procedures were used to determine the size of different segments and sub-segments of the market.
Secondary Research
In the secondary research process, various secondary sources such as Hoovers, Factiva, Bloomberg BusinessWeek, and Dun & Bradstreet were referred to identify and collect information for this study on the antifreeze/coolant market. These secondary sources included annual reports, press releases & investor presentations of companies, white papers, certified publications, articles by recognized authors, regulatory bodies, trade directories, and databases.
Primary Research
Various primary sources from both the supply and demand sides of the antifreeze/coolant market were interviewed to obtain qualitative and quantitative information. The primary sources from the supply-side included industry experts, such as Chief Executive Officers (CEOs), vice presidents, marketing directors, sales professionals, and related key executives from various leading companies and organizations operating in the antifreeze/coolant market. The primary sources from the demand-side included key executives from various end-use sectors, association members, and government organizations.
To know about the assumptions considered for the study, download the pdf brochure
Market Size Estimation
Both the top-down and bottom-up approaches were used to estimate and validate the global size of the antifreeze/coolant market. These approaches were also used extensively to estimate the size of various dependent segments of the market. The research methodology used to estimate the market size included the following details:
- The key players were identified through extensive secondary research.
- The industry’s supply chain and market size, in terms of value, were determined through primary and secondary research processes.
- All percentage shares, splits, and breakdowns were determined using secondary sources and verified through primary sources.
Data Triangulation
After arriving at the overall market size from the estimation process explained above, the total market was split into several segments and sub-segments. The data triangulation and market breakdown procedures were employed, wherever applicable, to complete the overall market engineering process and arrive at the exact statistics for all segments and sub-segments of the antifreeze/coolant market. The data was triangulated by studying various factors and trends from both the demand- and supply-side.
Research Objectives
- To define, analyze, and project the size of the antifreeze/coolant market in terms of value and volume based on base fluid, technology, application, and region.
- To project the size of the market and its segments in terms of value and volume, with respect to the five main regions, namely, North America, Europe, Asia Pacific, Middle East & Africa, and South America.
- To provide detailed information about the key factors, such as drivers, restraints, opportunities, and challenges, influencing the growth of the market.
- To strategically analyze the micro-markets with respect to individual growth trends, prospects, and their contribution to the total market
- To analyze the opportunities in the market for stakeholders and provide a detailed competitive landscape of the market leaders
- To analyze the competitive developments, such as expansions and acquisitions in the antifreeze/coolant market
- To strategically profile the key players operating in the market and comprehensively analyze their market shares and core competencies
Available Customizations
With the given market data, MarketsandMarkets offers customizations according to client-specific needs.
The following customization options are available for the antifreeze/coolant report:
Product Analysis
- Product matrix, which offers a detailed comparison of the product portfolio of companies
Regional Analysis
- Further analysis of the antifreeze/coolant market for additional countries
Company Information
- Detailed analysis and profiling of other market players (up to Seven)


Growth opportunities and latent adjacency in Antifreeze/Coolant Market