Automotive E-tailing Market by Applications, Vehicle Type, Vendor, Components (Infotainment, Interior Accessories, Engine Components, Tires, and Electrical Products), Product Label, Technology, and Region - Global Forecast to 2021


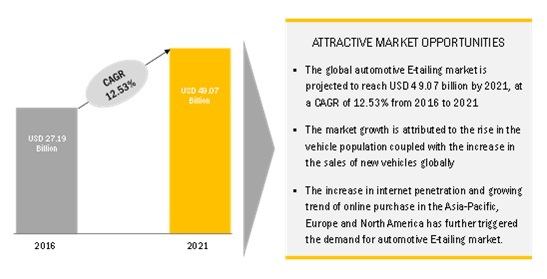
[178 Pages Report] The global automotive E-tailing market is driven by the increased demand for the automotive parts and components as the average age of vehicles is increasing. The convenient shopping experience has driven customers to online purchases. E-tailing is also helping brick-and-mortar auto parts retailers to reach more consumers through the internet. The global automotive E-tailing market in 2016 was valued at USD 27.19 billion, and is projected to grow at a CAGR of 12.53% during the forecast period. The base year for the study is 2015, and the forecast period is from 2016 to 2021.
E-tailing Market Dynamics
Drivers
- Internet habituated customer
- Growth in vehicle population
- Cheaper automotive components
- Increasing demand for omni-channel insights
- Increased spending on analytics
Restraints
- Increasing share of counterfeiting of automotive parts
- Intangible Nature of Business
- Online payment frauds
- Late Or inaccurate delivery reduces value for the customer
Opportunities
- Growing vehicle-age in circulation
- Growing Passenger Car Sales
- Large presence of SMBs along with increased spending on e-commerce platform
- Increasing need to mitigate shrink
Challenges
- Price transparency
- Continuously updating products and technology
- Increased parts complexity
Critical Questions which the Report Answers:
- Which vehicle type will lead the automotive E-tailing market (PC, Two-wheelers, and Others)?
- What are the industry trends in the automotive E-tailing market?
- Which player will dominate the automotive E-tailing market regionally?
- What are the upcoming technological developments in the automotive E-tailing Market?
- Which automotive component has the largest market size in the automotive e-tailing market?
The objective of the study is to define, describe, and provide a detailed analysis of E-tailing in the automotive industry. The report segments the market by vendor, by component, by vehicle type, by product label and by region. The primary aim of the research study is to provide in depth analysis of the global automotive E-tailing market by value, and detailed analysis of the dynamics driving the automotive E-tailing market. A detailed study of various market leaders has been done and opportunity analysis has been provided in the report.
Various secondary sources, such as company annual reports/presentations, press releases, industry association publications such as International Organization of Motor Vehicle Manufacturers (OICA), automotive magazine articles, directories, technical handbooks, world economic outlook, trade websites, technical articles, and databases (Marklines, Factiva etc.) have been used to identify and collect information useful for an extensive commercial study of the global automotive E-tailing market. The primary sources-experts from related industries, automobile OEMs and E-tailing organizations have been interviewed to obtain and verify critical information, as well as to assess future prospects and market estimations. Both top–down and bottom-up approach has been used for market estimation and calculating the automotive E-tailing market size
To know about the assumptions considered for the study, download the pdf brochure
The automotive E-tailing ecosystem consists of automotive components manufacturers such as Robert Bosch GmbH (Germany), Continental AG (Germany), and online retailers such as AutoZone, Inc. (U.S.), Amazon.com, Inc. (U.S.), Alibaba Group Holding Ltd. (China), Wal-Mart Stores, Inc. (U.S.), Ebay Inc. (U.S.), Delticom AG (Germany), Advance Auto Parts, Inc. (U.S.), Flipkart (India) and O’Reilly Automotive Inc. (U.S.)
E-tailing Market Target Audience
- Automotive aftermarket OEMs and third party vendors
- Automotive OEM manufacturers
- E-tailing service providers
Scope of the Report
By Vendor Type
- OEM vendor
- Third party vendor
By Label Type
- Branded
- Counterfeit
By Vehicle Type
- Passenger Car
- Commercial Vehicle
- 2-Wheeler
By Region
- Asia–Pacific
- North America
- Europe
- RoW
By Component Type
- Infotainment and Multimedia
-
Engine Components
- Engine Block & Cylinder Heads
- Pistons & Rings
- Bearings
- Valves & Filters
- Tires and wheels
- Interior Accessories
- Electrical Products
By E-Commerce Software Platform
Available Customizations
- Automotive E-tailing Market, By vehicle type on country level
- Automotive E-tailing Market, By Vendor type on country level
-
Company Information
- Profiling Of Additional Market Players (Up to 3)
The global automotive e-tailing market is projected to grow at a CAGR of 12.53% during the forecast period, to reach USD 49.07 billion by 2021 from an estimated USD 27.19 billion in 2016. The base year for the report is 2015 and the forecast year is 2021. The current vehicle population, increasing automobile sales, and increasing penetration of internet has led to the increase in online sales of automotive components.
The online sales of automotive components through third party vendors such as Alibaba Group Holding Limited, Amazon.com, Inc., and O’Reilly Auto Parts etc., are estimated to show the fastest growth during the forecast period The increasing internet penetration coupled with discount offered are pushing the online sales of automotive components. Low pricing strategy and multiple online offers, coupled with the facility of comparing parts online based on specification, price, and guarantee are further driving the automotive e-tailing market.
The online sales of automotive components for the passenger car segment is the fastest growing segment in the global automotive e-tailing market. The growth can be attributed to the growing sales of passenger cars across the globe coupled with the present passenger car population of about 1 billion. The increasing internet penetration, rise in the sales of passenger cars, existing vehicle population and the time and cost convenience of purchasing parts online are the major factors which are contributing to this growth.
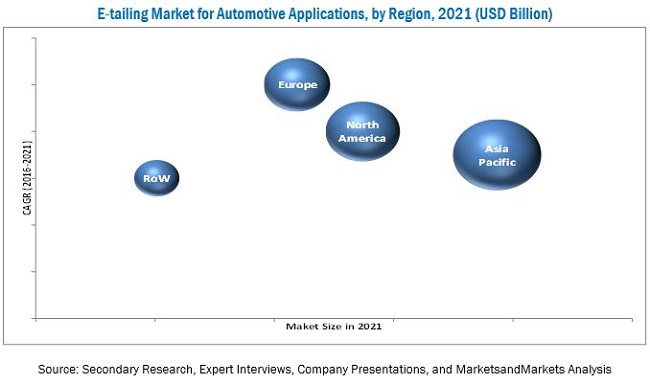
North America is the leading the E-commerce software platform market in 2016 but by the end of the forecast period, the Asia-Pacific region is projected to lead the market. Some of the key drivers for this growth trend include the presence of a large number of SMB retailers in the region, increasing consumer spending on e-commerce, and increased adoption of SaaS and mobile technology.
The Asia-Pacific region has the largest market share in the automotive e-tailing market. China is the largest market, followed closely by the U.S., because of its advanced technological infrastructure, high internet penetration, and huge vehicle population.
Branded automotive components are the major shareholding segment in the global E-tailing market with around 70% of the market share. The demand for quality products coupled with the guarantee associated with branded automotive components has driven the demand for branded components in the global E-tailing market.
Infotainment And Multimedia
The infotainment and multimedia is the collection of hardware and software which provides audio and video entertainment. These infotainment and multimedia systems includes applications such as dashboards, connectivity device comprises bluetooth, and the audio-video systems. Increasing demand for the advanced convenience and comfort systems will grow the infotainment and multimedia market.
Interior Accessories
The interior accessories include the products like seat cover, perfume, foot mats, and seat belts. The interior accessories market is highly dominated by the counterfeit label products and third party vendors, due to the wide range and low cost offered by them. The OEM manufacturer of seat belt are Autolly Inc., TK Holding Inc., and Takata Corp.
Engine Components
The products offered under engine components are engine block & cylinder heads, pistons & rings, bearings, and valves & filters.
Tires and wheel
The demand for tires and wheels is higher than other auto parts. There are many OEM manufactures of tires who adopted the medium of E-tailing to sell their product directly to the end customer. Delticom AG is one of the leading automotive tire online retailer in Europe. Other tire OEM manufacturers such as Continental, Goodyear, and Pirelli.
Electrical Products
The electrical products under automotive component E-tailing market offers the products such as batteries, ignition systems and parts-spark plug, and lightning equipment.
Critical Questions:
- Where will the e-commerce software technology take the industry in the long term?
- Will the industry cope with the challenge of continuously updating products and technology of E-tailing market?
- How do you see the impact of the online payment frauds in the automotive E-tailing Market?
The major restraints considered in the study include the threat of late delivery, online payment frauds and counterfeit parts which restricts customers from purchasing automotive components online thus curtailing the market for automotive E-tailing. The lower internet penetration in countries such as China, India, and Brazil is another restraint for the global e-tailing players as the Asia-Pacific is the largest market for vehicle production and sales. These factors could negatively affect the growing demand for automotive e-tailing services in the global market and could restrict growth. The global automotive e-tailing market is dominated by many international as well as domestic players, and some of them are Advance Auto Parts (U.S.A.), Alibaba Group Holding Limited (China), Amazon.com Inc. (U.S.A.), Delticom AG (Germany), O’Reilly Auto Parts (U.S.A.), Flipkart (India) and eBay Inc. (U.S.A.) etc.
To speak to our analyst for a discussion on the above findings, click Speak to Analyst
 Exclusive indicates content/data unique to MarketsandMarkets and not available with any competitors.
Table of Contents
1 Introduction (Page No. - 16)
1.1 Objectives of the Study
1.2 Market Scope
1.2.1 Markets Covered
1.2.2 Years Considered for the Study
1.3 Currency
1.4 Limitations
1.5 Stakeholders
1.5.1 E-Commerce Software Platform Stakeholders
2 Research Methodology (Page No. - 20)
2.1 Secondary Data
2.1.1 Key Data From Secondary Sources
2.2 Primary Data
2.2.1 Primary Participants
2.3 Factor Analysis
2.3.1 Introduction
2.3.2 Demand Side Analysis
2.3.2.1 Impact of GDP on Total Vehicle Sales
2.3.2.2 Urbanization Percentage of Key Countries
2.3.2.3 Infrastructure: Roadways
2.3.2.4 Increasing Vehicle Production in Developing Countries
2.4 Market Size Estimation
2.5 Data Triangulation
2.6 Assumptions
3 Executive Summary (Page No. - 32)
4 Premium Insights (Page No. - 42)
4.1 Introduction
4.2 Opportunities in the Automotive E-Tailing Market Applications
4.3 Market Applications Growth, By Country, 2016–2021 (USD Billion)
4.4 Market Applications Share, By Vendor (2016–2021)
4.5 Market Applications, By Label Type, 2016 vs 2021
4.6 Market Applications, By Component Type, 2016 vs 2021
4.7 Market Applications, By Vehicle Type, 2016 vs 2021
4.8 E-Commerce Software Platform Market, 2016 vs 2021
4.9 Asia-Pacific E-Commerce Software Platform Market, By Country, 2016
5 Market Overview (Page No. - 51)
5.1 Introduction
5.2 Market Segmentation
5.2.1 Global Automotive E-Tailing Market Applications Segmentation: By Components
5.2.2 Global Market Applications Segmentations, By Vendor and Product Label
5.2.3 Market Applications Segmentation: By Region
5.3 Market Dynamics
5.3.1 Drivers
5.3.1.1 Internet Habituated Customer
5.3.1.2 Growth in Vehicle Population
5.3.1.3 Cheaper Automotive Components
5.3.1.4 Increasing Demand for Omni-Channel Insights
5.3.1.5 Increased Spending on Analytics
5.3.2 Restraints
5.3.2.1 Increasing Share of Counterfeiting of Automotive Parts
5.3.2.2 Intangible Nature of Business
5.3.2.3 Online Payment Frauds
5.3.2.4 Late Or Inaccurate Delivery Reduces Value for the Customer
5.3.3 Opportunities
5.3.3.1 Growing Vehicle-Age in Circulation
5.3.3.2 Large Presence of Smbs Along With Increased Spending on E-Commerce Platform
5.3.3.3 Increasing Need to Mitigate Shrink
5.3.4 Challenges
5.3.4.1 Price Transparency
5.3.4.2 Continuously Updating Products and Technology
5.3.4.3 Increased Parts Complexity
5.4 Porter’s Five Forces Analysis
5.4.1 Threat From New Entrants
5.4.1.1 Latest Boom in Automotive Industry has Attracted Many Players
5.4.2 Threat of Substitutes
5.4.2.1 Huge Capital Requirement
5.4.3 Bargaining Power of Buyers
5.4.3.1 Huge Number of Service Providers
5.4.3.2 Uniform Products
5.4.4 Bargaining Power of Suppliers
5.4.4.1 Multiple Options Available as A Service Provider
5.4.4.2 Strong Platform to Increase Market Penetration
5.4.5 Intensity of Competitive Rivalry
5.4.5.1 Large Industry Size
5.4.5.2 Opportunistic and Highly Competitive
6 Automotive E-Tailing Market Applications, By Region (Page No. - 64)
6.1 Introduction
6.2 Asia-Pacific
6.2.1 China
6.2.2 India
6.2.3 Japan
6.2.4 South Korea
6.3 North America
6.3.1 U.S.
6.3.2 Canada
6.3.3 Mexico
6.4 Europe
6.4.1 Germany
6.4.2 France
6.4.3 U.K.
6.5 Rest of the World
6.5.1 Brazil
6.5.2 Russia
7 Automotive E-Tailing Market Applications, By Vehicle Type (Page No. - 84)
7.1 Introduction
7.1.1 Passenger Car E-Tailing Market
7.1.2 Commercial Vehicle E-Tailing Market
7.1.3 Two Wheeler E-Tailing Market
8 Automotive E-Tailing Market Applications, By Component (Page No. - 95)
8.1 Introduction
8.1.1 Infotainment and Multimedia
8.1.2 Interior Accessories
8.1.3 Engine Components
8.1.4 Tires and Wheel
8.1.5 Electrical Products
9 Automotive E-Taling Market, By Product Label Type (Page No. - 113)
9.1 Introduction
9.2 Genuine Label Products
9.3 Counterfeit Label Products
10 Automotive E-Tailing Market Applications, By Vendor Type (Page No. - 121)
10.1 Introduction
10.2 Oem Vendor
10.3 Third Party Vendor
11 E-Commerce Digital Software Platform Market (Page No. - 129)
11.1 Introduction
11.2 Region-Wise Analysis
11.2.1 Asia-Pacific
11.2.2 North America
11.2.3 Europe
11.2.4 Rest of the World
12 Competitive Landscape (Page No. - 135)
12.1 Overview
12.2 Battle for Market Share: Mergers and Acquisitions Were the Key Strategy
12.3 Mergers and Acquisitions
12.4 Agreements/Partnerships/Collaborations
12.5 Expansions
12.6 Joint Ventures
13 Company Profiles (Page No. - 141)
(Company at A Glance, Recent Financials, Products & Services, Strategies & Insights, & Recent Developments)*
13.1 Autozone, Inc.
13.2 Alibaba Group Holding Ltd
13.3 Amazon.Com, Inc.
13.4 Robert Bosch GmbH
13.5 Wal-Mart Stores, Inc.
13.6 Ebay Inc.
13.7 Delticom AG.
13.8 O'reilly Automotive Inc.
13.9 Advance Auto Parts, Inc.
13.10 Flipkart
*Details on Company at A Glance, Recent Financials, Products & Services, Strategies & Insights, & Recent Developments Might Not Be Captured in Case of Unlisted Companies.
14 Appendix (Page No. - 171)
14.1 Insights of Industry Experts
14.2 Discussion Guide
14.3 Knowledge Store: Marketsandmarkets’ Subscription Portal
14.4 Introducing RT: Real Time Market Intelligence
14.5 Related Report
14.6 Author Details
List of Tables (96 Tables)
Table 1 Automotive E-Tailing Market Applications Size, By Region, 2014–2021 (USD Billion)
Table 2 Asia-Pacific: Market Applications Size, By Country, 2014–2021 (USD Billion)
Table 3 China: Market Applications Size, By Vendor Type, 2014–2021 (USD Billion)
Table 4 India: Market Applications Size, By Vendor Type, 2014–2021 (USD Billion)
Table 5 Japan: Market Applications Size, By Vendor Type, 2014–2021 (USD Billion)
Table 6 South Korea: Market Applications Size, By Vendor Type, 2014–2021 (USD Billion)
Table 7 North America: Market Applications Size, By Country, 2014–2021 (USD Billion)
Table 8 U.S.: Market Applications Size, By Vendor Type, 2014–2021 (USD Billion)
Table 9 Canada: Market Applications Size, By Vendor Type, 2014–2021 (USD Billion)
Table 10 Mexico: Market Applications Size, By Vendor Type, 2014–2021 (USD Billion)
Table 11 Europe: Market Applications Size, By Country, 2014–2021 (USD Billion)
Table 12 Germany: Market Applications Size, By Vendor Type, 2014–2021 (USD Billion)
Table 13 France: Market Applications Size, By Vendor Type, 2014–2021 (USD Billion)
Table 14 U.K.: Market Applications Size, By Transmission Type, 2014–2021 (USD Billion)
Table 15 Rest of the World: Market Applications Size, By Country, 2014–2021 (USD Billion)
Table 16 Brazil Market Applications: to Grow at the Highest CAGR, 2016-2021
Table 17 Russia: Market Applications Size, By Vendor Type, 2014–2021 (USD Billion)
Table 18 Automotive E-Tailing Market Applications, By Vehicle Type, 2016 vs 2021 (USD Billion)
Table 19 Passenger Car: Market Applications Size, By Region, 2014–2021 (USD Billion)
Table 20 Asia-Pacific : Passenger Car E-Tailing Market Size, By Country, 2014–2021 (USD Billion)
Table 21 North America: Passenger Car E-Tailing Market Size, By Country, 2014–2021 (USD Billion)
Table 22 Europe : Passenger Car E-Tailing Market Size, By Country, 2014–2021 (USD Billion)
Table 23 RoW: Passenger Car E-Tailing Market Size, By Country, 2014–2021 (USD Billion)
Table 24 Commercial Vehicle: Market Applications Size, By Region, 2014–2021 (USD Billion)
Table 25 Asia-Pacific : Commercial Vehicle E-Tailing Market Size, By Country, 2014–2021 (USD Billion)
Table 26 North America: Commercial Vehicle E-Tailing Market Size, By Country, 2014–2021 (USD Billion)
Table 27 Europe : Commercial Vehicle E-Tailing Market Size, By Country, 2014–2021 (USD Billion)
Table 28 RoW: Commercial Vehicle E-Tailing Market Size, By Country, 2014–2021 (USD Billion)
Table 29 Two Wheeler: Automotive E-Tailing Market Applications Size, By Region, 2014–2021 (USD Billion)
Table 30 Asia Pacific : Two Wheeler E-Tailing Market Size, By Country, 2014–2021 (USD Billion)
Table 31 RoW: Two Wheeler E-Tailing Market Size, By Country, 2014–2021 (USD Billion)
Table 32 North America: Two Wheeler E-Tailing Market Size, By Country, 2014–2021 (USD Billion)
Table 33 Europe : Two Wheeler E-Tailing Market Size, By Country, 2014–2021 (USD Billion)
Table 34 Automotive E-Tailing Market Applications, By Component, 2014–2021 (USD Billion)
Table 35 Infotainment and Multimedia :Market Applications, By Region, 2014-2021 (USD Billion)
Table 36 Asia –Pacific: Market Applications for Infotainment and Multimedia, 2014–2021 (USD Billion)
Table 37 North America : Market Applications for Infotainment and Multimedia, 2014–2021 (USD Billion)
Table 38 Europe : Market Applications for Infotainment and Multimedia, 2014–2021 (USD Billion)
Table 39 RoW : Market Applications for Infotainment and Multimedia, 2014–2021 (USD Billion)
Table 40 Interior Accessories :Market Applications, By Region, 2014–2021 (USD Billion)
Table 41 Asia –Pacific: Market Applications for Interior Accessories, 2014–2021 (USD Billion)
Table 42 North America : Market Applications for Interior Accessories, 2014–2021 (USD Billion)
Table 43 Europe : Market Applications for Interior Accessories, 2014–2021 (USD Billion)
Table 44 RoW :Market Applications for Interior Accessories, 2014–2021 (USD Billion)
Table 45 Engine Component: Market Applications for Engine Components, 2014–2021 (USD Billion)
Table 46 Engine Components :Market Applications, By Region, 2014–2021 (USD Billion)
Table 47 Asia –Pacific: Market Applications for Engine Components, 2014–2021 (USD Billion)
Table 48 North America : Automotive E-Tailing Market Applications for Engine Components, 2014-2021 (USD Billion)
Table 49 Europe : Market Applications for Engine Components, 2014-2021 (USD Billion)
Table 50 RoW : Market Applications for Engine Components, 2014-2021 (USD Billion)
Table 51 Tire and Wheel : Market Applications, By Region, 2014–2021 (USD Billion)
Table 52 Asia –Pacific: Market Applications for Tire and Wheel, 2014-2021 (USD Billion)
Table 53 North America : Market Applications for Tire and Wheel, 2014–2021 (USD Billion)
Table 54 Europe : Automotive E-Tailing Market Applications for Tire and Wheel, 2014–2021 (USD Billion)
Table 55 RoW : Market Applications for Tire and Wheel, 2014–2021 (USD Billion)
Table 56 Electrical Products : Market Applications, By Region, 2014–2021 (USD Billion)
Table 57 Asia–Pacific: Market Applications for Electrical Products, 2014–2021 (USD Billion)
Table 58 North America : Automotive E-Tailing Market Applications for Electrical Products, 2014–2021 (USD Billion)
Table 59 Europe :Market Applications for Electrical Products, 2014–2021 (USD Billion)
Table 60 RoW : Market Applications for Electrical Products, 2014–2021 (USD Billion)
Table 61 Market Applications Size, By Product Label Type, 2014–2021 (USD Billion)
Table 62 Genuine Label Products: Automotive E-Tailing Market Applications Size, By Region, 2014–2021 (USD Billion)
Table 63 Asia-Pacific: Automotive Genuine Label E-Tailing Market Size, By Country, 2014–2021 (USD Billion)
Table 64 Europe: Automotive Genuine Label E-Tailing Market Size, By Country, 2014–2021 (USD Billion)
Table 65 North America: Automotive Genuine Label E-Tailing Market Size, By Country, 2014–2021 (USD Billion)
Table 66 Rest of the World: Automotive Genuine Label E-Tailing Market Size, By Country, 2014–2021 (USD Billion)
Table 67 Counterfeit Label Products: Automotive E-Tailing Market Applications Size, By Region, 2014–2021 (USD Billion)
Table 68 Asia-Pacific: Automotive Counterfeit Label E-Tailing Market Size, By Country, 2014–2021 (USD Billion)
Table 69 Europe: Automotive Counterfeit Label E-Tailing Market Size, By Country, 2014–2021 (USD Billion)
Table 70 North America: Automotive Counterfeit Label E-Tailing Market Size, By Country, 2014–2021 (USD Billion)
Table 71 Rest of the World: Automotive Counterfeit Label E-Tailing Market Size, By Country, 2014–2021 (USD Billion)
Table 72 Automotive E-Tailing Market Applications, By Vendor Type, 2014- 2021 (USD Billion)
Table 73 Oem Vendor: Automotive E-Tailing Market Applications Size, By Region, 2014–2021 (USD Billion)
Table 74 Asia-Pacific:Oem Vendor Market Applications Size, By Country, 2014–2021 (USD Billion)
Table 75 Europe: Oem Vendor Market Applications Size, By Country, 2014–2021 (USD Billion)
Table 76 North America: Oem Vendor Market Applications Size, By Country, 2014–2021 (USD Billion)
Table 77 Rest of the World: Oem Vendor Market Applications Size, By Country, 2014–2021 (USD Billion)
Table 78 Third Party Vendor: Automotive E-Tailing Market Applications Size, By Region, 2014–2021 (USD Billion)
Table 79 Asia-Pacific: Automotive Third Party Vendor E-Tailing Market Size, By Country, 2014–2021 (USD Billion)
Table 80 Europe: Automotive Third Party Vendor E-Tailing Market Size, By Country, 2014–2021 (USD Billion)
Table 81 North America: Automotive Third Party Vendor E-Tailing Market Size, By Country, 2014–2021 (USD Billion)
Table 82 Rest of the World: Automotive Third Party Vendor E-Tailing Market Size, By Country, 2014–2021 (USD Billion)
Table 83 E-Commerce Software Platform Market, 2014–2021 (USD Million)
Table 84 E-Commerce Software Platform, By Region, 2014–2021 (USD Million)
Table 85 Asia-Pacific: E-Commerce Software Platform, 2014–2021 (USD Million)
Table 86 Asia Pacific: E-Commerce Software Platform, By County, 2014–2021 (USD Million)
Table 87 North America: E-Commerce Software Platform, 2014–2021 (USD Million)
Table 88 North America: E-Commerce Software Platform, By County, 2014–2021 (USD Million)
Table 89 Europe: E-Commerce Software Platform, 2014–2021 (USD Million)
Table 90 Europe: E-Commerce Software Platform, By County, 2014–2021 (USD Million)
Table 91 RoW: E-Commerce Software Platform, 2014–2021 (USD Million)
Table 92 RoW: E-Commerce Software Platform, By County, 2014–2021 (USD Million)
Table 93 Mergers and Acquisition 2010–2016
Table 94 Agreements/Partnerships/Collaborations 2015–2016
Table 95 Expansions, 2015–2016
Table 96 Joint Ventures, 2014–2016
List of Figures (68 Figures)
Figure 1 Automotive E-Tailing Market Applications: Markets Covered
Figure 2 Research Design
Figure 3 Research Design Model
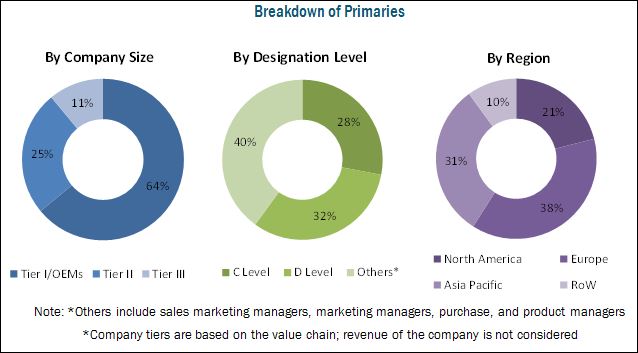
Figure 4 Breakdown of Primary Interviews: By Company Type, Designation, & Region
Figure 5 Gross Domestic Product (GDP) vs All Vehicle Sales
Figure 6 Urbanization Percentage and All Vehicle Sales
Figure 7 Road Networks of Key Countries
Figure 8 Passenger Car Production, 2014–2015
Figure 9 Market Size Estimation Methodology: Top–Down Approach
Figure 10 Market Size Estimation Methodology: Bottom–Up Approach
Figure 11 Automotive E-Tailing Market Applications, By Region, 2016 & 2021
Figure 12 Asia-Pacific and North America Projected to Be the Fastest Growing Market During the Forecast Period (2016–2021)
Figure 13 Market Applications, By Country: China is Projected to Be the Largest Market By 2021
Figure 14 Market Applications, By Vendor Type (2016–2021)
Figure 15 Third Party Vendors to Register the Highest CAGR During the Forecast Period (2016–2021)
Figure 16 Market Applications, By Component Type: Tires and Wheels to Incur the Highest Market in 2016
Figure 17 Market Applications, By Label Type, 2016 & 2021: Genuine Labels to Register the Highest Growth During the Forecast Period
Figure 18 Automotive E-Tailing Market Applications : By Vehicle Type, 2016 & 2021
Figure 19 E-Commerce Software Platform Market, By Country 2016 & 2021
Figure 20 Growing Trend of Online Retailing is Driving the Growth of Automotive E-Tailing Market Applications (2016–2021)
Figure 21 China, U.S., & India Estimated to Witness the Highest Growth During the Forecast Period (2016–2021)
Figure 22 North America to Dominate the Automotive OEM Vendor E-Tailing Market (2016–2021)
Figure 23 Asia-Pacific to Dominate the Automotive Third Party Vendor E-Tailing Market (2016-2021)
Figure 24 Genuine Labels to Dominate the Automotive E-Tailing Market Applications During the Forecast Period
Figure 25 Tires and Wheels Projected to Be Fastest Growing Segment in the Automotive Component E-Tailing Market, By 2016–2021
Figure 26 Valves and Filters Projected to Register the Highest Growth Rate in the Automotive Component E-Tailing Market, By 2016 – 2021
Figure 27 Passenger Car Segment to Dominate the Automotive E-Tailing Market Applications During the Forecast Period
Figure 28 North America is Leading the E-Commerce Software Platform Market in 2016
Figure 29 China Dominates the E-Commerce Software Platform Market in APAC in 2016
Figure 30 Market Applications: Market Segmentation
Figure 31 Increase in Internet Penetration and Present Vehicle Production Will Push the Market for Automotive E-Tailing
Figure 32 Porter’s Five Forces Analysis
Figure 33 Asia-Pacific: Estimated to Grow at the Highest CAGR During the Forecast Period
Figure 34 Asia-Pacific : Market Opportunities for the Automotive E-Tailing Market Applications
Figure 35 Chinese Market Applications Projected to Register the Highest Growth By 2021
Figure 36 North America: Market Applications Trends
Figure 37 U.S.: Adoption of Automotive E-Tailing in the U.S. Estimated to Increase Owing to the Rising Need for Comfort While Shopping, 2016–2021
Figure 38 Europe: Automotive E-Tailing Market Applications Trends
Figure 39 German Market Applications: Third Party Vendor Market to Grow at the Highest CAGR, 2016-2021
Figure 40 RoW: Market Applications Trends
Figure 41 Brazil Market Applications, Third Party to Grow at the Highest CAGR, 2016-2021
Figure 42 Market Applications, By Vehicle Type, 2016 vs 2021 (USD Billion)
Figure 43 Market Applications, By Component, 2016–2021 (USD Billion)
Figure 44 Market Applications for Infotainment and Multimedia, By Region, 2014-2021 (USD Billion)
Figure 45 Automotive E-Tailing Market Applications for Interior Accessories, By Region, 2016-2021 (USD Billion)
Figure 46 Market Applications for Engine Components, By Components Break-Up, 2016-2021 (USD Billion)
Figure 47 Market Applications for Engine Components, By Region, 2016-2021 (USD Billion)
Figure 48 Market Applications for Tires and Wheel, By Region, 2016-2021 (USD Billion)
Figure 49 Market Applications for Electrical Products, By Region, 2016-2021 (USD Billion)
Figure 50 Automotive E-Tailing By Product Label Type 2016 vs 2021 (USD Billion)
Figure 51 Market Applications, By Vendor Type, 2016 vs 2021 (USD Billion)
Figure 52 Companies Adopted Acquisition, Joint Venture, Strategic Alliance and Expansion as the Key Growth Strategy From 2010 to 2016
Figure 53 Market Evaluation Framework: Acquistions Fuelled Market Growth From 2013 to 2016
Figure 54 Autozone, Inc. : Company Snapshot
Figure 55 Autozone, Inc. : SWOT Analysis
Figure 56 Alibaba Group Holding Ltd: Company Snapshot
Figure 57 Alibaba Group Holding Ltd: SWOT Analysis
Figure 58 Amazon.Com, Inc. : Company Snapshot
Figure 59 Amazon.Com, Inc.: SWOT Analysis
Figure 60 Robert Bosch GmbH: Company Snapshot
Figure 61 Robert Bosch GmbH: SWOT Analysis
Figure 62 Wal-Mart Stores, Inc.: Company Snapshot
Figure 63 Wal-Mart Stores, Inc.: SWOT Analysis
Figure 64 Ebay Inc.: Company Snapshot
Figure 65 Delticom AG : Company Snapshot
Figure 66 O’reilly Automotive Inc.: Company Snapshot
Figure 67 Advance Auto Parts: Company Snapshot
Figure 68 Flipkart: Company Snapshot


Growth opportunities and latent adjacency in Automotive E-tailing Market