Automotive Switch Market by Type (Knob, Lever, Button, Touchpad & Others), Switch Application (HVAC, Indicator, Electronic, Engine Management, Power Windows, Ignition, Multi-purpose & Others), Vehicle Type and Region - Global Forecast to 2026
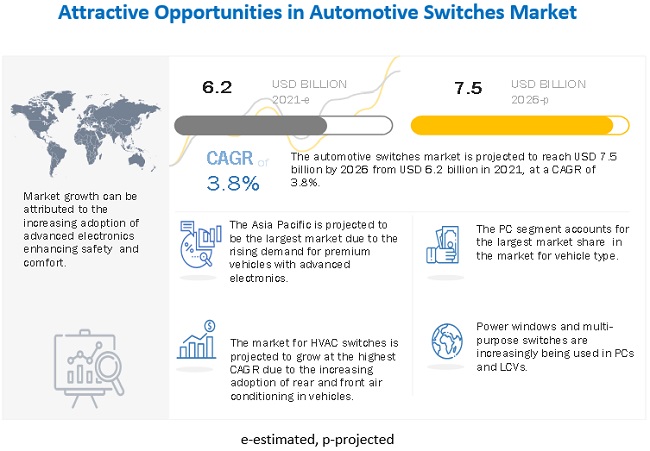
The automotive switch market size was valued at USD 6.2 billion in 2021 and is projected to reach USD 7.5 billion by 2026, at a CAGR of 3.8% during the forecast period. The demand for automotive switches is driven by the growing demand for luxury vehicle models, increasing adoption rate of systems such as HVAC, power windows in PCs, LCVs and HCVs.
To know about the assumptions considered for the study, Request for Free Sample Report
Market Dynamics
Driver: Increasing penetration of electronics in vehicles produced worldwide
There is an increase in the penetration of electronic systems in the vehicles across the globe owing to the comfort and ease it provides to the driver. This has led to the increasing preference for vehicles with more electronic functions that are user friendly and less complex. For instance, the traditional ignition switch in vehicles was used to be operated via key in order to start the vehicle which is now being replaced by the push-button start/stop ignition. Many more traditional functions of a vehicle are now being replaced with electronic systems. This is driving the automotive switch market for globally.
Restraint: Fluctuating prices of raw materials used in manufacturing switches
The raw materials used to produce an electrical switch consist of materials such as plastics, metal sheets, and plating material. The plating materials used is usually noble metals, the prices of which fluctuates in the market, which in turn causes variation in the price of the switches produced, restraining its growth in the market. The conductive parts in a switch which make and break the electrical connection, known as contacts, are typically made of silver or silver-cadmium alloy, the conductive properties of which are not significantly compromised by surface corrosion or oxidation. The cost of silver also regularly fluctuates in the market, further varying the cost of the switches. All these reasons restrain the growth of automotive switch market.
Opportunities: Growing vehicle sales, production, & parc in emerging countries
Vehicle sales and production is increasing in developing nations as a result of increased disposable income of consumers, industrialization, and urbanization. Rapid technological advancements and infrastructure growth in developing countries has led to rise in demand for vehicles. Growth in the automotive switches market is directly proportional to the production and sales of vehicles. The average disposable income of people in developing countries has increased, owing to growing economies in developing countries, and has led to the higher standards of living of people in developing countries. This high growth in sales has led to an increase in demand for automotive switches. The vehicle parc volumes in the developing countries have also increased in past five years and are projected to continue growing. The primary reason for this growth is increase in average life of vehicles, and growing production and sales volume in these countries. The developing nation, owing to their higher vehicle parc volumes, becomes a potential opportunity for automotive switches aftermarket.
Challenges: No as such product differentiation in automotive switches
Switches as a product have very less differentiation in terms of function and quality. This makes products very similar to those produced by other switches manufacturers. Thus, there is no competitive edge as such that a manufacturer may have as compared to its fellow competitors. This makes the market wide open for its customers with large number of options available. This is a huge challenge faced by the automotive switches manufacturers, given the lack of differentiation in its products.
To know about the assumptions considered for the study, download the pdf brochure
Transmission system switch is expected to be the largest-growing segment of the automotive switch market, by application, during the forecast period
The Asia Pacific is projected to be the largest transmission system market. Due to the increasing adoption of automatic transmission, the transmission system switch market is projected to grow significantly. In countries such as India and China, the market for automatic transmission is rising rapidly, driving the market in the Asia Pacific region. Also, as installation of automtic transmission is highest in North America, the market is significant. Also, as premium vehicles are gaining popularity in Germany, the UK, transmission system switch market is expected to grow rapidly in the coming years.
Button is the largest and fastest segment in the automotive switch market, by type
Button holds the largest and is the fastest growing segment in the forecast period. Buttons are used in HVAC systems, power winodws, transmission system, infotianmen display etc. As cars, LCVs are increasingly being equipped with advanced features, the number for buttons is expected to increase. Also, taking into consideration, the growing average selling price, the button market size is expected to witness a strong growth.
In the vehicle type segment, PC is expected to be the largest-growing segment, during the forecast period
PC holds majority of the market share in global vehicle production, with China leading the trend. In PCs, Buttons are used in HVAC system, electronic systems while levers are used in multi-purpose switches, reverse brake lamp switch and knobs are used in radio, ignition switch, AC systems. With major automakers instaling new features in their models for enhanced safety and comfort, the automotive switches market is expected to get a boost. PC is expected to remain the largest market among LCV and HCV in the forecast period.
Asia Pacific is expected to account for the largest market size during the forecast period
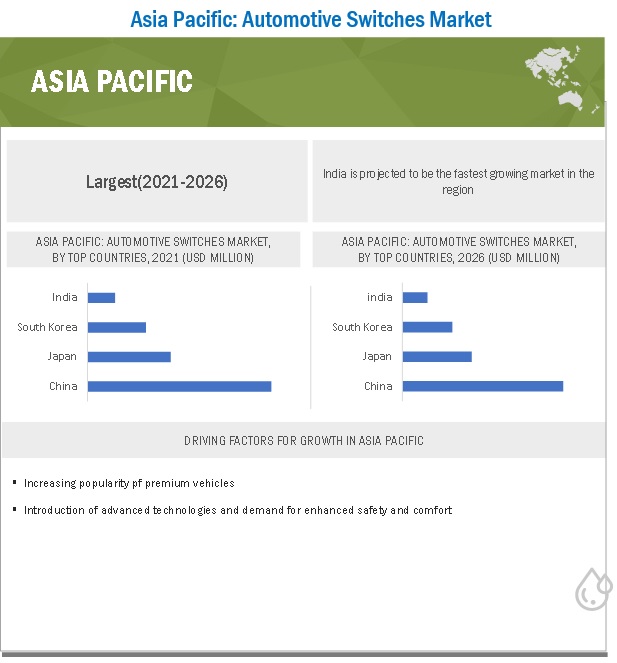
Asia Pacific is expected to be the largest market in the forecast period. The main reason driving this trend is the growing popularity of luxury vehicles, particularly in China. Also, the growing penetration of advanced systems such as automatic transmission, infotainment display, front & rear air conditioning in vehicles produced is propelling the automotive switches market in Asia Pacific. Japan and South Korea already have higher penetration of electronics, and thus have a significant share in Asia Paific. Also, increasing vehicle production, with Asia Pacific leading among other regions, Asia Pacific is expected to be the largest in the coming years.
Key Market Players
The automotive switch market is dominated by global players and comprises several regional players as well. The key players in the automotive switches market are Robert Bosch GmbH (Germany), Continental AG (Germany), ZF Friedrichshafen AG(Germany), Alps Alpine Co., Ltd. (Japan), Panasonic Corporation (Japan).
Scope of the Report
|
Report Metric |
Details |
|
Market Size Available for Years |
2018–2026 |
|
Base Year Considered |
2020 |
|
Forecast Period |
2021–2026 |
|
Forecast Units |
Value (USD million) and Volume (‘000 units) |
|
Segments Covered |
Automotive switches by Type, Application, Vehicle Type, and Region |
|
Geographies Covered |
Asia Pacific, Europe, North America, and RoW |
|
Companies Covered |
Robert Bosch GmbH (Germany), Continental AG (Germany), ZF Friedrichshafen AG(Germany), Alps Alpine Co., Ltd. (Japan), Panasonic Corporation (Japan) |
Available customizations
With the given market data, MarketsandMarkets offers customizations in accordance with the company’s specific needs.
PC Automotive Switches Market, by Type
- Knob
- Lever
- Button
- Touchpad
- Other switches
LCV Automotive Switches Market, by Type
- Knob
- Lever
- Button
- Touchpad
- Other switches
HCV Automotive Switches Market, by Type
- Knob
- Lever
- Button
- Touchpad
- Other switches
Frequently Asked Questions (FAQ):
How big is the automotive switch market?
The automotive switches market is estimated to be USD 6.2 billion in 2021 and is projected to reach USD 7.5 billion by 2026 at a CAGR of 3.8%.
Who are the top key players in the automotive switches market?
The automotive switches market is dominated by global players and comprises several regional players as well. The key players in the automotive switches market are Robert Bosch GmbH (Germany), Continental AG (Germany), ZF Friedrichshafen AG(Germany), Alps Alpine Co., Ltd. (Japan), Panasonic Corporation (Japan). Moreover, these companies develop new products as per market demands and have effective supply chain strategies. Such advantages give these companies an edge over other companies that are component providers.
What are the trends in the automotive switch market?
Increasing trend of adoption of electronics is anticipated to create new revenue pockets for the automotive switches market.
Increasing demand for lightweight vehicle parts is projected to drive the demand for switches
What is the future of the automotive switch market?
Growing vehicle production in almost all region coupled with increasing demand for premium and luxury vehicles is expected to drive automotive switches market in he forecast period. Not only in ICE, but growing sales of electric vehicles is going to give a huge boost to the switches market. .
To speak to our analyst for a discussion on the above findings, click Speak to Analyst

TABLE OF CONTENTS
1 INTRODUCTION (Page No. - 18)
1.1 OBJECTIVES OF THE STUDY
1.2 AUTOMOTIVE SWITCH MARKET DEFINITION
1.3 MARKETS COVERED
FIGURE 1 MARKET SEGMENTATION
1.4 CURRENCY
1.5 PACKAGE SIZE
1.6 LIMITATIONS
1.7 STAKEHOLDERS
1.8 SUMMARY OF CHANGES
2 RESEARCH METHODOLOGY (Page No. - 21)
2.1 RESEARCH DATA
FIGURE 2 RESEARCH DESIGN
FIGURE 3 RESEARCH METHODOLOGY MODEL
2.2 SECONDARY DATA
2.2.1 KEY SECONDARY SOURCES
2.2.2 KEY DATA FROM SECONDARY SOURCES
2.3 PRIMARY DATA
FIGURE 4 BREAKDOWN OF PRIMARY INTERVIEWS: BY COMPANY TYPE, DESIGNATION, & REGION
2.3.1 SAMPLING TECHNIQUES & DATA COLLECTION METHODS
2.3.2 PRIMARY PARTICIPANTS
2.4 AUTOMOTIVE SWITCH MARKET SIZE ESTIMATION
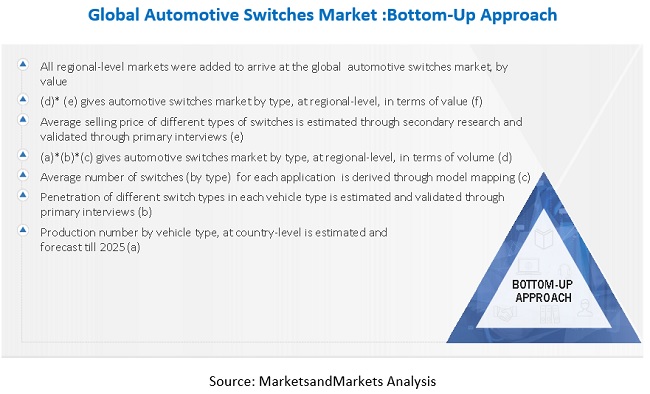
FIGURE 5 MARKET SIZE ESTIMATION METHODOLOGY: BOTTOM-UP APPROACH
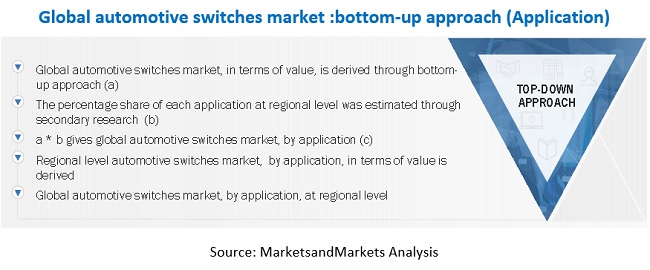
FIGURE 6 MARKET SIZE ESTIMATION METHODOLOGY: TOP-DOWN APPROACH
3 EXECUTIVE SUMMARY (Page No. - 27)
3.1 PRE & POST COVID-19 SCENARIO
FIGURE 7 PRE & POST COVID-19 SCENARIO: AUTOMOTIVE SWITCH AUTOMOTIVE SWITCH MARKET, 2018-2026 (USD MILLION)
TABLE 1 MARKET: PRE VS. POST COVID-19 SCENARIO, 2018–2026 (USD MILLION)
3.2 REPORT SUMMARY
FIGURE 8 AUTOMOTIVE SWITCH: MARKET OUTLOOK
FIGURE 9 AUTOMOTIVE SWITCHES MARKET, BY TYPE, 2021 VS. 2026(USD MILLION)
4 PREMIUM INSIGHTS (Page No. - 31)
4.1 ATTRACTIVE OPPORTUNITIES IN ELECTRONIC SWITCH MARKET
FIGURE 10 STRINGENT EMISSION NORMS ARE DRIVING THE AUTOMOTIVE SWITCH MARKET
4.2 AUTOMOTIVE SWITCHES MARKET, BY TYPE
FIGURE 11 BUTTON SWITCH SEGMENT PROJECTED TO LEAD THE AUTOMOTIVE SWITCHES MARKET, BY TYPE, 2021 VS. 2026 (USD MILLION)
4.3 AUTOMOTIVE SWITCHES MARKET, BY APPLICATION
FIGURE 12 ELECTRONIC SWITCH SEGMENT PROJECTED TO LEAD THE AUTOMOTIVE SWITCHES MARKET, BY APPLICATION, 2021 VS. 2026 (USD MILLION)
4.4 AUTOMOTIVE SWITCHES MARKET, BY VEHICLE TYPE
FIGURE 13 PASSENGER CAR SEGMENT TO DOMINATE THE MARKET, BY VEHICLE TYPE, 2021 VS. 2026 (USD MILLION)
4.5 AUTOMOTIVE SWITCHES MARKET, BY REGION
FIGURE 14 ASIA PACIFIC ESTIMATED TO ACCOUNT FOR THE LARGEST SHARE OF THE MARKET IN 2021
5 AUTOMOTIVE SWITCH MARKET OVERVIEW (Page No. - 34)
5.1 INTRODUCTION
5.2 MARKET DYNAMICS
FIGURE 15 INCREASING DEMAND FOR LIGHT PASSENGER VEHICLES & HEAVY-DUTY VEHICLES TO DRIVE THE MARKET FOR AUTOMOTIVE SWITCH IN THE FUTURE
5.2.1 DRIVERS
5.2.1.1 Increasing demand for light passenger vehicles & heavy-duty vehicles
5.2.1.2 Increasing penetration of electronics in vehicles produced worldwide
5.2.1.3 Growing demand of electric vehicles globally
FIGURE 16 INCREASING ELECTRIC VEHICLE SALES, 2020 VS. 2025 (‘000 UNITS)
TABLE 2 IMPACT OF DRIVERS ON THE AUTOMOTIVE SWITCHES MARKET
5.2.2 RESTRAINTS
5.2.2.1 Fluctuating prices of raw materials used in manufacturing switches
TABLE 3 IMPACT OF RESTRAINTS ON THE AUTOMOTIVE SWITCHES MARKET
5.2.3 OPPORTUNITIES
5.2.3.1 Partnerships between major OEMs & domestic players
5.2.3.2 Growing vehicle sales, production, & parc in emerging countries
FIGURE 17 INCREASING VEHICLE PRODUCTION, 2015–2019 (‘000 UNITS)
TABLE 4 IMPACT OF OPPORTUNITIES ON THE AUTOMOTIVE SWITCHES MARKET
5.2.4 CHALLENGES
5.2.4.1 No as such product differentiation in automotive switches
TABLE 5 IMPACT OF CHALLENGES ON THE AUTOMOTIVE SWITCHES MARKET
5.3 BURNING ISSUE
5.3.1 DISRUPTIVE TECHNOLOGIES SUCH AS VOICE AND GESTURE CONTROL BEING INTRODUCED IN THE MARKET
5.4 AUTOMOTIVE SWITCH MARKET: SCENARIO ANALYSIS
FIGURE 18 MARKET: COVID-19 SCENARIOS ANALYSIS
5.4.1 MOST LIKELY/REALISTIC SCENARIO
TABLE 6 MARKET, (REALISTIC SCENARIO), BY REGION, 2018–2026 (USD MILLION)
5.4.2 HIGH COVID-19 IMPACT SCENARIO
TABLE 7 MARKET (HIGH COVID-19 IMPACT SCENARIO), BY REGION, 2018–2026 (USD MILLION)
5.4.3 LOW COVID-19 IMPACT SCENARIO
TABLE 8 MARKET (LOW COVID-19 IMPACT SCENARIO), BY REGION, 2018–2026 (USD MILLION)
5.5 ECOSYSTEM
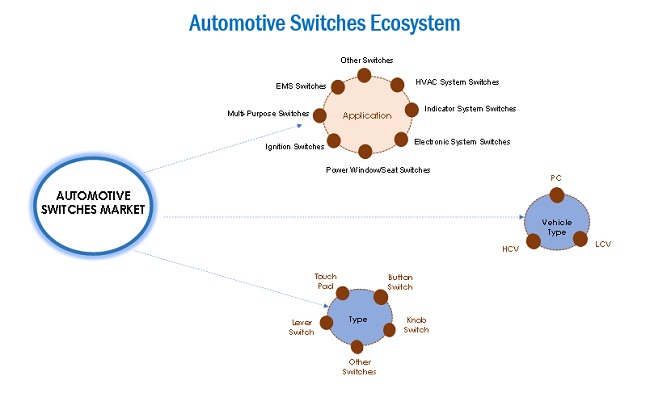
FIGURE 19 ECOSYSTEM: MARKET
5.6 TECHNOLOGY ANALYSIS
5.7 CASE STUDY ANALYSIS
5.7.1 FIRST FULLY INTEGRATED AUTOMOTIVE ECALL SWITCH
5.8 PATENT ANALYSIS
TABLE 9 PATENTS, 2010-2020
5.9 REGULATORY AND TARIFF LANDSCAPE
5.10 PRICING ANALYSIS
TABLE 10 AUTOMOTIVE SWITCH PRICING ANALYSIS, BY TYPE, 2021 (USD)
5.11 VALUE CHAIN ANALYSIS
FIGURE 20 VALUE CHAIN ANALYSIS: MAJOR VALUE IS ADDED DURING MANUFACTURING & ASSEMBLY PHASES
5.12 PORTER’S FIVE FORCES ANALYSIS
FIGURE 21 PORTER’S FIVE FORCES ANALYSIS: AUTOMOTIVE SWITCHES MARKET
TABLE 11 AUTOMOTIVE SWITCHES MARKET: IMPACT OF PORTER’S 5 FORCES
5.12.1 THREAT OF NEW ENTRANTS
5.12.2 THREAT OF SUBSTITUTES
5.12.3 BARGAINING POWER OF SUPPLIERS
5.12.4 BARGAINING POWER OF BUYERS
5.12.5 INTENSITY OF COMPETITIVE RIVALRY
6 AUTOMOTIVE SWITCH MARKET, BY TYPE (Page No. - 51)
6.1 INTRODUCTION
6.1.1 RESEARCH METHODOLOGY
6.1.2 ASSUMPTIONS
FIGURE 22 MARKET, BY TYPE, 2021 VS 2026 (USD MILLION)
TABLE 12 MARKET SIZE, BY TYPE, 2018–2020 (‘000 UNITS)
TABLE 13 MARKET SIZE, BY TYPE, 2021–2026 (‘000 UNITS)
TABLE 14 MARKET SIZE, BY TYPE, 2018–2020 (USD MILLION)
TABLE 15 MARKET SIZE, BY TYPE, 2021–2026 (USD MILLION)
6.2 KNOB SWITCH
TABLE 16 AUTOMOTIVE KNOB SWITCH MARKET SIZE, BY REGION, 2018–2020 (‘000 UNITS)
TABLE 17 MARKET SIZE, BY REGION, 2021–2026 (‘000 UNITS)
TABLE 18 MARKET SIZE, BY REGION, 2018–2020 (USD MILLION)
TABLE 19 MARKET SIZE, BY REGION, 2021–2026 (USD MILLION)
6.3 LEVER SWITCH
TABLE 20 AUTOMOTIVE LEVER SWITCH MARKET SIZE, BY REGION, 2018–2020 (‘000 UNITS)
TABLE 21 MARKET SIZE, BY REGION, 2021–2026 (‘000 UNITS)
TABLE 22 MARKET SIZE, BY REGION, 2018–2020 (USD MILLION)
TABLE 23 MARKET SIZE, BY REGION, 2021–2026 (USD MILLION)
6.4 BUTTON SWITCH
TABLE 24 AUTOMOTIVE BUTTON SWITCH MARKET SIZE, BY REGION, 2018–2020 (‘000 UNITS)
TABLE 25 MARKET SIZE, BY REGION, 2021–2026 (‘000 UNITS)
TABLE 26 MARKET SIZE, BY REGION, 2018–2020 (USD MILLION)
TABLE 27 MARKET SIZE, BY REGION, 2021–2026 (USD MILLION)
6.5 TOUCHPAD
TABLE 28 AUTOMOTIVE TOUCHPAD MARKET SIZE, BY REGION, 2018–2020 (‘000 UNITS)
TABLE 29 MARKET SIZE, BY REGION, 2021–2026 (‘000 UNITS)
TABLE 30 MARKET SIZE, BY REGION, 2018–2020 (USD MILLION)
TABLE 31 MARKET SIZE, BY REGION, 2021–2026 (USD MILLION)
6.6 OTHER SWITCH
TABLE 32 AUTOMOTIVE OTHER SWITCH MARKET SIZE, BY REGION, 2018–2020 (‘000 UNITS)
TABLE 33 MARKET SIZE, BY REGION, 2021–2026 (‘000 UNITS)
TABLE 34 MARKET SIZE, BY REGION, 2018–2020 (USD MILLION)
TABLE 35 MARKET SIZE, BY REGION, 2021–2026 (USD MILLION)
7 AUTOMOTIVE SWITCH MARKET, BY AUTOMOTIVE APPLICATION (Page No. - 62)
7.1 INTRODUCTION
7.1.1 RESEARCH METHODOLOGY
7.1.2 ASSUMPTIONS
FIGURE 23 MARKET, BY APPLICATION, 2021 VS 2026 (USD MILLION)
TABLE 36 MARKET SIZE, BY APPLICATION, 2018–2020 (USD MILLION)
TABLE 37 MARKET SIZE, BY APPLICATION, 2021–2026 (USD MILLION)
7.2 HVAC SYSTEM SWITCH
7.2.1 AIR CONDITIONER FAN SWITCH
TABLE 38 AIR CONDITIONER FAN SWITCH MARKET SIZE, BY REGION, 2018–2020 (USD MILLION)
TABLE 39 AIR CONDITIONER FAN SWITCH MARKET SIZE, BY REGION, 2021–2026 (USD MILLION)
7.2.2 AIR CONDITIONER TEMPERATURE SWITCH
TABLE 40 AIR CONDITIONER TEMPERATURE SWITCH MARKET SIZE, BY REGION, 2018–2020 (USD MILLION)
TABLE 41 AIR CONDITIONER TEMPERATURE SWITCH MARKET SIZE, BY REGION, 2021–2026 (USD MILLION)
7.2.3 BLOWER SWITCH
TABLE 42 BLOWER SWITCH MARKET SIZE, BY REGION, 2018–2020 (USD MILLION)
TABLE 43 BLOWER SWITCH MARKET SIZE, BY REGION, 2021–2026 (USD MILLION)
7.3 INDICATOR SYSTEM SWITCH
7.3.1 BRAKE LAMP SWITCH
TABLE 44 BRAKE LAMP SWITCH MARKET SIZE, BY REGION, 2018–2020 (USD MILLION)
TABLE 45 BRAKE LAMP SWITCH MARKET SIZE, BY REGION, 2021–2026 (USD MILLION)
7.3.2 GEAR SELECTOR SWITCH
TABLE 46 GEAR SELECTOR SWITCH MARKET SIZE, BY REGION, 2018–2020 (USD MILLION)
TABLE 47 GEAR SELECTOR SWITCH MARKET SIZE, BY REGION, 2021–2026 (USD MILLION)
7.3.3 REVERSE LAMP SWITCH
TABLE 48 REVERSE LAMP SWITCH MARKET SIZE, BY REGION, 2018–2020 (USD MILLION)
TABLE 49 REVERSE LAMP SWITCH MARKET SIZE, BY REGION, 2021–2026 (USD MILLION)
7.4 ELECTRONIC SYSTEM SWITCH
7.4.1 TRANSMISSION SYSTEM SWITCH
TABLE 50 TRANSMISSION SYSTEM SWITCH MARKET SIZE, BY REGION, 2018–2020 (USD MILLION)
TABLE 51 TRANSMISSION SYSTEM SWITCH MARKET SIZE, BY REGION, 2021–2026 (USD MILLION)
7.4.2 INHIBITOR SWITCH
TABLE 52 INHIBITOR SYSTEM SWITCH MARKET SIZE, BY REGION, 2018–2020 (USD MILLION)
TABLE 53 INHIBITOR SYSTEM SWITCH MARKET SIZE, BY REGION, 2021–2026 (USD MILLION)
7.5 EMS SWITCH
7.5.1 OIL PRESSURE SWITCH
TABLE 54 OIL PRESSURE SWITCH MARKET SIZE, BY REGION, 2018–2020 (USD MILLION)
TABLE 55 OIL PRESSURE SWITCH MARKET SIZE, BY REGION, 2021–2026 (USD MILLION)
7.5.2 THERMO SWITCH
TABLE 56 THERMO SWITCH MARKET SIZE, BY REGION, 2018–2020 (USD MILLION)
TABLE 57 THERMO SWITCH MARKET SIZE, BY REGION, 2021–2026 (USD MILLION)
7.6 POWER WINDOW SWITCH
TABLE 58 POWER WINDOW SWITCH MARKET SIZE, BY REGION, 2018–2020 (USD MILLION)
TABLE 59 POWER WINDOW SWITCH MARKET SIZE, BY REGION, 2021–2026 (USD MILLION)
7.7 IGNITION SWITCH
TABLE 60 IGNITION SWITCH MARKET SIZE, BY REGION, 2018–2020 (USD MILLION)
TABLE 61 IGNITION SWITCH MARKET SIZE, BY REGION, 2021–2026 (USD MILLION)
7.8 MULTI-PURPOSE SWITCH
TABLE 62 MULTI-PURPOSE SWITCH MARKET SIZE, BY REGION, 2018–2020 (USD MILLION)
TABLE 63 MULTI-PURPOSE SWITCH MARKET SIZE, BY REGION, 2021–2026 (USD MILLION)
7.9 OTHER SWITCH
7.9.1 HOOD SWITCH
TABLE 64 HOOD SWITCH MARKET SIZE, BY REGION, 2018–2020 (USD MILLION)
TABLE 65 HOOD SWITCH MARKET SIZE, BY REGION, 2021–2026 (USD MILLION)
7.9.2 TRUNK LID SWITCH
TABLE 66 TRUNK LID SWITCH MARKET SIZE, BY REGION, 2018–2020 (USD MILLION)
TABLE 67 TRUNK LID SWITCH MARKET SIZE, BY REGION, 2021–2026 (USD MILLION)
8 AUTOMOTIVE SWITCH MARKET, BY VEHICLE TYPE (Page No. - 78)
8.1 INTRODUCTION
8.1.1 RESEARCH METHODOLOGY
8.1.2 ASSUMPTIONS
FIGURE 24 MARKET, BY VEHICLE TYPE, 2021 VS 2026 (USD MILLION)
TABLE 68 MARKET SIZE, BY VEHICLE TYPE, 2018–2020 (‘000 UNITS)
TABLE 69 MARKET SIZE, BY VEHICLE TYPE, 2021-2026 (‘000 UNITS)
TABLE 70 MARKET SIZE, BY VEHICLE TYPE, 2018–2020 (USD MILLION)
TABLE 71 MARKET SIZE, BY VEHICLE TYPE, 2021–2026 (USD MILLION)
8.2 PASSENGER CAR
TABLE 72 PASSENGER CAR SWITCH MARKET SIZE, BY REGION, 2018–2020 (‘000 UNITS)
TABLE 73 PASSENGER CAR SWITCH MARKET SIZE, BY REGION, 2021–2026 (‘000 UNITS)
TABLE 74 PASSENGER CAR SWITCH MARKET SIZE, BY REGION, 2018–2020 (USD MILLION)
TABLE 75 PASSENGER CAR SWITCH MARKET SIZE, BY REGION, 2021–2026 (USD MILLION)
8.3 LIGHT COMMERCIAL VEHICLE (LCV)
TABLE 76 LCV MARKET SIZE, BY REGION, 2018–2020 (‘000 UNITS)
TABLE 77 LCV SWITCH MARKET SIZE, BY REGION, 2021–2026 (‘000 UNITS)
TABLE 78 LCV SWITCH MARKET SIZE, BY REGION, 2018–2020 (USD MILLION)
TABLE 79 LCV SWITCH MARKET SIZE, BY REGION, 2021–2026 (USD MILLION)
8.4 HEAVY COMMERCIAL VEHICLE (HCV)
TABLE 80 HCV SWITCH MARKET SIZE, BY REGION, 2018–2020 (‘000 UNITS)
TABLE 81 HCV SWITCH MARKET SIZE, BY REGION, 2021–2026 (‘000 UNITS)
TABLE 82 HCV SWITCH MARKET SIZE, BY REGION, 2018–2020 (USD MILLION)
TABLE 83 HCV SWITCH MARKET SIZE, BY REGION, 2021–2026 (USD MILLION)
9 AUTOMOTIVE SWITCH MARKET, BY REGION (Page No. - 86)
9.1 INTRODUCTION
9.1.1 RESEARCH METHODOLOGY
9.1.2 ASSUMPTIONS
FIGURE 25 MARKET, BY REGION, 2021 VS 2026 (USD MILLION)
TABLE 84 MARKET SIZE, BY REGION, 2018–2020 (‘000 UNITS)
TABLE 85 MARKET SIZE, BY TYPE, BY REGION, 2021–2026 (‘000 UNITS)
TABLE 86 MARKET SIZE, BY REGION, 2018–2020 (USD MILLION)
TABLE 87 MARKET SIZE, BY REGION, 2021–2026 (USD MILLION)
9.2 ASIA PACIFIC
FIGURE 26 ASIA PACIFIC: MARKET SNAPSHOT
TABLE 88 ASIA PACIFIC: MARKET SIZE, BY COUNTRY, 2018–2020 (‘000 UNITS)
TABLE 89 ASIA PACIFIC: MARKET SIZE, BY COUNTRY, 2021–2026 (‘000 UNITS)
TABLE 90 ASIA PACIFIC: MARKET SIZE, BY COUNTRY, 2018–2020 (USD MILLION)
TABLE 91 ASIA PACIFIC: MARKET SIZE, BY COUNTRY, 2021–2026 (USD MILLION)
9.2.1 CHINA
TABLE 92 CHINA: MARKET SIZE, BY TYPE, 2018–2020 (‘000 UNITS)
TABLE 93 CHINA: MARKET SIZE, BY TYPE, 2021–2026 (‘000 UNITS)
TABLE 94 CHINA: MARKET SIZE, BY TYPE, 2018–2020 (USD MILLION)
TABLE 95 CHINA: MARKET SIZE, BY TYPE, 2021–2026 (USD MILLION)
TABLE 96 INDIA: MARKET SIZE, BY TYPE, 2018–2020 (‘000 UNITS)
TABLE 97 INDIA: MARKET SIZE, BY TYPE, 2021–2026 (‘000 UNITS)
TABLE 98 INDIA: MARKET SIZE, BY TYPE, 2018–2020 (USD MILLION)
TABLE 99 INDIA: MARKET SIZE, BY TYPE, 2021–2026 (USD MILLION)
9.2.2 JAPAN
TABLE 100 JAPAN: MARKET SIZE, BY TYPE, 2018–2020 (‘000 UNITS)
TABLE 101 JAPAN: MARKET SIZE, BY TYPE, 2021–2026 (‘000 UNITS)
TABLE 102 JAPAN: AUTOMOTIVE SWITCH MARKET SIZE, BY TYPE, 2018–2020 (USD MILLION)
TABLE 103 JAPAN: MARKET SIZE, BY TYPE, 2021–2026 (USD MILLION)
9.2.3 SOUTH KOREA
TABLE 104 SOUTH KOREA: MARKET SIZE, BY TYPE, 2018–2020 (‘000 UNITS)
TABLE 105 SOUTH KOREA: MARKET SIZE, BY TYPE, 2021–2026 (‘000 UNITS)
TABLE 106 SOUTH KOREA: MARKET SIZE, BY TYPE, 2018–2020 (USD MILLION)
TABLE 107 SOUTH KOREA: MARKET SIZE, BY TYPE, 2021–2026 (USD MILLION)
9.3 NORTH AMERICA
FIGURE 27 NORTH AMERICA: MARKET SNAPSHOT
TABLE 108 NORTH AMERICA: MARKET SIZE, BY COUNTRY, 2018–2020 (‘000 UNITS)
TABLE 109 NORTH AMERICA: MARKET SIZE, BY COUNTRY, 2021–2026 (‘000 UNITS)
TABLE 110 NORTH AMERICA: MARKET SIZE, BY COUNTRY, 2018–2020 (USD MILLION)
TABLE 111 NORTH AMERICA: MARKET SIZE, BY COUNTRY, 2021–2026 (USD MILLION)
9.3.1 US
TABLE 112 US: MARKET SIZE, BY TYPE, 2018–2020 (‘000 UNITS)
TABLE 113 US: MARKET SIZE, BY TYPE, 2021–2026 (‘000 UNITS)
TABLE 114 US: MARKET SIZE, BY TYPE, 2018–2020 (USD MILLION)
TABLE 115 US: MARKET SIZE, BY TYPE, 2021–2026 (USD MILLION)
9.3.2 CANADA
TABLE 116 CANADA: MARKET SIZE, BY TYPE, 2018–2020 (‘000 UNITS)
TABLE 117 CANADA: MARKET SIZE, BY TYPE, 2021–2026 (‘000 UNITS)
TABLE 118 CANADA: MARKET SIZE, BY TYPE, 2018–2020 (USD MILLION)
TABLE 119 CANADA: MARKET SIZE, BY TYPE, 2021–2026 (USD MILLION)
9.3.3 MEXICO
TABLE 120 MEXICO: MARKET SIZE, BY TYPE, 2018–2020 (‘000 UNITS)
TABLE 121 MEXICO: MARKET SIZE, BY TYPE, 2021–2026 (‘000 UNITS)
TABLE 122 MEXICO: MARKET SIZE, BY TYPE, 2018–2020 (USD MILLION)
TABLE 123 MEXICO: MARKET SIZE, BY TYPE, 2021–2026 (USD MILLION)
9.4 EUROPE
FIGURE 28 EUROPE: AUTOMOTIVE SWITCH MARKET SNAPSHOT, 2021 VS. 2026 (USD MILLION)
TABLE 124 EUROPE: MARKET SIZE, BY COUNTRY, 2018–2020 (‘000 UNITS)
TABLE 125 EUROPE: MARKET SIZE, BY COUNTRY, 2021–2026 (‘000 UNITS)
TABLE 126 EUROPE: MARKET SIZE, BY COUNTRY, 2018–2020 (USD MILLION)
TABLE 127 EUROPE: MARKET SIZE, BY COUNTRY, 2021–2026 (USD MILLION)
9.4.1 GERMANY
TABLE 128 GERMANY: MARKET SIZE, BY TYPE, 2018–2020 (‘000 UNITS)
TABLE 129 GERMANY: MARKET SIZE, BY TYPE, 2021–2026 (‘000 UNITS)
TABLE 130 GERMANY: MARKET SIZE, BY TYPE, 2018–2020 (USD MILLION)
TABLE 131 GERMANY: MARKET SIZE, BY TYPE, 2021–2026 (USD MILLION)
9.4.2 FRANCE
TABLE 132 FRANCE: MARKET SIZE, BY TYPE, 2018–2020 (‘000 UNITS)
TABLE 133 FRANCE: MARKET SIZE, BY TYPE, 2021–2026 (‘000 UNITS)
TABLE 134 FRANCE: MARKET SIZE, BY TYPE, 2018–2020 (USD MILLION)
TABLE 135 FRANCE: MARKET SIZE, BY TYPE, 2021–2026 (USD MILLION)
9.4.3 UK
TABLE 136 UK: MARKET SIZE, BY TYPE, 2018–2020 (‘000 UNITS)
TABLE 137 UK: MARKET SIZE, BY TYPE, 2021–2026 (‘000 UNITS)
TABLE 138 UK: MARKET SIZE, BY TYPE, 2018–2020 (USD MILLION)
TABLE 139 UK: MARKET SIZE, BY TYPE, 2021–2026 (USD MILLION)
9.4.4 ITALY
TABLE 140 ITALY: MARKET SIZE, BY TYPE, 2018–2020 (‘000 UNITS)
TABLE 141 ITALY: MARKET SIZE, BY TYPE, 2021–2026 (‘000 UNITS)
TABLE 142 ITALY: MARKET SIZE, BY TYPE, 2018–2020 (USD MILLION)
TABLE 143 ITALY: MARKET SIZE, BY TYPE, 2021–2026 (USD MILLION)
9.5 REST OF THE WORLD (ROW)
FIGURE 29 ROW: AUTOMOTIVE SWITCH MARKET SNAPSHOT, 2021 VS. 2026 (USD MILLION)
TABLE 144 ROW: MARKET SIZE, BY COUNTRY, 2018–2020 (‘000 UNITS)
TABLE 145 ROW: MARKET SIZE, BY COUNTRY, 2021–2026 (‘000 UNITS)
TABLE 146 ROW: MARKET SIZE, BY COUNTRY, 2018–2020 (USD MILLION)
TABLE 147 ROW: MARKET SIZE, BY COUNTRY, 2021–2026 (USD MILLION)
9.5.1 BRAZIL
TABLE 148 BRAZIL: MARKET SIZE, BY TYPE, 2018–2020 (‘000 UNITS)
TABLE 149 BRAZIL: MARKET SIZE, BY TYPE, 2021–2026 (‘000 UNITS)
TABLE 150 BRAZIL: MARKET SIZE, BY TYPE, 2018–2020 (USD MILLION)
TABLE 151 BRAZIL: MARKET SIZE, BY TYPE, 2021–2026 (USD MILLION)
9.5.2 RUSSIA
TABLE 152 RUSSIA: MARKET SIZE, BY TYPE, 2018–2020 (‘000 UNITS)
TABLE 153 RUSSIA: MARKET SIZE, BY TYPE, 2021–2026 (‘000 UNITS)
TABLE 154 RUSSIA: MARKET SIZE, BY TYPE, 2018–2020 (USD MILLION)
TABLE 155 RUSSIA: MARKET SIZE, BY TYPE, 2021–2026 (USD MILLION)
10 COMPETITIVE LANDSCAPE (Page No. - 117)
10.1 OVERVIEW
10.2 MARKET EVALUATION FRAMEWORK
FIGURE 30 MARKET EVALUATION FRAMEWORK: AUTOMOTIVE SWITCH MARKET
FIGURE 31 MARKET SHARE ANALYSIS, 2019
10.3 REVENUE ANALYSIS OF TOP FIVE PLAYERS
10.4 KEY PLAYER STRATEGIES/RIGHT TO WIN
FIGURE 32 COMPANIES ADOPTED NEW PRODUCT DEVELOPMENT STRATEGY AS THE KEY GROWTH STRATEGY, 2018–2020
10.5 COMPETITIVE SCENARIO
10.5.1 EXPANSIONS
TABLE 156 EXPANSIONS, 2019
10.5.2 NEW PRODUCT LAUNCHES
TABLE 157 NEW PRODUCT DEVELOPMENT, 2019-2020
10.5.3 AGREEMENTS, PARTNERSHIPS, COLLABORATIONS, & JOINT VENTURES
TABLE 158 AGREEMENTS, PARTNERSHIPS, COLLABORATIONS, & JOINT VENTURES, 2020
11 COMPANY PROFILES (Page No. - 123)
(Business overview, Products offered, Recent developments & MnM View)*
11.1 ROBERT BOSCH GMBH
TABLE 159 ROBERT BOSCH GMBH: BUSINESS OVERVIEW
FIGURE 33 ROBERT BOSCH GMBH: COMPANY SNAPSHOT
TABLE 160 ROBERT BOSCH GMBH: ORGANIC DEVELOPMENTS
11.2 CONTINENTAL AG
TABLE 161 CONTINENTAL AG: BUSINESS OVERVIEW
FIGURE 34 CONTINENTAL AG: COMPANY SNAPSHOT
TABLE 162 CONTINENTAL AG: ORGANIC DEVELOPMENTS
11.3 ZF FRIEDRICHSHAFEN AG
TABLE 163 ZF FRIEDRICHSHAFEN AG: BUSINESS OVERVIEW
FIGURE 35 ZF FRIEDRICHSHAFEN AG: COMPANY SNAPSHOT
TABLE 164 ZF FRIEDRICHSHAFEN AG: ORGANIC DEVELOPMENTS
11.4 ALPS ELECTRIC CO., LTD.
TABLE 165 ALPS ELECTRIC CO., LTD.: BUSINESS OVERVIEW
FIGURE 36 ALPS ELECTRIC CO., LTD.: COMPANY SNAPSHOT
TABLE 166 ALPS ALPINE CO., LTD.: ORGANIC DEVELOPMENTS
11.5 PANASONIC CORPORATION
TABLE 167 PANASONIC CORPORATION: BUSINESS OVERVIEW
FIGURE 37 PANASONIC CORPORATION: COMPANY SNAPSHOT
11.6 OMRON CORPORATION
TABLE 168 OMRON CORPORATION: BUSINESS OVERVIEW
FIGURE 38 OMRON CORPORATION: COMPANY SNAPSHOT
11.7 HELLA KGAA HUECK & CO.
TABLE 169 HELLA KGAA HUECK & CO.: BUSINESS OVERVIEW
FIGURE 39 HELLA KGAA HUECK & CO.: COMPANY SNAPSHOT
TABLE 170 HELLA KGAA HUECK & CO.: ORGANIC DEVELOPMENTS
TABLE 171 HELLA KGAA HUECK & CO.: INORGANIC DEVELOPMENTS
11.8 TOKAI RIKA CO., LTD.
TABLE 172 TOKAI RIKA CO., LTD. COMPANY: BUSINESS OVERVIEW
FIGURE 40 TOKAI RIKA CO., LTD.: COMPANY SNAPSHOT
TABLE 173 TOKAI RIKA CO., LTD.: ORGANIC DEVELOPMENTS
11.9 VALEO
TABLE 174 VALEO COMPANY: BUSINESS OVERVIEW
FIGURE 41 VALEO: COMPANY SNAPSHOT
11.10 JOHNSON ELECTRIC HOLDINGS LIMITED
TABLE 175 JOHNSON ELECTRIC COMPANY: BUSINESS OVERVIEW
FIGURE 42 JOHNSON ELECTRIC: COMPANY SNAPSHOT
TABLE 176 JOHNSON ELECTRIC: ORGANIC DEVELOPMENTS
11.11 C&K SWITCHES
TABLE 177 C&K COMPONENTS INC. COMPANY: BUSINESS OVERVIEW
11.12 TOYODENSO CO., LTD.
TABLE 178 TOYODENSO CO., LTD. COMPANY: BUSINESS OVERVIEW
*Details on Business overview, Products offered, Recent developments & MnM View might not be captured in case of unlisted companies.
11.13 ADDITIONAL COMPANIES
11.13.1 GSK INTEK CO., LTD.
TABLE 179 GSK INTEK CO., LTD. COMPANY: BUSINESS OVERVIEW
11.13.2 AUTOMOBIL ELEKTRIK
TABLE 180 AUTOMOBIL ELEKTRIK LTD. COMPANY: BUSINESS OVERVIEW
11.13.3 MARQUARDT GMBH
TABLE 181 MARQUARDT GMBH COMPANY: BUSINESS OVERVIEW
11.13.4 PREH GMBH
TABLE 182 PREH GMBH COMPANY: BUSINESS OVERVIEW
11.13.5 VIMERCATI SPA
TABLE 183 VIMERCATI SPA COMPANY: BUSINESS OVERVIEW
11.13.6 YUEQING DAIER ELECTRON CO., LTD
TABLE 184 YUEQING DAIER ELECTRON CO., LTD COMPANY: BUSINESS OVERVIEW
11.13.7 DIAMOND ELECTRIC MFG. CO., LTD.
TABLE 185 DIAMOND ELECTRIC MFG. CO., LTD. COMPANY: BUSINESS OVERVIEW
11.13.8 EAO AG
TABLE 186 EAO AG COMPANY: BUSINESS OVERVIEW
11.13.9 CEBI GROUP
TABLE 187 CEBI GROUP COMPANY: BUSINESS OVERVIEW
11.13.10 INENSY
TABLE 188 INENSY COMPANY: BUSINESS OVERVIEW
12 APPENDIX (Page No. - 151)
12.1 INSIGHTS OF INDUSTRY EXPERTS
12.2 DISCUSSION GUIDE
12.3 KNOWLEDGE STORE: MARKETSANDMARKETS’ SUBSCRIPTION PORTAL
12.4 AVAILABLE CUSTOMIZATIONS
12.5 RELATED REPORTS
12.6 AUTHOR DETAILS
The study involves four main activities to estimate the current size of the automotive switch market. Exhaustive secondary research was done to collect information on the market, such as automotive switches type and usage of switches type in automotive applications. The next step was to validate these findings, assumptions, and market analysis with industry experts across value chains through primary research. Bottom-up approaches were employed to estimate the complete market size for different segments considered under this study. Thereafter, market breakdown and data triangulation processes were used to estimate the market size of segments and subsegments.
Secondary Research
The secondary sources referred to for this research study include publications from government sources [such as country level automotive associations and organizations, Organisation for Economic Co-operation and Development (OECD), World Bank, CDC, and Eurostat]; corporate and regulatory filings (such as annual reports, SEC filings, investor presentations, and financial statements); business magazines and research journals; press releases; free and paid automotive databases [Organisation Internationale des Constructeurs d'Automobiles (OICA), MarkLines, etc.] and trade, business, and professional associations; among others. Trade websites, and technical articles have been used to identify and collect information useful for an extensive commercial study of the automotive switch market.
Primary Research
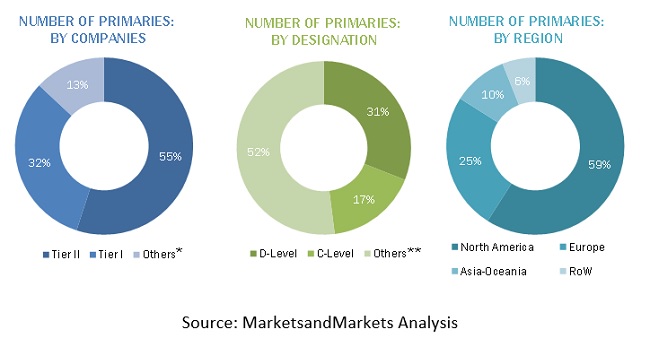
In the primary research process, various primary sources from both supply side and demand side and other stakeholders were interviewed to obtain qualitative and quantitative information on the market. Primary interviews have been conducted to gather insights such as automotive switches penetration demand by type, vehicle type, application and highest potential region for the automotive switches market. The primary sources from the supply side included various industry experts, such as CXOs, vice presidents, directors from business development, marketing, product development/innovation teams, vehicle architecture experts and related key executives from various key companies. Below is the breakdown of primary respondents:
To know about the assumptions considered for the study, download the pdf brochure
Market Size Estimation
A detailed market estimation approach was followed to estimate and validate the value of the automotive switch market and other dependent submarkets, as mentioned below:
- Key players in the automotive switches market were identified through secondary research, and their global market shares were determined through primary and secondary research.
- The research methodology included study of annual and quarterly financial reports and regulatory filings of major market players (public) as well as interviews with industry experts for detailed market insights.
- All industry-level penetration rates, percentage shares, splits, and breakdowns for the market were determined using secondary sources and verified through primary sources.
- All key macro indicators affecting the revenue growth of the market segments and subsegments have been accounted for, viewed in extensive detail, verified through primary research, and analyzed to get the validated and verified quantitative and qualitative data.
- The gathered market data was consolidated and added with detailed inputs, analyzed, and presented in this report.
- Qualitative aspects such as market drivers, restraints, opportunities, and challenges have been taken into consideration while calculating and forecasting the market size.
To know about the assumptions considered for the study, Request for Free Sample Report
Data Triangulation
After arriving at the overall market size of the global market through the above-mentioned methodology, this market was split into several segments and subsegments. The data triangulation and market breakdown procedures were employed, wherever applicable, to complete the overall market engineering process and arrive at the exact data for the market by value for the key segments and subsegments. The extrapolated market data was triangulated by studying various macro indicators and regional trends from both the demand- and supply-side participants.
Report Objectives
- To define, describe, and forecast the global automotive switch market based on type, application, vehicle type, and region
- To analyze the impact of COVID-19 on the global market (pre-COVID vs. post-COVID)
- To forecast the automotive switches market in terms of volume and value, based on:
- Type (knob, lever, button, touchpad and other switches)
- Application (HVAC system switches, Indicator system switches, electronic system switches, EMS switches, power windows switches, ignition switches, multi-purpose switches and other switches)
- Vehicle Type (passenger car, light commercial vehicle, heavy commercial vehicle)
- Key Regions—Asia Pacific (China, India, Japan, South Korea), Europe (France, Germany, Italy, the UK), North America (Canada, Mexico, and the US), and RoW (Brazil, Russia)
- To provide detailed information about major factors influencing the market (drivers, restraints, opportunities, and industry-specific challenges)
- To strategically analyze the market with respect to individual growth trends and prospects and determine the contribution of each segment to the total market
- To present various parameters such as average selling price analysis, value chain analysis, ecosystem, technology analysis, case study, market evaluation framework, value chain analysis, market share analysis, patent analysis, revenue analysis of top 5 players, regulatory landscape, and Porter’s five forces.
- To analyze the opportunities in the market for stakeholders and provide details of the competitive landscape for market leaders
- To strategically profile key players and comprehensively analyze their market shares and core competencies
- To track and analyze competitive developments, such as joint ventures, mergers & acquisitions, new product developments, and R&D, in the automotive switch market


 Generating Response ...


Growth opportunities and latent adjacency in Automotive Switch Market