Autonomous Train Market

Autonomous Train Market by Level of Automation (GOAI, GOA2, GOA3, GOA4), Technology (CBTC, ERTMS, ATC, PTC), Application, Component, Train Type (Metro, Light Rail, Bullet Train/HSR), Track Length, GOA 4 Systems and Region - Global Forecast to 2030

Report Code: AT 6300 Feb, 2024, by marketsandmarkets.com

[261 Pages Report] The global autonomous train market size was valued at USD 13.6 billion in 2024 and is expected to reach USD 18.9 billion by 2030, at a CAGR of 5.7% during the forecast period 2024-2030.  During the forecast period, Asia Pacific is expected to lead the autonomous train market, followed by Europe. Metro line installation continues to grow rapidly in the Asia Pacific area. Because of this, the automated metro market in the area seems promising. Owing to expanding government spending on transportation, the ongoing and forthcoming projects in many nations, and the developing infrastructure advancements, the Asia Pacific area is the largest growing region in global autonomous train market. The market for autonomous trains is anticipated to be driven largely by rising levels of automation and the need for safe, effective transportation.

Autonomous Train Market

To know about the assumptions considered for the study, Request for Free Sample Report

Autonomous Train Market Opportunities

To know about the assumptions considered for the study, download the pdf brochure

Market Dynamics:

Driver: Increased safety operational benefits

Trains with high levels of automation allow for greater control over speed and the creation of efficient traffic control plans. It also lessens the possibility of accidents brought on by human error.

Lawsuits arising from accidents brought on by train drivers' carelessness or incapacity are costly. The European Union and the railroad industry fund the public-private cooperation known as Shift2Rail, which aims to give the European rail network a high degree of safety, interoperability, and reliability. An operational safety enhancement tool called Automated Train Operation is utilized to assist in automating train operations. The Grade of Automation (GOA), which goes up to GOA level 4 (where the train is autonomously managed without any people on board), indicates the level of automation. Since it is simpler to guarantee human safety on transit and rapid transit systems, ATO is mostly utilized there. Most systems have a driver installed to reduce the possibility of malfunctions or emergencies. In July 2023, Hitachi Ltd developed the first fully autonomous metro- Skyline in Honolulu, US with automatic train operation (ATO) GoA4 (Grade of Automation) system.

Restraint: Slow growth rate of GDP and inadequate infrastructure spending in developing countries

The autonomous train system requires efficient infrastructure and adequate transportation services. The introduction of such advanced technology is primarily observed in the developed nations such as the U.S., U.K., and Japan. Further, the developing economies including India, Brazil, and South Africa are also planning to deploy the autonomous train system. However, due to the high cost involved in infrastructure development and land acquisition, the implementation of autonomous train transportation is at a slow pace in developing countries. The smart public transportation system requires a robust infrastructure. In developing countries such as India, Brazil, and South Africa, infrastructure is still in a very nascent stage. It requires prominent efforts for the adoption of innovative technologies to suit the existing railway networks. The market for autonomous trains would expand  slowly overall in developing nations . As number of developing nations continue to lack the funding necessary to upgrade their rail systems. A few nations with underdeveloped rail systems include Uganda, Nigeria, Albania, Uruguay, and Colombia. Investing in railway infrastructure becomes more important for nations without robust railway networks than digitalizing existing infrastructure. The implementation of modern digital technology requires a robust rail and communication infrastructure. Specific digital technologies, including passenger analytics and traffic management, are only effective when used at a specific size. It is unlikely that many developing nations with weak communication and rail systems will implement autonomous train technologies very soon.

Opportunity: Transforming mining logistics with autonomous trains

Mining firms, particularly those in the Americas, Australia, and Europe, consider Autonomous Haulage Systems (AHS) as a more cost-effective, dependable, and safe alternative for operating mines due to the high labor expenses and potential hazards associated with the terrain. Furthermore, autonomous haulage systems can improve productivity and efficiency while monitoring sustainability and safety. Bombardier’s (Canada) INTERFLO system is the optimal choice for both industrial automated haulage systems and heavy haulage lines. It provides maximum rail capacity with the least amount of wayside space.

In July 2023, Hexagon AB (Sweden), and Mineral Resources (MinRes) (Australia) jointly ventured to provide an autonomous haulage solution for a fleet of 120 fully autonomous road trains in Australia, to transform safety, productivity and sustainability in the region. Thus, autonomous trains will remove the risk of driver fatigue, lower operating costs and reduce fuel use and emissions.

Challenge: Inability of DTO systems to carry out required protection functions during emergency situations and lack of human intervention

Emergency situations in urban rail transit systems can disrupt normal operations of the railway; these situations must be dealt with immediately. Most of these emergency situations are caused by human error. Though automated metro systems have no drivers, and some work of dispatchers is carried out by DTO systems, the emergency management still heavily depends on traffic dispatchers. According to the Modular Urban Guided Rail System (MODURBAN) statement, the detection and management of hazardous situations should involve traffic dispatchers, even for autonomous or driverless trains with the highest GOA. Equipment failure, passenger behavior, social disasters, etc., may often cause emergency situations in running trains. In such scenarios, DTO systems may not be able to carry out automated protection functions. Thus, systems used in autonomous or driverless trains should be failure proof so that these systems can perform their required functions in emergency situations as well. The presence of drivers in trains results in their continuous interaction with passengers in the form of announcements, guidelines, and interpretation of various environmental conditions. However, in the absence of drivers, the link between passengers and the metro system is lost. In autonomous or driverless trains, there is no driver to detect and troubleshoot small system failures or pass the information to a control center about the system failure or current situation in the train.

Market Ecosystem

Top Companies in Autonomous Train Market

Note: Autonomous train market ecosystem consists of Tier 1: System Integrators: These are the companies responsible for designing, integrating, and testing the complete autonomous train system, including hardware, software, and communication infrastructure. Examples, Toshiba Corporation, Tech Mahindra Ltd. Tier 2: Subcomponent Suppliers: These companies provide individual components and subsystems to Tier 1 integrators, such as: sensors (lidar, radar, cameras), computing hardware and software, communication systems (5g, cellular), propulsion systems (electric motors, batteries) and Service /solution provider companies offer various services related to the operation and maintenance of autonomous trains, Atos SE and Sierra Wireless are some of them.

The Metro/Monorail train segment is estimated to be the fastest growing  market during the forecast period.

In terms of volume, the market's metro/monorail train segment is anticipated to expand at the fastest rate during the forecast period with a CAGR of 7.4%. Increasing need for urban transit and increased traffic, the metro/monorail train segment is anticipated to grow at the fastest rate. The urban cities are overcrowded during rush hours, causing significant delays. Thus, governments across various countries are investing in metro/monorail projects to develop and enhance the urban transport network, making it punctual, safe to use and comfortable. It helps to boost the growing demand for autonomous metro/monorail market segment. For instance, Dominican Republic (Latin America) has invested USD 544.84 million to build first monorail led by Alstom SA. Under this contract, Alstom SA is responsible of the system's integration, testing, and commissioning as well as the provision of 13 Inoovia monorail trains, each of these with four carriages, driverless signaling, power supply, track installation, high-speed switchgear system, and related depot equipment. To provide transportation facilities in densely populated cities, China successfully tested Skytrain monorail in May 2023 at a maximum speed of 60 km/h. The Government initiative for urban transport network and technological advancement drives the metro/monorail train segment.

GoA 2 segment is largest market to lead between 2024 and 2030 for Autonomous Train Market by Grade of Automation (GoA).

During the course of the projection period, an excellent rate of growth is anticipated in the autonomous train market, broken down by automation grade. Between 2024 and 2030, the GOA 2 segment is anticipated to dominate the market. This market sector, which is featured in a number of train classifications, represents one of the fundamental levels of automation in trains. During the forecast period, the market's GOA 4 category is anticipated to develop at the greatest CAGR. The need for greater safety as well as cost savings and rail network optimization, as well as other ongoing projects and countries investment on infrastructure and transportation, are the primary drivers of the GOA 4 segment's growth. The GOA 2 category is the largest market by grade of automation (GOA) since the GOA 4 segment is primarily driven by ongoing projects.

Camera segment is expected to be the largest market between 2024 and 2030 for Autonomous Train Market by component.

Due to the requirement to maintain track on trains for safety precautions, the camera sector is projected to have the largest market size of the autonomous train industry. Additionally, external cameras can be mounted on a train to help train operators make sure that entrances are clear, perhaps preventing accidents. Additionally, cameras aid in the monitoring of the pantograph, which is essential to the operation of trains that draw power from overhead lines. Train operators are able to determine the cause and timing of a pantograph failure owing to clear film of the device. This market is anticipated to grow from 386 thousand units in 2024 to 650 thousand units by 2030. The camera segment of the autonomous train market is growing as a result of advancements in lens technology for safety and accident prevention.

Asia Pacific held the largest market share of the autonomous market in 2030.

North American Autonomous Train Market Size, and Share

Asia Pacific is the largest and the fastest growing region in the global autonomous train market because of the development of rail infrastructure, increase in government spending on the transportation sector, and ongoing/upcoming projects in various countries of this region.  Countries such as China, Japan, India, and South Korea are supporting the growth of the railway industry. In May 2023, Japanese railways announced by 2028 driverless bullet train will be in operation for passengers. Tokaido Shinkansen bullet train is equipped with automatic train operation (ATO) technology. Also, in May 2021, Siemens announced a supply contract for main control centers with Korean National Railway’s company EntechWorld. The main SCADA (Supervisory Control and Data Acquisitions) control centers will be controlling and monitoring 3.5 million passengers daily in the Korean railway system. The trains will be operational from 2024. With the increased focus on high-speed rail programs in China, investments in the country’s rail infrastructure and equipment have increased. China announced the investments worth USD 51.6 billion in the railway sector during the first half of 2023. In February 2024, China has started high speed rail freight lines from Chongqing and Zhengzhou in central China. The new freight line covers over a thousand kilometers within five hours while carrying freight of up to 15 metric tons. In December 2021, China launched a new high-speed railway line in Shandong province and launched two new high-speed railway lines in its Central and North-East regions.

In 2023, the Dedicated Freight Corridor Corporation of India Limited (DFCCIL) announced that Eastern Dedicated Freight Corridor, are operational with full service on the entire 1,337km route from November 2023 and around 70 percent of the Western Dedicated Freight Corridor is completed. Metro systems are available in 12 cities in India, while approximately 500 km metro lines are under construction in 15 other cities. The Indian government has allocated a fund of USD 306.05 million in the budget for 2024-25 for the purchase modern Vande Bharat trains, the installation of new rails, the doubling of lines on already-existing routes, and the nationwide deployment of automated train safety technology Kavach These developments are expected to fuel the growth of the market.

Key Market Players

The global autonomous train market is dominated by major players Alstom SA (France) , Siemens AG (Germany), Hitachi Ltd. (Japan), Westinghouse Air Brake Technologies Corporation (Wabtec) (US), and Thales Group (France). These companies have strong distribution networks at a global level. In addition, these companies offer an extensive product range in this market. These companies have adopted both organic and inorganic strategies such as new product developments, acquisition, partnership and others to strengthen their market position in the autonomous train market.

Get online access to the report on the World's First Market Intelligence Cloud

  • Easy to Download Historical Data & Forecast Numbers
  • Company Analysis Dashboard for high growth potential opportunities
  • Research Analyst Access for customization & queries
  • Competitor Analysis with Interactive dashboard
  • Latest News, Updates & Trend analysis
Request Sample

Scope of the Report

Report Metric

Details

Market size available for years

2019–2030

Base year considered

2023

Forecast period

2024–2030

Forecast units

Volume (Units) and Value (USD Billion)

Segments covered

By Level of Automation, Train Type, Technology, Application, Component, GoA 4 ongoing and upcoming projects

Geographies covered

Asia Pacific, Europe, North America, Middle East & Africa and Rest of the World

Companies Covered

Alstom SA (France), Siemens AG (Germany), Hitachi Ltd. (Japan), Westinghouse Air Brake Technologies Corporation (Wabtec) (US), and Thales Group (France)

By Level of Automation
  • GoA 1
  • GoA 2
  • GoA 3
  • GoA 4
By Train Type
  • Metro/Monorail
  • Light Rail
  • High-speed Rail/Bullet Train
By Technology
  • CBTC
  • ERTMS
  • PTC
  • ATC
By Application
  • Passenger Train
  • Freight Train
By Component
  • Tachometer
  • Doppler
  • Accelerometer
  • Camera
  • Antenna
  • Radio Set
  • Odometer
  • RADAR
  • LiDAR
By Track Length
  • Asia Pacific
  • Europe
  • North America
  • Middle East & Africa
  • RoW
By GOA 4 ongoing and upcoming projects
  • Asia Pacific
  • Europe
  • North America
Based on region:
  • Asia Pacific
    • China
    • India
    • Japan
    • South Korea
  • North America
    • US
    • Canada
    • Mexico
  • Europe
    • France
    • Germany
    • UK
    • Italy
    • Spain
  • Middle East & Africa
    • UAE
    • South Africa
  • Rest of the World
    • Brazil
    • Iran

Recent Developments

  • In January 2024, Siemens AG installed ETCS in two trainsets operating in the Pääkaupunkiseudun Junakalusto Oy fleet as a part of Finnish DigiRail project. The state of Sweden will test ETCS in accordance with the most recent standards outlined in the European technical specification, TSI 2023. 
  • In January 2024, Westinghouse Air Brake Technologies Corporation (Wabtec) has developed Trip Optimizer, energy-management software to efficiently operate trains for more than 1 billion auto miles. The software automatically controls locomotive throttle and dynamic brakes to reduce fuel burn and provide efficient train handling.
  • In December 2023, Alstom SA’s Innovia monorail trains entered commercial service on Bangkok’s MRT Pink Line in Thailand. The 34.5 km Pink Line has 30 stations and will connect the heavily congested Khae Rai to Min Buri. The new monorail will be elevated and equipped with automatic train operation (ATO) grade of operation 4 (GoA4) which enables the monorail to operate in a fully automated state, without the interference of a driver or attendants.
  • In September 2023, CRRC developed articulated light rail train for Mexico City Electric Transportation Authority (STE) at CRRC Zhuzhou. It is equipped with advanced systems and barrier-free facilities.
  • In July 2023, Hitachi Ltd. has launched ‘Over and Back’ testing solution to enable the fast and seamless switching between existing interlocking (a railway signaling system) and soon to be introduce the new digital signaling system (European Train Control System – ETCS L2) as part of South East Queensland’s Cross River Rail project in Brisbane.

Frequently Asked Questions (FAQ):

To speak to our analyst for a discussion on the above findings, click Speak to Analyst

TABLE OF CONTENTS
 
1 INTRODUCTION (Page No. - 27)
    1.1 STUDY OBJECTIVES 
    1.2 MARKET DEFINITION 
           1.2.1 MARKET DEFINITION, BY TRAIN TYPE
           1.2.2 MARKET DEFINITION, BY GRADE OF AUTOMATION (GOA)
           1.2.3 MARKET DEFINITION, BY TECHNOLOGY
    1.3 INCLUSIONS AND EXCLUSIONS 
    1.4 STUDY SCOPE 
           1.4.1 MARKET SEGMENTATION
           1.4.2 REGIONS COVERED
           1.4.3 YEARS CONSIDERED
    1.5 CURRENCY CONSIDERED 
    1.6 UNIT CONSIDERED 
           TABLE 1 CURRENCY EXCHANGE RATES
    1.7 STAKEHOLDERS 
    1.8 SUMMARY OF CHANGES 
 
2 RESEARCH METHODOLOGY (Page No. - 34)
    2.1 RESEARCH DATA 
           FIGURE 1 RESEARCH DESIGN
           FIGURE 2 RESEARCH PROCESS FLOW
           2.1.1 SECONDARY DATA
                    2.1.1.1 Secondary sources
                    2.1.1.2 Key data from secondary sources
           2.1.2 PRIMARY DATA
                    TABLE 2 LIST OF PARTICIPATING COMPANIES FOR PRIMARY RESEARCH
                    2.1.2.1 Key industry insights
                               FIGURE 3 BREAKDOWN OF PRIMARY INTERVIEWS
           2.1.3 SAMPLING TECHNIQUES AND DATA COLLECTION METHODS
    2.2 MARKET SIZE ESTIMATION 
           2.2.1 BOTTOM-UP APPROACH
                    FIGURE 4 BOTTOM-UP APPROACH
           2.2.2 TOP-DOWN APPROACH
                    FIGURE 5 TOP-DOWN APPROACH
                    FIGURE 6 DEMAND-SIDE APPROACH
    2.3 DATA TRIANGULATION 
           FIGURE 7 DATA TRIANGULATION
    2.4 FACTOR ANALYSIS 
           2.4.1 FACTOR ANALYSIS FOR MARKET SIZING: DEMAND AND SUPPLY SIDES
    2.5 RESEARCH ASSUMPTIONS 
    2.6 RESEARCH LIMITATIONS 
    2.7 RECESSION IMPACT 
 
3 EXECUTIVE SUMMARY (Page No. - 47)
    FIGURE 8 AUTONOMOUS TRAIN MARKET OUTLOOK 
    FIGURE 9 MARKET, BY TECHNOLOGY, 2024 VS. 2030 (USD MILLION) 
    FIGURE 10 MARKET, BY TRAIN TYPE, 2024 VS. 2030 (UNITS) 
    FIGURE 11 MARKET, BY REGION, 2024 VS. 2030 (UNITS) 
 
4 PREMIUM INSIGHTS (Page No. - 51)
    4.1 ATTRACTIVE OPPORTUNITIES FOR PLAYERS IN AUTONOMOUS TRAIN MARKET 
           FIGURE 12 ADVANCED TECHNOLOGIES AND INCREASING GOVERNMENT INVESTMENTS TO DRIVE MARKET
    4.2 MARKET, BY REGION 
           FIGURE 13 ASIA PACIFIC TO ACCOUNT FOR LARGEST MARKET SHARE IN 2024
    4.3 MARKET, BY TECHNOLOGY 
           FIGURE 14 CBTC TO GAIN LARGEST MARKET SHARE DURING FORECAST PERIOD
    4.4 MARKET, BY APPLICATION 
           FIGURE 15 PASSENGER TRAIN TO BE LARGER APPLICATION SEGMENT DURING FORECAST PERIOD
    4.5 MARKET, BY TRAIN TYPE 
           FIGURE 16 METRO/MONORAIL SEGMENT TO LEAD MARKET DURING FORECAST PERIOD
    4.6 MARKET, BY GOA 
           FIGURE 17 GOA2 TO BE LARGEST SEGMENT DURING FORECAST PERIOD
 
5 MARKET OVERVIEW (Page No. - 55)
    5.1 INTRODUCTION 
           TABLE 3 IMPACT OF MARKET DYNAMICS
    5.2 MARKET DYNAMICS 
           FIGURE 18 DRIVERS, RESTRAINTS, OPPORTUNITIES, CHALLENGES
           5.2.1 DRIVERS
                    5.2.1.1 Increased safety operational benefits
                               TABLE 4 AUTONOMOUS TRAIN TECHNOLOGIES AND THEIR BENEFITS
                    5.2.1.2 Increased budget allocations along with upcoming rail projects
                               TABLE 5 INVESTMENT FOR AMTRAK PROJECT BY US GOVERNMENT, 2024
                               TABLE 6 MAJOR RAPID TRANSIT PROJECTS IN ASIA PACIFIC
                               TABLE 7 PLANNED LIGHT RAIL PROJECTS IN ASIA PACIFIC
                               TABLE 8 MAJOR LIGHT RAIL PROJECTS IN ASIA PACIFIC
                               TABLE 9 PROPOSED HIGH-SPEED RAIL/BULLET TRAIN PROJECTS IN EUROPE
                               TABLE 10 MAJOR RAPID TRANSIT PROJECTS IN EUROPE
                    5.2.1.3 Low energy consumption and operational costs of autonomous trains
                               FIGURE 19 COMPARISON OF ENERGY CONSUMPTION AND CO2 EMISSIONS PER PASSENGER KILOMETER
                    5.2.1.4 Growing need for safety and compliance in rail transit
                               FIGURE 20 GLOBAL HIGH-SPEED NETWORK, 2022
                    5.2.1.5 Growing demand for public transport
                               FIGURE 21 RAIL PASSENGER TRANSPORT FOR MAIN UNDERTAKING EU, 2015–2022
                               TABLE 11 DEMAND FOR HIGH-SPEED RAIL SEGMENTED BY DISTANCE IN SPAIN
           5.2.2 RESTRAINTS
                    5.2.2.1 Lack of technology infrastructure and interoperability in emerging economies
                    5.2.2.2 Slow growth rate and inadequate infrastructure spending in emerging economies
                               TABLE 12 KEY INDICATORS FOR INVESTMENTS IN RAIL INDUSTRY
                    5.2.2.3 High initial investment
           5.2.3 OPPORTUNITIES
                    5.2.3.1 Transforming mining logistics with autonomous trains
           5.2.4 CHALLENGES
                    5.2.4.1 Inability of DTO systems to carry out required protection functions during emergency situations and lack of human intervention
                    5.2.4.2 High capital cost of automation, threat of cyberattacks, and lack of comprehensive infrastructure
                               FIGURE 22 AUTONOMOUS RAIL INFRASTRUCTURE
                               TABLE 13 RAIL COMMUTER DATA BREACH INCIDENTS (2020–2023)
    5.3 PRICING ANALYSIS 
           TABLE 14 PRICING ANALYSIS FOR AUTONOMOUS TRAIN SYSTEM SOLUTIONS
    5.4 ECOSYSTEM ANALYSIS 
           FIGURE 23 ECOSYSTEM ANALYSIS
           TABLE 15 ROLE OF COMPANIES IN ECOSYSTEM
    5.5 VALUE CHAIN ANALYSIS 
           FIGURE 24 VALUE CHAIN ANALYSIS
    5.6 CASE STUDY ANALYSIS 
           5.6.1 CISCO HELPED DEFINE META-MODEL (FRAMEWORK)
           5.6.2 AUTOHAUL BY HITACHI RAIL AND RIO TINTO
           5.6.3 BGAN BY INMARSAT
           5.6.4 ALSTOM PARTNERED WITH SNC-LAVALIN FOR REM PROJECT IN CANADA
           5.6.5 BANE NOR (NORWAY) SELECTED THALES TO PROVIDE NEXT-GENERATION NATION-WIDE TRAFFIC MANAGEMENT SYSTEM
           5.6.6 INTELLIGENT SOFTWARE SYSTEM BY HUAWEI
    5.7 INVESTMENT AND FUNDING SCENARIO 
           FIGURE 25 INVESTMENT SCENARIO, 2020–2023
           TABLE 16 LIST OF FUNDING IN 2021–2023
    5.8 PATENT ANALYSIS 
           5.8.1 INTRODUCTION
                    FIGURE 26 PUBLICATION TRENDS, 2019–2023
           5.8.2 TOP PATENT APPLICANTS
                    FIGURE 27 TOP PATENT APPLICANTS FOR DRIVERLESS TRAINS, 2019–2023
                    TABLE 17 PATENTS RELATED TO AUTONOMOUS TRAIN MARKET
    5.9 TECHNOLOGY ANALYSIS 
           5.9.1 WILDLIFE DETECTION SYSTEM
           5.9.2 BIOMETRIC TOKEN SYSTEM
           5.9.3 CLOUD COMPUTING IN ROLLING STOCK
           5.9.4 INTERNET OF THINGS IN RAILWAYS
           5.9.5 EUROPE’S RAIL FLAGSHIP PROJECTS
                    5.9.5.1 Flagship Project 1: MOTIONAL
                    5.9.5.2 Flagship Project 2: R2DATO
                    5.9.5.3 Flagship Project 3: IAM4RAIL
                    5.9.5.4 Flagship Project 4: RAIL4EARTH
                    5.9.5.5 Flagship Project 5: TRANS4M-R
                    5.9.5.6 Flagship Project 6: FUTURE
    5.10 TRADE ANALYSIS 
           5.10.1 IMPORT DATA
                    TABLE 18 US: IMPORT, BY COUNTRY (%)
                    TABLE 19 MEXICO: IMPORT, BY COUNTRY (%)
                    TABLE 20 GERMANY: IMPORT, BY COUNTRY (%)
                    TABLE 21 FRANCE: IMPORT, BY COUNTRY (%)
                    TABLE 22 UK: IMPORT, BY COUNTRY (%)
           5.10.2 EXPORT DATA
                    TABLE 23 GERMANY: EXPORT, BY COUNTRY (%)
                    TABLE 24 US: EXPORT, BY COUNTRY (%)
                    TABLE 25 CHINA: EXPORT, BY COUNTRY (%)
                    TABLE 26 CZECH REPUBLIC: EXPORT, BY COUNTRY (%)
                    TABLE 27 AUSTRIA: EXPORT, BY COUNTRY (%)
    5.11 REGULATORY LANDSCAPE 
           5.11.1 EUROPEAN NETWORK AND INFORMATION SECURITY AGENCY (ENISA)
                    TABLE 28 EUROPEAN NETWORK AND INFORMATION SECURITY AGENCY STANDARDS
           5.11.2 GENERAL DATA PROTECTION REGULATION (GDPR)
           5.11.3 INTERNATIONAL UNION OF RAILWAYS (UIC)
           5.11.4 REGULATORY BODIES, GOVERNMENT AGENCIES, AND OTHER ORGANIZATIONS
                    TABLE 29 NORTH AMERICA: REGULATORY BODIES, GOVERNMENT AGENCIES, AND OTHER ORGANIZATIONS
                    TABLE 30 EUROPE: REGULATORY BODIES, GOVERNMENT AGENCIES, AND OTHER ORGANIZATIONS
                    TABLE 31 ASIA PACIFIC: REGULATORY BODIES, GOVERNMENT AGENCIES, AND OTHER ORGANIZATIONS
                    TABLE 32 REST OF THE WORLD: REGULATORY BODIES, GOVERNMENT AGENCIES, AND OTHER ORGANIZATIONS
    5.12 KEY CONFERENCES AND EVENTS 
                    TABLE 33 KEY CONFERENCES AND EVENTS, 2024–2025
    5.13 TRENDS AND DISRUPTIONS IMPACTING CUSTOMER BUSINESS 
                    FIGURE 28 NEW REVENUE SOURCES IN AUTONOMOUS TRAIN MARKET
    5.14 KEY STAKEHOLDERS AND BUYING CRITERIA 
           5.14.1 BUYING CRITERIA
                    FIGURE 29 KEY BUYING CRITERIA, BY APPLICATION
                    TABLE 34 KEY BUYING CRITERIA, BY APPLICATION
           5.14.2 KEY STAKEHOLDERS
                    5.14.2.1 Influence of stakeholders on buying process of autonomous trains
           5.14.3 KEY STAKEHOLDERS IN BUYING PROCESS
                    FIGURE 30 INFLUENCE OF STAKEHOLDERS ON BUYING PROCESS, BY APPLICATION
                    TABLE 35 INFLUENCE OF STAKEHOLDERS ON BUYING PROCESS, BY APPLICATION
                    TABLE 36 INSTRUMENTS FOR QUALITY CONTROL FOR AUTONOMOUS TRAIN PRODUCTS AND SERVICES
 
6 AUTONOMOUS TRAIN MARKET, BY GOA4 SYSTEM (Page No. - 100)
    6.1 INTRODUCTION 
    6.2 ASIA PACIFIC 
           TABLE 37 CHINA: GOA4 TRAIN SYSTEMS
           TABLE 38 INDIA: GOA4 TRAIN SYSTEMS
           TABLE 39 SOUTH KOREA: GOA4 TRAIN SYSTEMS
    6.3 EUROPE 
           TABLE 40 FRANCE: GOA4 TRAIN SYSTEMS
           TABLE 41 ITALY: GOA4 TRAIN SYSTEMS
    6.4 NORTH AMERICA 
           TABLE 42 CANADA: GOA4 TRAIN SYSTEMS
           TABLE 43 US: GOA4 TRAIN SYSTEMS
 
7 AUTONOMOUS TRAIN MARKET, BY GOA (Page No. - 105)
    7.1 INTRODUCTION 
           FIGURE 31 MARKET, BY GOA, 2024 VS. 2030 (UNITS)
           TABLE 44 MARKET, BY GOA, 2019–2023 (UNITS)
           TABLE 45 MARKET, BY GOA, 2024–2030 (UNITS)
    7.2 GOA1 
           7.2.1 HIGH ADOPTION OF METRO/MONORAIL TO DRIVE GROWTH
                    TABLE 46 GOA1: MARKET, BY TRAIN TYPE, 2019–2023 (UNITS)
                    TABLE 47 GOA1: MARKET, BY TRAIN TYPE, 2024–2030 (UNITS)
    7.3 GOA2 
           7.3.1 NEED FOR IMPROVED OPERATIONAL EFFICIENCY TO DRIVE GROWTH
                    TABLE 48 GOA2: MARKET, BY TRAIN TYPE, 2019–2023 (UNITS)
                    TABLE 49 GOA2: MARKET, BY TRAIN TYPE, 2024–2030 (UNITS)
    7.4 GOA3 
           7.4.1 ADVANCED SOLUTIONS BY KEY MARKET PLAYERS SUPPORTING GOA3 TO DRIVE GROWTH
                    TABLE 50 GOA3: MARKET, BY TRAIN TYPE, 2019–2023 (UNITS)
                    TABLE 51 GOA3: MARKET, BY TRAIN TYPE, 2024–2030 (UNITS)
    7.5 GOA4 
           7.5.1 REDUCTION IN REACTION DELAYS AND ELECTRICITY CONSUMPTION TO DRIVE GROWTH
                    TABLE 52 GOA4: MARKET, BY TRAIN TYPE, 2019–2023 (UNITS)
                    TABLE 53 GOA4: MARKET, BY TRAIN TYPE, 2024–2030 (UNITS)
    7.6 PRIMARY INSIGHTS 
 
8 AUTONOMOUS TRAIN MARKET, BY TRAIN TYPE (Page No. - 112)
    8.1 INTRODUCTION 
           FIGURE 32 MARKET, BY TRAIN TYPE, 2024 VS. 2030 (UNITS)
           TABLE 54 MARKET, BY TRAIN TYPE, 2019–2023 (UNITS)
           TABLE 55 MARKET, BY TRAIN TYPE, 2024–2030 (UNITS)
           TABLE 56 MARKET, BY TRAIN TYPE, 2019–2023 (USD MILLION)
           TABLE 57 MARKET, BY TRAIN TYPE, 2024–2030 (USD MILLION)
           8.1.1 OPERATIONAL DATA
                    TABLE 58 MAJOR RAPID TRANSIT PROJECTS IN ASIA PACIFIC
                    TABLE 59 PROPOSED LIGHT RAIL PROJECTS IN ASIA PACIFIC
    8.2 METRO/MONORAIL 
           8.2.1 HIGH-CAPACITY CARRIERS AND LESS TRAVEL DURATION TO DRIVE GROWTH
                    TABLE 60 METRO/MONORAIL: MARKET, BY GOA, 2019–2023 (UNITS)
                    TABLE 61 METRO/MONORAIL: MARKET, BY GOA, 2024–2030 (UNITS)
    8.3 LIGHT RAIL 
           8.3.1 LOW OPERATING COSTS TO DRIVE GROWTH
                    TABLE 62 LIGHT RAIL: MARKET, BY GOA, 2019–2023 (UNITS)
                    TABLE 63 LIGHT RAIL: MARKET, BY GOA, 2024–2030 (UNITS)
    8.4 HIGH-SPEED RAIL/BULLET TRAIN 
           8.4.1 UPCOMING HIGH-SPEED RAIL/BULLET TRAIN PROJECTS TO DRIVE GROWTH
                    TABLE 64 HIGH-SPEED RAIL/BULLET TRAIN: MARKET, BY GOA,  2019–2023 (UNITS)
                    TABLE 65 HIGH-SPEED RAIL/BULLET TRAIN: MARKET, BY GOA,  2024–2030 (UNITS)
    8.5 PRIMARY INSIGHTS 
 
9 AUTONOMOUS TRAIN MARKET, BY TECHNOLOGY (Page No. - 121)
    9.1 INTRODUCTION 
           FIGURE 33 CBTC SEGMENT TO LEAD MARKET FROM  2024 TO 2030 (USD MILLION)
           TABLE 66 MARKET, BY TECHNOLOGY, 2019–2023 (USD MILLION)
           TABLE 67 MARKET, BY TECHNOLOGY, 2024–2030 (USD MILLION)
           9.1.1 OPERATIONAL DATA
                    TABLE 68 AUTONOMOUS TRAIN OFFERINGS BASED ON TECHNOLOGY
    9.2 POSITIVE TRAIN CONTROL (PTC) 
           9.2.1 IMPROVING RAIL INFRASTRUCTURE TO DRIVE GROWTH
                    TABLE 69 POSITIVE TRAIN CONTROL: MARKET, BY REGION,  2019–2023 (USD MILLION)
                    TABLE 70 POSITIVE TRAIN CONTROL: MARKET, BY REGION,  2024–2030 (USD MILLION)
    9.3 COMMUNICATIONS-BASED TRAIN CONTROL (CBTC) 
           9.3.1 INCREASING ADOPTION OF MONORAILS AND METROS TO DRIVE GROWTH
                    TABLE 71 COMMUNICATIONS-BASED TRAIN CONTROL: MARKET, BY REGION, 2019–2023 (USD MILLION)
                    TABLE 72 COMMUNICATIONS-BASED TRAIN CONTROL: MARKET, BY REGION, 2024–2030 (USD MILLION)
    9.4 AUTOMATED TRAIN CONTROL (ATC) 
           9.4.1 ABILITY TO IMPROVE TRAFFIC FLOW AND ENERGY CONSUMPTION TO DRIVE GROWTH
                    TABLE 73 AUTOMATED TRAIN CONTROL: MARKET, BY REGION,  2019–2023 (USD MILLION)
                    TABLE 74 AUTOMATED TRAIN CONTROL: MARKET, BY REGION,  2024–2030 (USD MILLION)
    9.5 EUROPEAN RAILWAY TRAFFIC MANAGEMENT SYSTEM (ERTMS) 
           9.5.1 EUROPE AND NORTH AMERICA TO DRIVE GROWTH
                    TABLE 75 EUROPEAN RAILWAY TRAFFIC MANAGEMENT SYSTEM: MARKET,  BY REGION, 2019–2023 (USD MILLION)
                    TABLE 76 EUROPEAN RAILWAY TRAFFIC MANAGEMENT SYSTEM: MARKET,  BY REGION, 2024–2030 (USD MILLION)
    9.6 PRIMARY INSIGHTS 
 
10 AUTONOMOUS TRAIN MARKET, BY APPLICATION (Page No. - 130)
     10.1 INTRODUCTION 
             10.1.1 OPERATIONAL DATA
                       TABLE 77 AUTONOMOUS TRAIN OFFERINGS
     10.2 PASSENGER TRAIN 
             10.2.1 DEVELOPMENT OF RAIN INFRASTRUCTURE FOR HIGHER SAFETY AND EFFICIENCY TO DRIVE GROWTH
                       TABLE 78 PASSENGER TRAIN: MARKET, BY GOA,  2019–2023 (UNITS)
                       TABLE 79 PASSENGER TRAIN: MARKET, BY GOA,  2024–2030 (UNITS)
                       TABLE 80 METRO/MONORAIL (PASSENGER TRAIN): MARKET,  BY GOA, 2019-2023 (UNITS)
                       TABLE 81 METRO/MONORAIL (PASSENGER TRAIN): MARKET, BY GOA,  2024–2030 (UNITS)
                       TABLE 82 LIGHT RAIL (PASSENGER TRAIN): MARKET, BY GOA,  2019–2023 (UNITS)
                       TABLE 83 LIGHT RAIL (PASSENGER TRAIN): MARKET, BY GOA,  2024–2030 (UNITS)
                       TABLE 84 HIGH-SPEED RAIL/BULLET TRAIN (PASSENGER TRAIN): MARKET,  BY GOA, 2019–2023 (UNITS)
                       TABLE 85 HIGH-SPEED RAIL/BULLET TRAIN (PASSENGER TRAIN): MARKET,  BY GOA, 2024–2030 (UNITS)
     10.3 FREIGHT TRAIN 
             10.3.1 NEED FOR SAFE AND EFFICIENT TRANSPORT OF COMMODITIES TO DRIVE GROWTH
     10.4 PRIMARY INSIGHTS 
 
11 AUTONOMOUS TRAIN MARKET, BY COMPONENT (Page No. - 136)
     11.1 INTRODUCTION 
               TABLE 86 MARKET, BY COMPONENT, 2019–2023 (USD MILLION)
               TABLE 87 MARKET, BY COMPONENT, 2024–2030 (USD MILLION)
     11.2 TACHOMETER 
             11.2.1 ABILITY TO MAINTAIN SAFE SPEED BETWEEN TWO TRAINS AND PREVENT POSSIBILITY OF ACCIDENTS TO DRIVE GROWTH
                       TABLE 88 TACHOMETER: MARKET, BY REGION, 2019–2023 (USD MILLION)
                       TABLE 89 TACHOMETER: MARKET, BY REGION, 2024–2030 (USD MILLION)
     11.3 DOPPLER 
             11.3.1 REAL-TIME PROCESSING ENHANCING TRAIN SAFETY TO DRIVE GROWTH
                       TABLE 90 DOPPLER: MARKET, BY REGION, 2019–2023 (USD MILLION)
                       TABLE 91 DOPPLER: MARKET, BY REGION, 2024–2030 (USD MILLION)
     11.4 ACCELEROMETER 
             11.4.1 CONSTANT ACCELERATION MEASUREMENT TO DRIVE GROWTH
                       TABLE 92 ACCELEROMETER: MARKET, BY REGION,  2019–2023 (USD MILLION)
                       TABLE 93 ACCELEROMETER: MARKET, BY REGION,  2024–2030 (USD MILLION)
     11.5 CAMERA 
             11.5.1 ABILITY TO PROVIDE CLEAR FOOTAGE OF PANTOGRAPH TO DRIVE GROWTH
                       TABLE 94 CAMERA: MARKET, BY REGION, 2019–2023 (USD MILLION)
                       TABLE 95 CAMERA: MARKET, BY REGION, 2024–2030 (USD MILLION)
     11.6 ANTENNA 
             11.6.1 INTRODUCTION OF INTERNET CONNECTIVITY FOR PASSENGER WI-FI TO DRIVE GROWTH
                       TABLE 96 ANTENNA: MARKET, BY REGION, 2019–2023 (USD MILLION)
                       TABLE 97 ANTENNA: MARKET, BY REGION, 2024–2030 (USD MILLION)
     11.7 RADIO SET 
             11.7.1 NEED FOR SEAMLESS RADIO COMMUNICATIONS TO DRIVE GROWTH
                       TABLE 98 RADIO SET: MARKET, BY REGION, 2019–2023 (USD MILLION)
                       TABLE 99 RADIO SET: MARKET, BY REGION, 2024–2030 (USD MILLION)
     11.8 ODOMETER 
             11.8.1 CRITICAL ROLE IN CALCULATING SPEED AND ASCERTAINING POSITION OF TRAIN TO DRIVE GROWTH
                       TABLE 100 ODOMETER: MARKET, BY REGION, 2019–2023 (USD MILLION)
                       TABLE 101 ODOMETER: MARKET, BY REGION, 2024–2030 (USD MILLION)
     11.9 RADAR 
             11.9.1 ABILITY TO DETECT OBJECTS WITHIN DEFINED RANGE TO DRIVE GROWTH
                       TABLE 102 RADAR: MARKET, BY REGION, 2019–2023 (USD MILLION)
                       TABLE 103 RADAR: MARKET, BY REGION, 2024–2030 (USD MILLION)
     11.10 LIDAR 
               11.10.1 CAPABILITY OF CAPTURING MILLIONS OF PRECISE DISTANCE MEASUREMENT POINTS EVERY SECOND TO DRIVE GROWTH
                       TABLE 104 LIDAR: MARKET, BY REGION, 2019–2023 (USD MILLION)
                       TABLE 105 LIDAR: MARKET, BY REGION, 2024–2030 (USD MILLION)
     11.11 PRIMARY INSIGHTS 
 
12 AUTONOMOUS TRAIN MARKET, BY REGION (Page No. - 149)
     12.1 INTRODUCTION 
               FIGURE 34 ASIA PACIFIC TO BE FASTEST-GROWING MARKET DURING FORECAST PERIOD (UNITS)
               TABLE 106 MARKET, BY REGION, 2019–2023 (UNITS)
               TABLE 107 MARKET, BY REGION, 2024–2030 (UNITS)
     12.2 ASIA PACIFIC 
             12.2.1 RECESSION IMPACT
                       FIGURE 35 ASIA PACIFIC: MARKET SNAPSHOT
                       TABLE 108 ASIA PACIFIC: MARKET, BY TRAIN TYPE, 2019-2023 (UNITS)
                       TABLE 109 ASIA PACIFIC: MARKET, BY TRAIN TYPE, 2024–2030 (UNITS)
             12.2.2 CHINA
                       12.2.2.1 High government investments in railway infrastructure to drive growth
             12.2.3 INDIA
                       12.2.3.1 Government initiatives for smart cities to drive growth
             12.2.4 JAPAN
                       12.2.4.1 Presence of advanced rail infrastructure to drive growth
             12.2.5 SOUTH KOREA
                       12.2.5.1 Significant scope for development of rail infrastructure to drive growth
     12.3 EUROPE 
             12.3.1 RECESSION IMPACT
                       FIGURE 36 EUROPE: MARKET, BY TRAIN TYPE (UNITS)
                       TABLE 110 EUROPE: MARKET, BY TRAIN TYPE, 2019–2023 (UNITS)
                       TABLE 111 EUROPE: MARKET, BY TRAIN TYPE, 2024–2030 (UNITS)
             12.3.2 UK
                       12.3.2.1 Need to improve efficiency of existing railway infrastructure to drive growth
             12.3.3 GERMANY
                       12.3.3.1 Growing adoption of IoT and analytics to drive growth
             12.3.4 FRANCE
                       12.3.4.1 High investments by railway operators to drive growth
     12.4 NORTH AMERICA 
             12.4.1 RECESSION IMPACT
                       FIGURE 37 NORTH AMERICA: MARKET SNAPSHOT
                       TABLE 112 NORTH AMERICA: MARKET, BY TRAIN TYPE, 2019–2023 (UNITS)
                       TABLE 113 NORTH AMERICA: MARKET, BY TRAIN TYPE, 2024–2030 (UNITS)
             12.4.2 US
                       12.4.2.1 Heavy investment in rail infrastructure to drive growth
             12.4.3 CANADA
                       12.4.3.1 Increasing number of passengers and growing freight traffic to drive growth
             12.4.4 MEXICO
                       12.4.4.1 Growing need to automate public transportation processes to drive growth
     12.5 MIDDLE EAST & AFRICA 
             12.5.1 RECESSION IMPACT
                       FIGURE 38 MIDDLE EAST & AFRICA: MARKET SNAPSHOT
                       TABLE 114 MIDDLE EAST & AFRICA: MARKET, BY TRAIN TYPE,  2019–2023 (UNITS)
                       TABLE 115 MIDDLE EAST & AFRICA: MARKET, BY TRAIN TYPE,  2024–2030 (UNITS)
             12.5.2 UAE
                       12.5.2.1 Improving rail infrastructure to drive growth
             12.5.3 SOUTH AFRICA
                       12.5.3.1 Increasing demand for transportation services to match  trade requirements to drive growth
     12.6 REST OF THE WORLD (ROW) 
             12.6.1 RECESSION IMPACT
                       TABLE 116 ROW: MARKET, BY TRAIN TYPE, 2019–2023 (UNITS)
                       TABLE 117 ROW: MARKET, BY TRAIN TYPE, 2024–2030 (UNITS)
             12.6.2 BRAZIL
                       12.6.2.1 High scope for development of rai infrastructure to drive growth
             12.6.3 IRAN
                       12.6.3.1 Expansion of rail network to drive growth
 
13 COMPETITIVE LANDSCAPE (Page No. - 170)
     13.1 OVERVIEW 
     13.2 REVENUE ANALYSIS OF TOP LISTED/PUBLIC PLAYERS 
               FIGURE 39 TOP PUBLIC/LISTED PLAYERS DOMINATING AUTONOMOUS TRAIN MARKET, 2020 VS. 2022
     13.3 MARKET SHARE ANALYSIS 
               FIGURE 40 MARKET SHARE OF KEY PLAYERS, 2022
             13.3.1 ALSTOM SA
             13.3.2 SIEMENS
             13.3.3 THALES GROUP
             13.3.4 HITACHI LTD.
             13.3.5 WABTEC CORPORATION
     13.4 COMPANY VALUATION AND FINANCIAL METRICS 
               FIGURE 41 COMPANY VALUATION, 2023 (USD BILLION)
               FIGURE 42 COMPANY FINANCIAL METRICS, 2023
     13.5 COMPANY EVALUATION MATRIX 
             13.5.1 STARS
             13.5.2 EMERGING LEADERS
             13.5.3 PERVASIVE PLAYERS
             13.5.4 PARTICIPANTS
                       FIGURE 43 COMPANY EVALUATION MATRIX, 2023
             13.5.5 COMPANY FOOTPRINT
                       TABLE 118 COMPANY FOOTPRINT, 2023
                       TABLE 119 COMPANY PRODUCT FOOTPRINT, 2023
                       TABLE 120 COMPANY REGION FOOTPRINT, 2023
     13.6 STARTUP/SME EVALUATION MATRIX 
             13.6.1 PROGRESSIVE COMPANIES
             13.6.2 RESPONSIVE COMPANIES
             13.6.3 DYNAMIC COMPANIES
             13.6.4 STARTING BLOCKS
                       FIGURE 44 STARTUP/SME EVALUATION MATRIX, 2023
             13.6.5 COMPETITIVE BENCHMARKING
                       TABLE 121 LIST OF KEY STARTUPS/SMES
     13.7 COMPETITIVE SCENARIO 
             13.7.1 PRODUCT LAUNCHES
                       TABLE 122 AUTONOMOUS TRAIN MARKET: PRODUCT LAUNCHES, 2019–2023
             13.7.2 DEALS
                       TABLE 123 MARKET: DEALS, 2019–2023
                       TABLE 124 MARKET: EXPANSIONS, 2019–2023
                       TABLE 125 MARKET: OTHER DEVELOPMENTS, 2019–2023
 
14 COMPANY PROFILES (Page No. - 195)
(Business Overview, Products Offered, Recent Developments, MnM View Right to win, Strategic choices made, Weaknesses and competitive threats) *
     14.1 KEY PLAYERS 
             14.1.1 ALSTOM SA
                       TABLE 126 ALSTOM SA: COMPANY OVERVIEW
                       FIGURE 45 ALSTOM SA: COMPANY SNAPSHOT
                       FIGURE 46 ALSTOM SA: NEW BUSINESS OPPORTUNITIES
                       TABLE 127 ALSTOM SA: PRODUCTS/SOLUTIONS OFFERED
                       TABLE 128 ALSTOM SA: PRODUCT LAUNCHES/DEVELOPMENTS
                       TABLE 129 ALSTOM SA: DEALS
                       TABLE 130 ALSTOM SA: OTHER DEVELOPMENTS
             14.1.2 SIEMENS
                       TABLE 131 SIEMENS: COMPANY OVERVIEW
                       FIGURE 47 SIEMENS: COMPANY SNAPSHOT
                       TABLE 132 SIEMENS: PRODUCTS/SOLUTIONS OFFERED
                       TABLE 133 SIEMENS: PRODUCT LAUNCHES/DEVELOPMENTS
                       TABLE 134 SIEMENS: DEALS
                       TABLE 135 SIEMENS: OTHER DEVELOPMENTS
             14.1.3 HITACHI LTD.
                       TABLE 136 HITACHI LTD.: COMPANY OVERVIEW
                       FIGURE 48 HITACHI LTD.: COMPANY SNAPSHOT
                       TABLE 137 HITACHI LTD.: PRODUCTS/SOLUTIONS OFFERED
                       TABLE 138 HITACHI LTD.: PRODUCT LAUNCHES/DEVELOPMENTS
                       TABLE 139 HITACHI LTD.: DEALS
                       TABLE 140 HITACHI LTD.: OTHER DEVELOPMENTS
             14.1.4 WABTEC CORPORATION
                       TABLE 141 WABTEC CORPORATION: COMPANY OVERVIEW
                       FIGURE 49 WABTEC CORPORATION: COMPANY SNAPSHOT
                       FIGURE 50 WABTEC CORPORATION: FUTURE OUTLOOK
                       TABLE 142 WABTEC CORPORATION: PRODUCTS/SOLUTIONS OFFERED
                       TABLE 143 WABTEC CORPORATION: PRODUCT LAUNCHES/DEVELOPMENTS
                       TABLE 144 WABTEC CORPORATION: DEALS
                       TABLE 145 WABTEC CORPORATION: OTHER DEVELOPMENTS
                       TABLE 146 WABTEC CORPORATION: EXPANSIONS
             14.1.5 THALES GROUP
                       TABLE 147 THALES GROUP: COMPANY OVERVIEW
                       FIGURE 51 THALES GROUP: OVERVIEW
                       FIGURE 52 THALES GROUP: COMPANY SNAPSHOT
                       TABLE 148 THALES GROUP: PRODUCTS/SOLUTIONS OFFERED
                       TABLE 149 THALES GROUP: DEALS
                       TABLE 150 THALES GROUP: OTHER DEVELOPMENTS
                       TABLE 151 THALES GROUP: EXPANSIONS
             14.1.6 MITSUBISHI HEAVY INDUSTRIES
                       TABLE 152 MITSUBISHI HEAVY INDUSTRIES: COMPANY OVERVIEW
                       FIGURE 53 MITSUBISHI HEAVY INDUSTRIES: COMPANY SNAPSHOT
                       TABLE 153 MITSUBISHI HEAVY INDUSTRIES: PRODUCTS/SOLUTIONS OFFERED
                       TABLE 154 MITSUBISHI HEAVY INDUSTRIES: OTHER DEVELOPMENTS
             14.1.7 CRCC
                       TABLE 155 CRCC: COMPANY OVERVIEW
                       FIGURE 54 CRCC: COMPANY SNAPSHOT
                       TABLE 156 CRCC: PRODUCTS/SOLUTIONS OFFERED
                       TABLE 157 CRCC: PRODUCT LAUNCHES/DEVELOPMENTS
                       TABLE 158 CRCC: DEALS
                       TABLE 159 CRCC: OTHER DEVELOPMENTS
             14.1.8 ABB
                       TABLE 160 ABB: COMPANY OVERVIEW
                       FIGURE 55 ABB: COMPANY SNAPSHOT
                       TABLE 161 ABB: PRODUCTS/SOLUTIONS OFFERED
                       TABLE 162 ABB: DEALS
                       TABLE 163 ABB: EXPANSIONS
             14.1.9 CAF
                       TABLE 164 CAF: COMPANY OVERVIEW
                       FIGURE 56 CAF: COMPANY SNAPSHOT
                       TABLE 165 CAF: PRODUCTS/SOLUTIONS OFFERED
                       TABLE 166 CAF: OTHER DEVELOPMENTS
             14.1.10 NOKIA
                       TABLE 167 NOKIA: COMPANY OVERVIEW
                       FIGURE 57 NOKIA: COMPANY SNAPSHOT
                       TABLE 168 NOKIA: PRODUCTS/SOLUTIONS OFFERED
                       TABLE 169 NOKIA: PRODUCT LAUNCHES/DEVELOPMENTS
                       TABLE 170 NOKIA: DEALS
     14.2 OTHER KEY PLAYERS 
             14.2.1 BEIJING TRAFFIC CONTROL TECHNOLOGY
                       TABLE 171 BEIJING TRAFFIC CONTROL TECHNOLOGY: COMPANY OVERVIEW
             14.2.2 TECH MAHINDRA LTD.
                       TABLE 172 TECH MAHINDRA LTD.: COMPANY OVERVIEW
             14.2.3 HOLLYSYS
                       TABLE 173 HOLLYSYS: COMPANY OVERVIEW
             14.2.4 DEUTSCHE BAHN
                       TABLE 174 DEUTSCHE BAHN: COMPANY OVERVIEW
             14.2.5 DEUTA
                       TABLE 175 DEUTA: COMPANY OVERVIEW
             14.2.6 BELDEN
                       TABLE 176 BELDEN: COMPANY OVERVIEW
             14.2.7 AMERICAN EQUIPMENT COMPANY
                       TABLE 177 AMERICAN EQUIPMENT COMPANY: COMPANY OVERVIEW
             14.2.8 INGETEAM
                       TABLE 178 INGETEAM: COMPANY OVERVIEW
             14.2.9 TRANSMASHHOLDING
                       TABLE 179 TRANSMASHHOLDING: COMPANY OVERVIEW
             14.2.10 TVEMA
                       TABLE 180 TVEMA: COMPANY OVERVIEW
             14.2.11 KAWASAKI HEAVY INDUSTRIES
                       TABLE 181 KAWASAKI HEAVY INDUSTRIES: COMPANY OVERVIEW
             14.2.12 CALAMP
                       TABLE 182 CALAMP: COMPANY OVERVIEW
*Details on Business Overview, Products Offered, Recent Developments, MnM View, Right to win, Strategic choices made, Weaknesses and competitive threats might not be captured in case of unlisted companies.
 
15 APPENDIX (Page No. - 253)
     15.1 INSIGHTS FROM INDUSTRY EXPERTS 
     15.2 DISCUSSION GUIDE 
     15.3 KNOWLEDGESTORE: MARKETSANDMARKETS’  SUBSCRIPTION PORTAL 
     15.4 CUSTOMIZATION OPTIONS 
             15.4.1 AUTONOMOUS TRAIN MARKET, ADDITIONAL COMPONENTS
             15.4.2 PROFILES OF ADDITIONAL MARKET PLAYERS (UP TO 3)
     15.5 RELATED REPORTS 
     15.6 AUTHOR DETAILS 

The study involved four major activities in estimating the current market size of the autonomous train market. Exhaustive secondary research was done to collect information on the market, the peer market, and the parent market. The next step was to validate these findings, assumptions, and sizing with the industry experts across value chains through primary research. The top-down and bottom-up approaches were employed to estimate the complete market size. Thereafter, market breakdown and data triangulation processes were used to estimate the market size of segments and subsegments.

Secondary Research

In the secondary research process, various secondary sources such as company annual reports/presentations, press releases, industry association publications such as The European Rail Industry (UNIFE), International Union of Railways, Federal Railroad Administration, Association of American Railroads, International Association of Railway Operation Research etc., railway magazine articles, directories, technical handbooks, world economic outlook, trade websites, technical articles, and databases (Marklines, Factiva etc.) have been used to identify and collect for an extensive commercial study of the global autonomous train market.

Primary Research

Extensive primary research has been conducted after acquiring an understanding of this market scenario through secondary research. Several primary interviews have been conducted with market experts from the demand- and supply-side OEMs (in terms of component supply, country-level government associations, and trade associations) and component manufacturers across major regions, namely, Asia Pacific, Europe, North America, Middle East & Africa and Rest of the World. Approximately 30% and 70% of primary interviews have been conducted from the demand and supply side, respectively. Primary data has been collected through questionnaires, emails, LinkedIn, and telephonic interviews. In the canvassing of primaries, we have strived to cover various departments within organizations, such as sales, operations, and administration, to provide a holistic viewpoint in our report.

After interacting with industry experts, we conducted brief sessions with highly experienced independent consultants to reinforce the findings from our primaries. This, along with the in-house subject matter experts’ opinions, has led us to the findings as described in the remainder of this report. Following is the breakdown of primary respondents.

Autonomous Train  Market Size, and Share

To know about the assumptions considered for the study, download the pdf brochure

Market Size Estimation

Global autonomous train market by train type & component has been derived using bottom-up approach. To derive global market size, summation of each train type, component type is studied at a regional level. Production numbers are identified and validated through secondary research and multiple primary respondents.

Autonomous Train  Market Bottom Up Approach

To know about the assumptions considered for the study, Request for Free Sample Report

Autonomous Train  Market Top Down Approach

The top-down approach was used to estimate and validate the total market size. This method was also used extensively to estimate the size of various subsegments in the market. The research methodology used to estimate the market size includes the following:

  • Key players in the autonomous train market were identified through secondary research, and their market shares were determined through primary and secondary research
  • The research methodology included the study of the annual and quarterly financial reports & regulatory filings of major market players, as well as interviews with industry experts for detailed market insights
  • All major penetration rates, percentage shares, splits, and breakdowns for the autonomous train market were determined using secondary sources and verified through primary sources
  • All key macro indicators affecting the revenue growth of the market segments and subsegments were accounted for, viewed in extensive detail, verified through primary research, and analyzed to get the validated and verified quantitative & qualitative data
  • The gathered market data was consolidated and added with detailed inputs, analyzed, and presented in this report

Data Triangulation

After arriving at the overall market size—using the market size estimation processes as explained above—the market was split into several segments and subsegments. To complete the overall market engineering process and arrive at the exact statistics of each market segment and subsegment, data triangulation and market breakdown procedures were employed, wherever applicable. The data was triangulated by studying various factors and trends from both the demand and supply sides.

Market Definition

The autonomous train market is the market for trains that have the ability to operate without human intervention. This includes trains that can automatically start, stop, and navigate tracks, as well as detect and avoid obstacles. The market is a relatively new market, but it is expected to grow rapidly in the coming years, driven by factors such as increasing urbanization, rising labor costs, and the need for improved safety and efficiency in the rail industry.

List of Key Stakeholders

  • Government Authorities related to Railway Infrastructure Services
  • Independent Software Vendors
  • Independent Technology/Solution Providers
  • National Railway Governing Authorities/Regulators/Bodies
  • Rail Infrastructure Hardware and Device Suppliers
  • Rail Manufacturers/OEMs
  • Rail Transportation Technology Solution Providers
  • Railway Associations
  • Railway Management Companies (private/public)
  • Railway Operations Management Service Providers
  • Railway Operations Management Solution Vendors
  • Railway Operators Signaling Vendors
  • Transportation Research Authorities, NGOs, Governments, Investment Banks, Venture Capitalists, and Private Equity Firms
  • Legal and Regulatory Authorities
  • Manufacturers of Rail Components
  • Rail Leasing Authorities
  • Rail Service Providers
  • Railway Contractors
  • Railway Industry Associations
  • Railways Organizations/Associations
  • Raw Material Suppliers for Autonomous Trains
  • Traders, Distributors, and Suppliers of Autonomous Trains

Report Objectives

  • To analyze and forecast the size of the autonomous train market, in terms of volume (units/thousand units), from 2024 to 2030
  • To analyze and forecast the size of the market, in terms of volume (units), based on the grade of automation (grade of automation 1, grade of automation 2, grade of automation 3, and grade of automation 4) from 2024 to 2030
  • To analyze and forecast the size of the market, in terms of value
    (USD billion/million), based on technology (Automatic Train Control (ATC), Communication-based Train Control (CBTC), Positive Train Control (PTC), and European Railway Traffic Management System (ERTMS) from 2024 to 2030
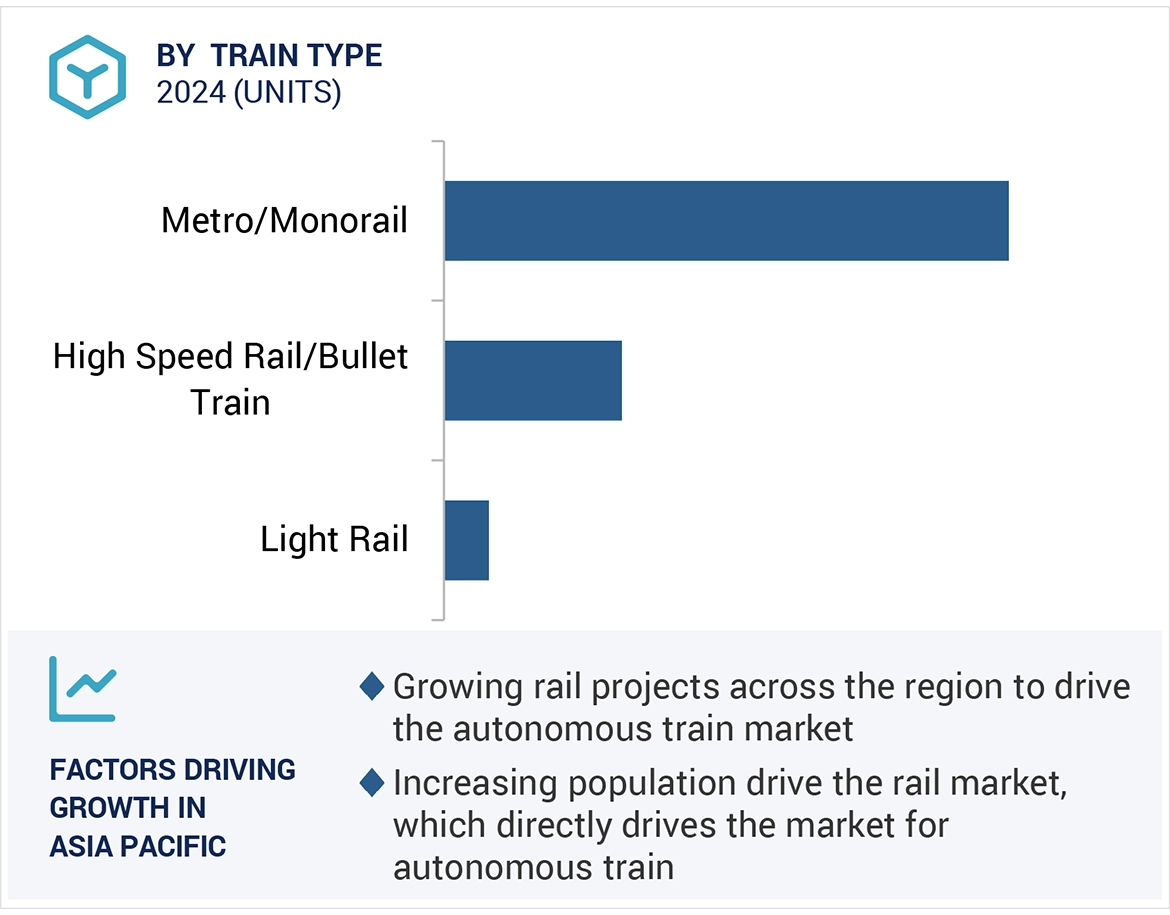
  • To analyze and forecast the size of the market, in terms of volume (units) and USD billion, based on train type (metro/monorail, light rail, and high-speed rail/bullet train) from 2024 to 2030
  • To analyze and forecast the size of the market, in terms of volume (units), based on component (tachometer, doppler, accelerometer, sensor, camera, antenna, odometer, radar, lidar) from 2024 to 2030
  • To analyze and forecast the size of the market, in terms of volume (units), based on application (passenger and freight) from 2024 to 2030
  • To qualitatively analyze market, in terms of GoA 4 systems for different regions.
  • To identify the market dynamics, including drivers, restraints, opportunities, and challenges, and analyze their impact on the market.
  • To define, describe, and project the size of the market, in terms of volume (units), based on region (Asia Pacific, Europe, North America, the Middle East & Africa, and Rest of the World (RoW)) from 2024 to 2030
  • To analyze the competitive leadership map for the key players operating in the market based on their business strategies from 2019-2023.
  • To track and analyze competitive developments such as, new product developments, deals and other industry-related activities carried out by the key players to strengthen their position in the autonomous train market.
  • To analyze the opportunities offered by various segments of the market to its stakeholders
  • To analyze and forecast the trends and orientation for autonomous train in the global rail industry
  • To track and analyze competitive developments such as new product development, deals, and other industry activities carried out by key industry participants
  • To analyze opportunities for stakeholders and the competitive landscape for market leaders
  • To strategically profile key players and comprehensively analyze their respective market share and core competencies
  • To provide detailed information regarding the major factors influencing the market growth (drivers, challenges, restraints, and opportunities)
  • To strategically analyze the market with respect to individual growth trends, prospects, and contributions to the total market

Available Customizations

MarketsandMarkets offers the following customizations for this market:

  • Autonomous train market, additional components
  • Profiling of additional market players (Up to 3)
Custom Market Research Services

We will customize the research for you, in case the report listed above does not meet with your exact requirements. Our custom research will comprehensively cover the business information you require to help you arrive at strategic and profitable business decisions.

Request Customization

Instant Answers with GPT - Ask Now!

Ask real questions. Get complete answers !
Report Code
AT 6300
Published ON
Feb, 2024
Choose License Type
BUY NOW
  • SHARE
X
Request Customization
Speak to Analyst
Speak to Analyst
OR FACE-TO-FACE MEETING
PERSONALIZE THIS RESEARCH
  • Triangulate with your Own Data
  • Get Data as per your Format and Definition
  • Gain a Deeper Dive on a Specific Application, Geography, Customer or Competitor
  • Any level of Personalization
REQUEST A FREE CUSTOMIZATION
LET US HELP YOU!
  • What are the Known and Unknown Adjacencies Impacting the Autonomous Train Market
  • What will your New Revenue Sources be?
  • Who will be your Top Customer; what will make them switch?
  • Defend your Market Share or Win Competitors
  • Get a Scorecard for Target Partners
CUSTOMIZED WORKSHOP REQUEST
+1-888-600-6441
  • Call Us
  • +1-888-600-6441 (Corporate office hours)
  • +1-888-600-6441 (US/Can toll free)
  • +44-800-368-9399 (UK office hours)
CONNECT WITH US
ABOUT TRUST ONLINE
©2024 MarketsandMarkets Research Private Ltd. All rights reserved
DMCA.com Protection Status Website Feedback