Benzene Market & Its Derivatives (Ethylbenzene, Cumene, Cyclohexane, Nitrobenzene, and Alkylbenzene) Market by Application & Geography � Trends and Forecasts to 2018


[218 Pages Report] Benzene is an organic compound with molecular formula C6H6, which is among the most consumed petrochemicals used in the industry. It is an important feedstock to manufacture various chemicals that further serve diverse industries including building and construction, textile, electrical and electronics, and automotive. Main applications of the products in benzene market include the manufacturing of ethylbenzene, cyclohexane, cumene, nitrobenzene, and alkylbenzene. It is also utilized for manufacturing maleic anhydride and as a solvent.
The benzene market has grown considerably during the past few years and is expected to grow at a considerable pace in the next five years, mainly driven by the growing demand in the Asia-Pacific region. The Asia-Pacific is the biggest consumer of benzene, followed by Europe and North America, which consumed more than 45.0% of the total demand in 2012. China is the biggest consumer in the global industry, and is also among the fastest growing markets with an estimated CAGR of about 4.8% from 2013 to 2018. The European and North American markets are comparatively mature with a demand growth well below the average market growth. ROW is the fastest growing geographic region that is mainly due to rising investments in Saudi Arabia downstream sector.
This study basically aims to estimate the benzene market & its derivatives for 2013, to project the expected demand of the same by 2018. This market research study provides a detailed qualitative and quantitative analysis of the market. It provides a comprehensive review of major market drivers, restraints, opportunities, winning imperatives, challenges, and key issues in the market. The market is further segmented and projected for regions segmented as the Asia-Pacific, North America, Europe and ROW, which is further segmented for key countries in each region. We have used various secondary sources such as encyclopedia, directories, and databases to identify and collect information useful for this extensive commercial study of the global industry and all of its components. The primary sources�experts from related industries and suppliers have been interviewed to obtain and verify critical information as well as to assess the future prospects of benzene and its derivatives.
Competitive scenarios of top players in the benzene market & its derivatives have been discussed in detail. We have also profiled leading players of this industry with their recent developments and other strategic industry activities. These include: China Petroleum & Chemical Corporation (Sinopec, China), Exxon Mobil Corporation (U.S.), Royal Dutch Shell Plc. (The Netherlands), The Dow Chemical Company (U.S.), JX Holdings Inc. (Japan), China National Petroleum Corporation (China), Total S.A. (France), Saudi Basic Industries Corporation (Saudi Arabia), BP Plc (U.K), and BASF SE (Germany).
Scope of the report:
This research report categorizes the benzene market on the basis of applications and geography along with forecast of volumes, revenue and analyzing trends in each of the submarkets. It also contains the market for various derivatives of these products at a country level.
On the basis of applications: The market is segmented on the basis of industry applications such as ethylbenzene, cumene, cyclohexane, nitrobenzene, and alkylbenzene. Each application is further described in detail in the report with volume and revenue forecasts for each application.
On the basis of geography: A country level segmentation is done for both benzene market and its derivatives for regions segmented as the Asia-Pacific, North America, Europe, & ROW. Further for key countries in each region that include the U.S., Canada, Mexico, China, Japan, Taiwan, South Korea, India, Malaysia, Singapore, Thailand, Germany, France, The Netherlands, Italy, Spain, Russia, Belgium, U.K, Poland, Czech Republic, Brazil, Argentina, Saudi Arabia, Kuwait, and Iran.
The global Benzene market is expected to reach 53,432.9 kilotons by 2018, signifying a firm annualized growth rate of over 3.8%.
The Benzene market, along with its various derivatives, has witnessed a significant growth in the recent years and this growth is estimated to persist in the coming years.
Benzene is a key building block to manufacture various chemicals such as ethylbenzene, cyclohexane, cumene, nitrobenzene, and alkylbenzene that are further used by a wide range of end-user industries such as building and construction, textile, transportation, and electrical and electronics.
Currently, the Asia-Pacific is the largest consumer of benzene and all of its downstream derivatives, which consumed more than 45.0% of the total consumption in 2012. Among all the countries, China dominates the benzene market, which consumed the maximum volume of benzene in 2012. The market volume consumption is these products comparatively low in the ROW region, but is expected show the highest CAGR from 2013 to 2018, followed by the Asia-Pacific.
The overall demand is driven by the producers of ethylbenzene, cyclohexane, and cumene consuming almost 82.0% of the total demand in 2012. Cumene manufacturing segment is expected to be the strongest growth segment which is primarily driven by growing demand for phenol and acetone. The budding construction and automotive industry is pushing the demand for styrenic polymers, which, is driving the demand for ethylbenzene at a notable pace.
Among all the derivatives, ethylbenzene led the market with the highest consumption of about 21.9 million tons in 2012. After, ethylbenzene, were cumene and cyclohexane producers with the consumption volume of about 7.8 million tons and 5.4 million tons respectively in 2012.
The major manufacturers of benzene include China Petroleum & Chemical Corporation (Sinopec, China), Exxon Mobil Corporation (U.S.), Royal Dutch Shell Plc. (The Netherlands), The Dow Chemical Company (U.S.), JX Holdings Inc. (Japan), China National Petroleum Corporation (China), Total S.A. (France), Saudi Basic Industries Corporation (Saudi Arabia), BP Plc (U.K), and BASF SE (Germany).
Benzene: Market Segmentation
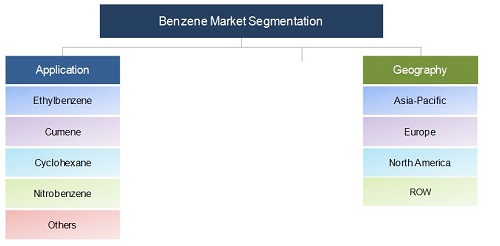
Source: Secondary Research, Expert Interviews, and MarketsandMarkets Analysis
This report covers the benzene market by various regions and major countries in each region. It also provides a detailed segmentation of the market on the basis of major applications, along with its projection till 2018. The country level demand estimations and forecast of major derivatives of benzene are also provided in the report.
 Exclusive indicates content/data unique to MarketsandMarkets and not available with any competitors.
Table Of Contents
1 Introduction (Page No. - 18)
1.1 Key Deliverables
1.2 Report Description
1.3 Stakeholders
1.4 Research Methodology
1.4.1 Market Size
1.4.2 Major Secondary Sources Used
1.4.3 Key Data Taken From Secondary Sources
1.4.4 Key Data Taken From Primary Sources
1.4.5 Assumptions
2 Executive Summary (Page No. - 24)
3 Premium Insights (Page No. - 26)
3.1 Market Segments
3.2 Market Dynamics
3.3 Market
3.4 Benzene Derivatives Market
4 Benzene Market Overview (Page No. - 33)
4.1 Introduction
4.2 Value Chain Analysis
4.3 Market Dynamics
4.3.1 Drivers
4.3.1.1 Growing Demand In The Asia-Pacific
4.3.1.2 Growth By End User Applications
4.3.1.2.1 Budding Demand For Styrenic Polymers
4.3.1.2.2 Increasing Phenol Consumption
4.3.1.2.3 Increasing Demand Of Methylene Diphenyl Diisocyanate
4.3.2 Restraints
4.3.2.1 Maturity Of The Product
4.3.3 Opportunities
4.3.3.1 Rising Investments In Saudi Arabia Downstream Sector
4.4 Winning Imperative
4.4.1 Integration
4.5 Regulations
4.6 Porters Five Forces Analysis
4.6.1 Threat Of New Entrants
4.6.2 Threat Of Substitutes
4.6.3 Buyers� Power
4.6.4 Suppliers� Power
4.6.5 Degree Of Competition
4.7 Market Share Analysis
5 Benzene Market (Page No. - 51)
5.1 Benzene Market, By Derivative
5.1.1 Introduction
5.1.2 Ethylbenze ne
5.1.3 Cumene
5.1.4 Cyclohexane
5.1.5 Nitrobenzene
5.1.6 Alkylbenzene
5.1.7 Others
5.2 Benzene Market, By Geography
5.2.1 Introduction
5.2.2 North America
5.2.2.1 Overview
5.2.2.2 U.S.
5.2.2.3 Canada
5.2.2.4 Mexico
5.2.3 Asia-Pacific
5.2.3.1 Overview
5.2.3.2 China
5.2.3.3 Japan
5.2.3.4 South Korea
5.2.3.5 Taiwan
5.2.3.6 Singapore
5.2.3.7 Thailand
5.2.3.8 Malaysia
5.2.3.9 India
5.2.4 Europe
5.2.4.1 Overview
5.2.4.2 Germany
5.2.4.3 France
5.2.4.4 The Netherlands
5.2.4.5 Russia
5.2.4.6 Belgium
5.2.4.7 Italy
5.2.4.8 Spain
5.2.4.9 Poland
5.2.4.10 U.K.
5.2.4.11 Czech Republic
5.2.5 ROW
5.2.5.1 Overview
5.2.5.2 Saudi Arabia
5.2.5.3 Brazil
5.2.5.4 Argentina
5.2.5.5 Kuwait
5.2.5.6 Iran
6 Benzene Derivatives Market (Page No. - 121)
6.1 Introduction
6.2 Ethylbenzene
6.2.1 Overview
6.2.2 Ethylbenzene Application Market
6.2.2.1 Styrene
6.2.2.2 Others
6.2.3 Ethylbenzene Regional Analysis
6.2.3.1 North America: Country Analysis
6.2.3.2 Europe: Country Analysis
6.2.3.3 Asia-Pacific: Country Analysis
6.2.3.4 ROW: Country Analysis
6.3 Cumene
6.3.1 Overview
6.3.2 Cumene Application Market
6.3.2.1 Phenol/Acetone
6.3.2.2 Others
6.3.3 Cumene Regional Analysis
6.3.3.1 North America: Country Analysis
6.3.3.2 Europe: Country Analysis
6.3.3.3 Asia-Pacific: Country Analysis
6.3.3.4 ROW: Country Analysis
6.4 Cyclohexane
6.4.1 Overview
6.4.2 Cyclohexane Regional Analysis
6.4.2.1 North America: Country Analysis
6.4.2.2 Europe: Country Analysis
6.4.2.3 Asia-Pacific: Country Analysis
6.4.2.4 ROW: Country Analysis
6.5 Nitrobenzene
6.5.1 Overview
6.5.2 Nitrobenzene Application Market
6.5.2.1 Aniline
6.5.2.2 Others
6.5.3 Nitrobenzene Regional Analysis
6.5.3.1 North America: Country Analysis
6.5.3.2 Europe: Country Analysis
6.5.3.3 Asia-Pacific: Country Analysis
6.5.3.4 ROW: Country Analysis
6.6 Alkylbenzene
6.6.1 Overview
6.6.2 Alkylbenzene Application Market
6.6.2.1 Linear Alkylbenzene Sulfate (Las)
6.6.2.2 Others
6.6.3 Alkylbenzene Regional Analysis
6.6.3.1 North America: Country Analysis
6.6.3.2 Europe: Country Analysis
6.6.3.3 Asia-Pacific: Country Analysis
6.6.3.4 ROW: Country Analysis
7 Competitive Landscape (Page No. - 181)
7.1 Introduction
7.2 Expansion: The Most Popular Growth Strategy
7.3 Maximum Developments In 2013
7.4 Asia-Pacific: Region With Maximum Developments
7.5 Sinopec, Cnpc, Total S.A.: Leading Market Participants
8 Company Profiles (Overview, Financial*, Products & Services, Strategy, And Developments) (Page No. - 188)
8.1 Sinopec
8.2 Exxon Mobil Corporation
8.3 Royal Dutch Shell Plc
8.4 The Dow Chemical Company
8.5 Jx Holdings Inc.
8.6 China National Petroleum Corporation
8.7 Total S.A.
8.8 Saudi Basic Industries Corporation
8.9 Bp Plc
8.10 Basf Se
*Details Might Not Be Captured In Case Of Unlisted Companies.
List Of Tables (118 Tables)
Table 1 Benzene Market Size, By Geography, 2011�2018 (Kt)
Table 2 Benzene: Market Size, By Geography,2011�2018 ($Million)
Table 3 Asia-Pacific: Value Chain, Upcoming Capacities
Table 4 Styrenic Polymers: Market Size, By Polymer Type, 2011-2018 (Kt)
Table 5 Phenol: Market Size, By Application, 2011-2018 (Kt)
Table 6 MDI: Market Size (Kt), ($Million), 2011-2018
Table 7 Saudi Arabia: Upcoming Plant Capacities Of Benzene Value Chain
Table 8 Benzene: Market Size In Ethylbenzene Application, 2011�2018
Table 9 Benzene: Market Size In Cumene Application, 2011�2018
Table 10 Benzene: Market Size In Cyclohexane Application, 2011�2018
Table 11 Benzene: Market Size In Nitrobenzene Application, 2011�2018
Table 12 Benzene: Market Size In Alkylbenzene Application, 2011�2018
Table 13 Benzene: Market Size In Others Application, 2011�2018
Table 14 U.S.: Market Size, By Application, 2011-2018 (Kt)
Table 15 U.S.: Market Size, By Application, 2011-2018 ($Million)
Table 16 Canada: Benzene: Market Size, By Application, 2011-2018 (Kt)
Table 17 Canada: Market Size, By Application, 2011-2018 ($Million)
Table 18 Mexico: Market Size, By Application, 2011-2018 (Kt)
Table 19 Mexico: Market Size, By Application, 2011-2018 ($Million)
Table 20 China: Market Size, By Application, 2011-2018 (Kt)
Table 21 China: Market Size, By Application, 2011-2018 ($Million)
Table 22 Japan: Market Size, By Application, 2011-2018 (Kt)
Table 23 Japan: Market Size, By Application, 2011-2018 ($Million)
Table 24 South Korea: Benzene: Market Size, By Application, 2011-2018 (Kt)
Table 25 South Korea: Benzene: Market Size, By Application, 2011-2018 ($Million)
Table 26 Taiwan: Market Size, By Application, 2011-2018 (Kt)
Table 27 Taiwan: Market Size, By Application, 2011-2018 ($Million)
Table 28 Singapore: Market Size, By Application, 2011-2018 (Kt)
Table 29 Singapore: Market Size, By Application, 2011-2018 ($Million)
Table 30 Thailand: Market Size, By Application, 2011-2018 (Kt)
Table 31 Thailand: Market Size, By Application, 2011-2018 ($Million)
Table 32 Malaysia: Market Size, By Application, 2011-2018 (Kt)
Table 33 Malaysia: Market Size, By Application, 2011-2018 ($Million)
Table 34 India: Benzene: Market Size, By Application, 2011-2018 (Kt)
Table 35 India: Market Size, By Application, 2011-2018 ($Million)
Table 36 Germany: Market Size, By Application, 2011-2018 (Kt)
Table 37 Germany: Market Size, By Application, 2011-2018 ($Million)
Table 38 France: Market Size, By Application, 2011-2018 (Kt)
Table 39 France: Market Size, By Application, 2011-2018 ($Million)
Table 40 The Netherlands: Market Size, By Application, 2011-2018 (Kt)
Table 41 The Netherlands: Market Size, By Application, 2011-2018 ($Million)
Table 42 Russia: Market Size, By Application, 2011-2018 (Kt)
Table 43 Russia: Market Size, By Application, 2011-2018 ($Million)
Table 44 Belgium: Market Size, By Application, 2011-2018 (Kt)
Table 45 Belgium: Market Size, By Application, 2011-2018 ($Million)
Table 46 Italy: Market Size, By Application, 2011-2018 (Kt)
Table 47 Italy: Market Size, By Application, 2011-2018 ($Million)
Table 48 Spain: Market Size, By Application, 2011-2018 (Kt)
Table 49 Spain: Market Size, By Application, 2011-2018 ($Million)
Table 50 Poland: Market Size, By Application, 2011-2018 (Kt)
Table 51 Poland: Market Size, By Application, 2011-2018 ($Million)
Table 52 U.K.: Benzene: Market Size, By Application, 2011-2018 (Kt)
Table 53 U.K.: Market Size, By Application, 2011-2018 ($Million)
Table 54 Czech Republic: Market Size, By Application, 2011-2018 (Kt)
Table 55 Czech Republic: Market Size, By Application, 2011-2018 ($Million)
Table 56 Saudi Arabia: Market Size, By Application, 2011-2018 (Kt)
Table 57 Saudi Arabia: Market Size, By Application, 2011-2018 ($Million)
Table 58 Brazil: Market Size, By Application, 2011-2018 (Kt)
Table 59 Brazil: Market Size, By Application, 2011-2018 ($Million)
Table 60 Argentina: Market Size, By Application, 2011-2018 (Kt)
Table 61 Argentina: Market Size, By Application, 2011-2018 ($Million)
Table 62 Kuwait: Market Size, By Application, 2011-2018 (Kt)
Table 63 Kuwait: Market Size, By Application, 2011-2018 ($Million)
Table 64 Iran: Market Size, By Application, 2011-2018 (Kt)
Table 65 Iran: Market Size, By Application, 2011-2018 ($Million)
Table 66 Ethylbenzene: Market Size, 2011-2018
Table 67 Ethylbenzene: Market Size, By Application, 2011-2018 (Kt)
Table 68 Ethylbenzene: Market Size, By Application, 2011-2018 ($Million)
Table 69 North America: Ethylbenzene Market Size, By Country, 2011�2018 (Kt)
Table 70 North America: Market Size, By Country, 2011�2018 ($Million)
Table 71 Europe: Ethylbenzene Market Size, By Country, 2011�2018 (Kt)
Table 72 Europe: Market Size, By Country, 2011�2018 ($Million)
Table 73 Asia-Pacific: Ethylbenzene Market Size, By Country, 2011�2018 (Kt)
Table 74 Asia-Pacific: Market Size, By Country, 2011�2018 ($Million)
Table 75 ROW: Ethylbenzene Market Size, By Country, 2011�2018 (Kt)
Table 76 ROW: Market Size, By Country, 2011�2018 ($Million)
Table 77 Cumene: Market Size, 2011-2018
Table 78 Cumene Market Size, By Application, 2011-2018 (Kt)
Table 79 Cumene: Market Size, By Application, 2011-2018 ($Million)
Table 80 North America: Cumene Market Size, By Country, 2011�2018 (Kt)
Table 81 North America: Cumene Market Size, By Country, 2011�2018 ($Million)
Table 82 Europe: Cumene Market Size, By Country, 2011�2018 (Kt)
Table 83 Europe: Cumene Market Size, By Country, 2011�2018 ($Million)
Table 84 Asia-Pacific: Cumene Market Size, By Country, 2011�2018 (Kt)
Table 85 Asia-Pacific: Cumene Market Size, By Country, 2011�2018 ($Million)
Table 86 ROW: Cumene Market Size, By Country, 2011�2018 (Kt)
Table 87 ROW: Cumene Market Size, By Country, 2011�2018 ($Million)
Table 88 Cyclohexane: Market Size, 2011-2018
Table 89 North America: Cyclohexane Market Size, By Country, 2011�2018 (Kt)
Table 90 North America: Cyclohexane Market Size, By Country, 2011�2018 ($Million)
Table 91 Europe: Cyclohexane Market Size, By Country, 2011�2018 (Kt)
Table 92 Europe: Cyclohexane Market Size, By Country, 2011�2018 ($Million)
Table 93 Asia-Pacific: Cyclohexane Market Size, By Country, 2011�2018 (Kt)
Table 94 Asia-Pacific: Cyclohexane Market Size, By Country, 2011�2018 ($Million)
Table 95 ROW: Cyclohexane Market Size, By Country, 2011�2018 (Kt)
Table 96 ROW: Cyclohexane Market Size, By Country, 2011�2018 ($Million)
Table 97 Nitrobenzene: Market Size, 2011-2018
Table 98 Nitrobenzene: Market Size, By Application, 2011-2018 (Kt)
Table 99 Nitrobenzene: Market Size, By Application, 2011-2018 ($Million)
Table 100 North America: Nitrobenzene Market Size, By Country, 2011�2018 (Kt)
Table 101 North America: Market Size, By Country, 2011�2018 ($Million)
Table 102 Europe: Nitrobenzene Market Size, By Country, 2011�2018 (Kt)
Table 103 Europe: Market Size, By Country, 2011�2018 ($Million)
Table 104 Asia-Pacific: Nitrobenzene Market Size, By Country, 2011�2018 (Kt)
Table 105 Asia-Pacific: Market Size, By Country, 2011�2018 ($Million)
Table 106 ROW: Nitrobenzene Market Size, By Country, 2011�2018 (Kt)
Table 107 ROW: Market Size, By Country, 2011�2018 ($Million)
Table 108 Alkylbenzene: Market Size, 2011-2018
Table 109 Alkylbenzene: Market Size, By Application, 2011-2018 (Kt)
Table 110 Alkylbenzene: Market Size, By Application, 2011-2018 ($Million)
Table 111 North America: Alkylbenzene Market Size, By Country, 2011�2018 (Kt)
Table 112 North America: Market Size, By Country, 2011�2018 ($Million)
Table 113 Europe: Alkylbenzene Market Size, By Country, 2011�2018 (Kt)
Table 114 Europe: Market Size, By Country, 2011�2018 ($Million)
Table 115 Asia-Pacific: Alkylbenzene Market Size, By Country, 2011�2018 (Kt)
Table 116 Asia-Pacific: Market Size, By Country, 2011�2018 ($Million)
Table 117 ROW: Alkylbenzene Market Size, By Country, 2011�2018 (Kt)
Table 118 ROW: Market Size, By Country, 2011�2018 ($Million)
List Of Figures (33 Figures)
Figure 1 Benzene Market Segments
Figure 2 Benzene Market Dynamics
Figure 3 Porter�s Five Forces Analysis
Figure 4 Regional Market Life Cycle
Figure 5 Benzene Market Share (Volume), 2012 & Demand, By Geography, 2011�2018
Figure 6 Benzene & Derivatives Market Demand & Share, By Geography, 2012
Figure 7 Benzene & Derivatives Market Demand, 2013 Vs 2018
Figure 8 Overview Of Benzene Value Chain
Figure 9 Impact Of Major Drivers On Benzene Market, 2013-2018
Figure 10 Ethylbenzene Value Chain
Figure 11 Cumene Value Chain
Figure 12 Nitrobenzene Value Chain
Figure 13 Impact Of Major Restraints On Benzene Market, 2013-2018
Figure 14 Impact Of Major Opportunities On Benzene Market, 2013-2018
Figure 15 Complete Integration
Figure 16 Porter�s Five Forces Analysis
Figure 17 Benzene Market Share (Volume), By Company, 2012
Figure 18 Benzene: Market Share (Volume), By Derivative, 2012
Figure 19 Benzene: Market Share (Volume), By Geography, 2012
Figure 20 North America: Benzene Market Share (Volume), By Country, 2012
Figure 21 Asia-Pacific: Benzene: Market Share (Volume), By Country, 2012
Figure 22 Europe: Benzene Market Share (Volume), By Country, 2012
Figure 23 ROW: Benzene: Market Share (Volume), By Country, 2012
Figure 24 Benzene Derivatives: Market Size, By Type, 2012
Figure 25 Ethylbenzene: Market Share (Volume), By Geography, 2012
Figure 26 Cumene: Market Share (Volume), By Geography, 2012
Figure 27 Cyclohexane: Market Share (Volume), By Geography, 2012
Figure 28 Nitrobenzene: Market Share (Volume), By Geography, 2012
Figure 29 Alkylbenzene: Market Share (Volume), By Geography, 2012
Figure 30 Benzene: Market Strategy Distribution, By Growth Strategy, 2010�2013
Figure 31 Benzene: Market Developments, 2010�2013
Figure 32 Benzene Market Growth Strategies, By Geography, 2010�2013
Figure 33 Benzene Market Developments, By Company, 2010�2013


Growth opportunities and latent adjacency in Benzene Market