Biofortification Market by Crop (Sweet Potato, Cassava, Rice, Corn, Wheat, Beans, and Pearl Millet), Target Nutrient (Zinc, Iron, and Vitamins), and Region (Latin America, Africa, and Asia Pacific) - Global Forecast to 2023
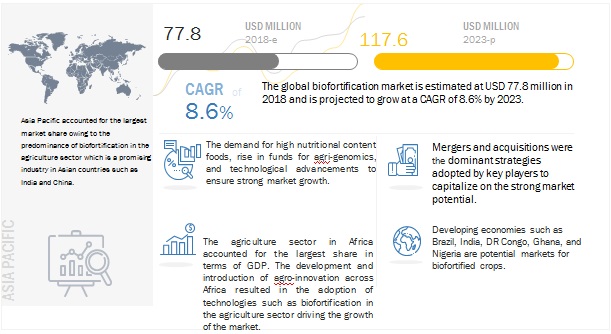
[101 Pages Report] The global biofortification market was valued at USD 71.7 million in 2017 and is projected to reach USD 117.6 million by 2023, at a CAGR of 8.6% from 2018. The growth of the biofortification market is driven by the rising demand for high nutritional content in food. The key drivers for the market include demand for high nutritional content foods, increase in funds for agrigenomics, and technological advancements in the agricultural sector in various countries.

To know about the assumptions considered for the study, Request for Free Sample Report
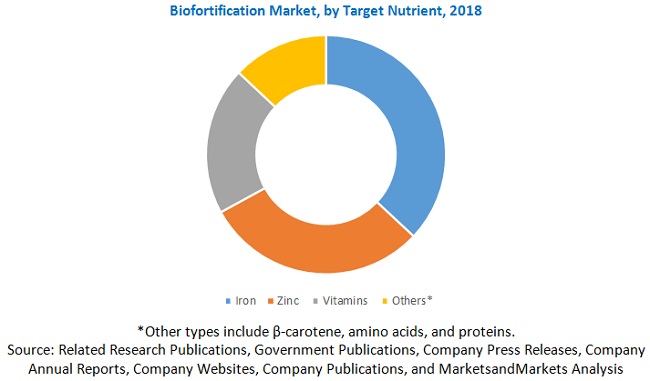
By target nutrient, the biofortification market has been segmented into iron, zinc, vitamins, and others, such as â-carotene, amino acids, and proteins. The iron segment is estimated to account for the largest share in 2018. Iron is a micronutrient, which is required by plants in lesser amounts than primary or secondary micronutrients. It is a constituent of several enzymes and some pigments, and assists in nitrate and sulfate reduction and energy production within the plant.

To know about the assumptions considered for the study, download the pdf brochure
By crop type, the sweet potatoes segment accounted for the largest market in the market in 2018. The demand for biofortified crops such as sweet potato and cassava has increased with the rising technological advancements to increase the nutrient content, particularly in orange-fleshed sweet potato (OFSP). Sweet potato is recognized as an important source of energy in the human diet for centuries owing to its high carbohydrate content. However, its vitamin A content from carotene only became recognized over the past century.
Regionally, Asia Pacific is the dominant region in the biofortification market. Biofortification has strong growth potential in agriculture, and it also improves the nutrition content in food. Countries such as India and China are agrarian in nature and have consequently improved the opportunities for use and potential for biofortification.
Scope of the report
|
Report Metric |
Details |
|
Market size available for years |
2016-2023 |
|
Base year considered |
2017 |
|
Forecast period |
2018 – 2023 |
|
Forecast units |
Value (USD Million) |
|
Segments covered |
Crop, Target Nutrient, and Region |
|
Geographies covered |
Latin America, Asia Pacific, Africa |
|
Companies covered |
Syngenta, Bayer, BASF, DowDuPont, Charles River, Lemnatec, Intertek, and Agro Biosciences |
This research report categorizes the biofortification market based on crop, target nutrient, and region. It provides information on the market size for the various segments and sub-segments within the market between 2018 and 2023.
Crop Type
- Sweet Potato
- Cassava
- Rice
- Corn
- Wheat
- Bean
- Pearl Millet
- Others (Tomato, Banana, Sorghum, and Barley)
Target Nutrient
- Zinc
- Iron
- Vitamins
- Others (B-Carotene, Amino Acids, and Protein)
Region
- Latin America
- Brazil
- Guatemala
- Africa
- Nigeria
- DR Congo
- Ghana
- Malawi
- Rest of Africa (Tanzania, Uganda, and Zambia)
- Asia Pacific
- Bangladesh
- China
- India
- Rest of Asia Pacific (Myanmar, Cambodia, and the Philippines)
Frequently Asked Questions (FAQ):
What is the market size of biofortification, and what is the market potential in the coming years?
The market for biofortification is estimated at USD 78 million in 2018, and it is projected to grow at a CAGR of 8.6% from 2018 to reach USD 118 million by 2023.
What are some of the key crops for which biofortification is widely accepted?
Biofortification is most widely used for crops such as sweet potato, cassava, rice, corn, wheat, beans, pearl millet, and other crops such as tomato, banana, sorghum, and barley. The growth of the biofortification market is driven by the rising demand for high nutritional content in food.
Who are the key players operating in the biofortification market?
The key players in the market include Syngenta, Bayer, BASF, DowDuPont, Charles River, Lemnatec, Intertek, and Agro Biosciences.
What are some of the potentially high-growth markets for biofortification?
Brazil, India, DR Congo, Ghana, and Nigeria are potential markets for biofortified crops.
What are some of the factors that could hinder the growth of the market?
Restrictions on the production of genetically-modified crops in the European countries could serve as a hindering factor for the growth of the market. .
To speak to our analyst for a discussion on the above findings, click Speak to Analyst

Table of Contents
1 Introduction (Page No. - 13)
1.1 Objectives of the Study
1.2 Market Definition
1.3 Study Scope
1.3.1 Markets Covered
1.3.2 Geographic Segmentation
1.4 Periodization Considered
1.5 Currency Considered
1.6 Stakeholders
2 Research Methodology (Page No. - 17)
2.1 Research Data
2.1.1 Secondary Data
2.1.2 Primary Data
2.1.2.1 Breakdown of Primary Interviews
2.2 Market Size Estimation
2.3 Data Triangulation
2.4 Research Assumptions
2.5 Research Limitations
3 Executive Summary (Page No. - 25)
4 Premium Insights (Page No. - 29)
4.1 Attractive Opportunities in the Biofortification Market
4.2 Biofortification Market Size, By Region
4.3 Market, By Crop
4.4 Market, By Target Nutrient, 2018 vs 2023
5 Market Overview (Page No. - 32)
5.1 Introduction
5.2 Market Dynamics
5.2.1 Drivers
5.2.1.1 Demand for High Nutritional Content Foods
5.2.1.2 Rise in Funds for Agrigenomics
5.2.1.3 Technological Advancements Ensure Strong Market Growth
5.2.2 Restraints
5.2.2.1 Lower Awareness About the Benefits of Biofortified Crops
5.2.3 Opportunities
5.2.3.1 Unregulated Environment for Biofortification
5.2.3.2 Strong Market Potential in Developing Countries
5.2.4 Challenges
5.2.4.1 Restriction on the Production of Genetically Modified Crops
5.3 Supply Chain Analysis
5.4 Crop Development Framework
5.5 Patent Analysis
6 Biofortification Market: Regulatory Framework (Page No. - 39)
6.1 Introduction
6.1.1 Harvestplus
6.1.2 International Bodies for Biofortification Standards and Regulations
6.1.3 Food and Agriculture Organization of the United Nations (FAO) and the World Health Organization (WHO)
7 Biofortification Market, By Target Nutrient (Page No. - 41)
7.1 Introduction
7.2 Zinc
7.2.1 Zinc is the Most Widely Added Agricultural Micronutrient Globally, Owing to Its High Nutritional Properties
7.3 Iron
7.3.1 Iron Segment Held the Largest Market Share, Due to Their High Demand
7.4 Vitamins
7.4.1 Through the Process of Biofortification, the Density of Vitamins and Minerals is Increased in A Crop Through Plant Breeding
7.5 Others (Â-Carotene, Amino Acids, and Proteins)
8 Biofortification Market, By Crop (Page No. - 47)
8.1 Introduction
8.2 Sweet Potato
8.2.1 The Demand for Sweet Potato has Increased With the Rising Technological Advancements to Increase the Nutrient Content
8.3 Cassava
8.3.1 Cassava is One of the Starchy Staple Foods Consumed in Africa, Asia and Latin America
8.4 Rice
8.4.1 According to the FAO, in Many Asian Countries, Rice Provides Up to 80% of the Energy Intake of the Poor Population
8.5 Corn
8.5.1 According to the US Department of Agriculture, in 2015 About 92% of the Corn Produced in the US Was Genetically Modified
8.6 Wheat
8.6.1 for Improving the Yield and Quality of the Crops, Biofortification Technology Required
8.7 Beans
8.7.1 Beans is the Most Important Food in the Daily Food Hence the Biofortificatuion is Required for Improving Its Nutritional Contain
8.8 Pearl Millet
8.8.1 Pearl Millet is A Part of the Daily Diet for More Than 50 Million People in the Semi-Arid Regions of India and Africa
8.9 Others (Tomato, Banana, Sorghum, and Barley)
9 Biofortification Market, By Region (Page No. - 56)
9.1 Introduction
9.2 Latin America
9.2.1 Brazil
9.2.2 Guatemala
9.3 Africa
9.3.1 Nigeria
9.3.2 Dr Congo
9.3.3 Ghana
9.3.4 Malawi
9.3.5 Rest of Africa
9.4 Asia Pacific
9.4.1 Bangladesh
9.4.2 China
9.4.3 India
9.4.4 Rest of Asia Pacific
10 Competitive Landscape (Page No. - 68)
10.1 Overview
10.2 Competitive Scenario
10.3 Market Ranking Analysis
10.4 Expansions
10.5 Mergers & Acquisitions
10.6 Collaborations & Investments
10.7 Agreements
11 Company Profiles (Page No. - 75)
(Business Overview, Products Offered, Recent Developments, SWOT Analysis, MnM View)*
11.1 Syngenta
11.2 Bayer
11.3 BASF
11.4 Dowdupont
11.5 Monsanto
11.6 Charles River
11.7 Lemnatec
11.8 Intertek
11.9 Agro Biosciences Inc.
*Details on Business Overview, Products Offered, Recent Developments, SWOT Analysis, MnM View Might Not Be Captured in Case of Unlisted Companies.
12 Appendix (Page No. - 95)
12.1 Discussion Guide
12.2 Knowledge Store: Marketsandmarkets’ Subscription Portal
12.3 Available Customizations
12.4 Related Reports
12.5 Author Details
List of Tables(31 Tables)
Table 1 US Dollar Exchange Rate Considered for the Study, 2014–2017
Table 2 Most Preferred Crops for Select Target Nutrients
Table 3 Biofortification Market Size, By Target Nutrient, 2016–2023 (USD Million)
Table 4 Zinc Biofortification Market Size, By Region, 2016–2023 (USD Million)
Table 5 Iron Biofortification Market Size, By Region, 2016–2023 (USD Million)
Table 6 Vitamins Biofortification Market Size, By Region, 2016–2023 (USD Million)
Table 7 Other Target Nutrients: Biofortification Market Size, By Region, 2016–2023 (USD Million)
Table 8 Schedule of Product Release of Biofortified Crops, 2007–2013
Table 9 Biofortification Market Size, By Crop, 2016–2023 (USD Million)
Table 10 Sweet Potato: Biofortification Market Size, By Region, 2016–2023 (USD Million)
Table 11 Cassava: Biofortification Market Size, By Region, 2016–2023 (USD Million)
Table 12 Rice: Biofortification Market Size, By Region, 2016–2023 (USD Million)
Table 13 Corn: Biofortification Market Size, By Region, 2016–2023 (USD Million)
Table 14 Wheat: Biofortification Market Size, By Region, 2016–2023 (USD Million)
Table 15 Beans: Biofortification Market Size, By Region, 2016–2023 (USD Million)
Table 16 Pearl Millet: Biofortification Market Size, By Region, 2016–2023 (USD Million)
Table 17 Others: Biofortification Market Size, By Region, 2016–2023 (USD Million)
Table 18 Biofortification Market Size, By Region, 2016–2023 (USD Million)
Table 19 Latin America: Biofortification Market Size, By Country, 2016–2023 (USD Million)
Table 20 Latin America: Market Size, By Target Nutrient, 2016–2023 (USD Million)
Table 21 Latin America: Market Size, By Crop, 2016–2023 (USD Million)
Table 22 Africa: Market Size, By Country, 2016–2023 (USD Million)
Table 23 Africa: Market Size, By Target Nutrient, 2016–2023 (USD Million)
Table 24 Africa: Market Size, By Crop, 2016–2023 (USD Million)
Table 25 Asia Pacific: Market Size, By Country, 2016–2023 (USD Million)
Table 26 Asia Pacific: Market Size, By Target Nutrient, 2016–2023 (USD Million)
Table 27 Asia Pacific: Market Size, By Crop, 2016–2023 (USD Million)
Table 28 Expansions, 2013 –2018
Table 29 Mergers & Acquisitions, 2014 –2018
Table 30 Collaborations & Investments, 2013–2016
Table 31 Agreements, 2013
List of Figures(32 Figures)
Figure 1 Biofortification Market Snapshot
Figure 2 Biofortification Market, By Region
Figure 3 Market: Research Design
Figure 4 Breakdown of Primary Interviews: By Company Type, Designation, and Region
Figure 5 Market Size Estimation Methodology: Bottom-Up Approach
Figure 6 Market Size Estimation Methodology: Top-Down Approach
Figure 7 Data Triangulation Methodology
Figure 8 Iron Segment to Dominate the Biofortification Market, By Target Nutrient, 2018 vs 2023 (USD Million)
Figure 9 Sweet Potato Segment to Dominate the Biofortification Market, By Crop, 2018 vs 2023 (USD Million)
Figure 10 Asia Pacific to Be Dominant in the Biofortification Market, 2018–2023
Figure 11 Advancements in Biofortification Processes to Fuel the Market Demand
Figure 12 Market Size, 2018 vs 2023 (USD Million)
Figure 13 Sweet Potato to Account for the Highest Market Size Throughout the Forecast Period
Figure 14 Vitamins to Grow at the Highest Rate Between 2018 and 2023
Figure 15 Market: Drivers, Restraints, Opportunities, and Challenges
Figure 16 Market Size, By Target Nutrient, 2018 vs 2023 (USD Million)
Figure 17 Sweet Potato is Expected to Dominate the Biofortification Market From 2018 to 2023 (USD Million)
Figure 18 Asia Pacific: Market Snapshot
Figure 19 Key Developments of the Leading Players in the Biofortification Market, 2013–November 2018
Figure 20 Annual Developments in the Biofortification Market, January 2013-November 2018
Figure 21 Market Ranking of Players in Biofortification Market
Figure 22 Syngenta: Company Snapshot
Figure 23 Syngenta: SWOT Analysis
Figure 24 Bayer: Company Snapshot
Figure 25 Bayer: SWOT Analysis
Figure 26 BASF: Company Snapshot
Figure 27 BASF: SWOT Analysis
Figure 28 Dowdupont: Company Snapshot
Figure 29 Dowdupont: SWOT Analysis
Figure 30 Monsanto: Company Snapshot
Figure 31 Charles River: Company Snapshot
Figure 32 Intertek: Company Snapshot
The study involves four major activities to estimate the current size for biofortification market. Exhaustive secondary research was done to collect information on the market, peer market, and parent market. These findings, assumptions, and market size were validated with industry experts across the value chain through primary research. Both top-down and bottom-up approaches were employed to estimate the complete market size. Thereafter, the market breakdown and data triangulation were used to estimate the market size of segments and subsegments.
Secondary Research
In the secondary research process, various secondary sources such as Hoovers, Bloomberg BusinessWeek, and Dun & Bradstreet were referred to, in order to identify and collect information for this study. These secondary sources included annual reports, press releases & investor presentations of companies, white papers, certified publications, articles by recognized authors, gold & silver standard websites, food safety organizations, regulatory bodies, trade directories, and databases.
Primary Research
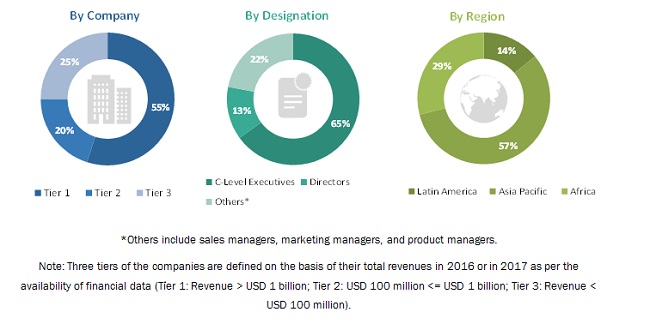
The biofortification market comprises several stakeholders such as technology providers and lab instrument & equipment manufacturers, biotechnological companies, genetic solution providers, plant & livestock breeders, public and private research institutions, agencies, and laboratories and commercial seed manufacturers (including both GM and non-GM seed manufacturers). The demand side of this market is characterized by the rising demand for high nutritional content in food. The supply side is characterized by advancements in technology and diverse application industries. Various primary sources from both the supply and demand sides of the market were interviewed to obtain qualitative and quantitative information. Following is the breakdown of primary respondents:

To know about the assumptions considered for the study, download the pdf brochure
Market Size Estimation
Both top-down and bottom-up approaches were used to estimate and validate the total size of the market. These methods were also used extensively to estimate the size of various subsegments in the market. The research methodology used to estimate the market size includes the following:
The key players in the industry and markets have been identified through extensive secondary research.
- The industry’s supply chain and market size, in terms of value, were determined through primary and secondary research processes.
- All percentage shares, splits, and breakdowns were determined using secondary sources and verified through primary sources.
Data Triangulation
After arriving at the overall market size—using the market size estimation processes as explained above—the market was split into several segments and subsegments. In order to complete the overall market engineering process and arrive at the exact statistics of each market segment and subsegment, the data triangulation and market breakdown procedures were employed. The data was triangulated by studying various factors and trends from both the demand and supply sides, in the food & beverage industry.
Report Objectives
- To define, segment, and project the global market size for biofortification
- To understand the structure of the biofortification market by identifying its various subsegments
- To provide detailed information about the key factors influencing the growth of the market (drivers, restraints, opportunities, and industry-specific challenges)
- To analyze the micromarkets with respect to individual growth trends, future prospects, and their contribution to the total market
- To project the size of the market and its submarkets, in terms of value, with respect to the regions (along with their respective key countries)
- To profile key players and comprehensively analyze their core competencies
- To understand the competitive landscape and identify major growth strategies adopted by players across key regions
- To analyze the competitive developments such as expansions & investments, new product launches, mergers & acquisitions, joint ventures, and agreements
Available Customizations
Based on the given market data, MarketsandMarkets offers customizations in the reports as per the client’s specific requirements. The available customization options are as follows:
Product Analysis
- Product matrix, which gives a detailed comparison of the product portfolio of each company
Regional Analysis
- Further breakdown of the Rest of Asia Pacific products market into Myanmar, Cambodia, and the Philippines
- Further breakdown of the African products market into DR Congo, Nigeria, Ghana, Malawi, and Rest of Africa
Company Information
- Detailed analysis and profiling of additional market players (up to five)


Growth opportunities and latent adjacency in Biofortification Market