Molecular Breeding Market by Process (QTL Mapping, Marker-Assisted Selection, Marker-Assisted Backcrossing, and Genomic Selection), Marker (SNP, SSR), Application (Crop Breeding and Livestock Breeding), and Region-Global Forecast to 2023


[155 Pages Report] The molecular breeding market is estimated at USD 1.79 billion in 2018 and is projected to reach USD 3.95 billion by 2023, at a CAGR of 17.11% during the forecast period. The agricultural benefits associated with these adjuvant solutions are the major factors contributing to the growth of this market, globally. The growth of economies in developing countries, coupled with the increasing R&D expenses in the agriculture industry drives the growth potential of these markets.
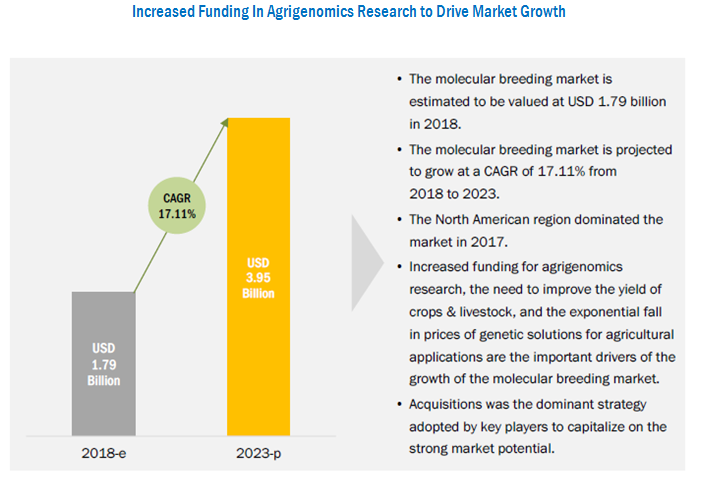
Molecular breeding technologies are in the nascent stage of growth in the plant and livestock breeding industry, where major seed manufacturing companies have been adopting this technology for improved seeds. Strong funds by the private and public sectors towards agrigenomic research such as the application of MAS, and genomic selection in field and vegetable crops is projected to drive the growth of the market over the next five years. Also, the decline of prices observed in the genetic services industry in agriculture has encouraged key players to invest in the market.
Marker-assisted selection was estimated to dominate the molecular breeding market in 2018. The US was the major country with higher adoption of MAS in 2018. The Netherlands and the UK witnessed 100% adoption of molecular breeding techniques for new development of crop varieties. The adoption of genomic selection is projected to grow at the highest rate, owing to the increasing awareness about its efficacy in increasing yield, majorly for vegetables in developed countries.
Multiple breakthrough innovations led to the development of better and efficient DNA or genetic markers such as SNPs and SSRs. Companies such as Eurofins and Thermo Fisher have been offering selective breeding services such as MAS and genomic selection based on SNPs and SSRs, while some companies such as Illumina Inc. LGC Limited, LemnaTec, and Charles River are dependent solely on SNPs as molecular markers.
North America accounted for the largest share in the molecular breeding market in 2017, followed by Europe, owing to the high adoption of advanced genetic tools to increase agricultural yield in countries such as Germany, France, the US, and Canada. Rising cultivation of industrial & high-value crops and growing awareness among farmers about the benefits of molecular breeding are expected to provide more scope for market expansion. The major factors restraining the growth of this market are the high start-up cost associated with the application of molecular genetic markers and automated equipment. Also, the dearth of skilled professionals and lack of infrastructural facilities in developing countries hinder the growth potential of this market.
The global market for molecular breeding is dominated by key players such as Eurofins (Luxembourg), Illumina (US), LGC Limited (UK), Thermo Fisher Scientific (US), and SGS (Switzerland). Some emerging players in the molecular breeding market include DanBred (Denmark), Intertek Group (UK), LemnaTec (Germany), Charles River (US), Slipstream Automation (New Zealand), and Fruitbreedomics (consortium).
To speak to our analyst for a discussion on the above findings, click Speak to Analyst
 Exclusive indicates content/data unique to MarketsandMarkets and not available with any competitors.
Table of Contents
1 Introduction (Page No. - 15)
1.1 Objectives of the Study
1.2 Market Definition
1.3 Study Scope
1.4 Periodization Considered
1.5 Currency Considered
1.6 Stakeholders
2 Research Methodology (Page No. - 19)
2.1 Research Data
2.1.1 Secondary Data
2.1.2 Primary Data
2.1.2.1 Key Industry Insights
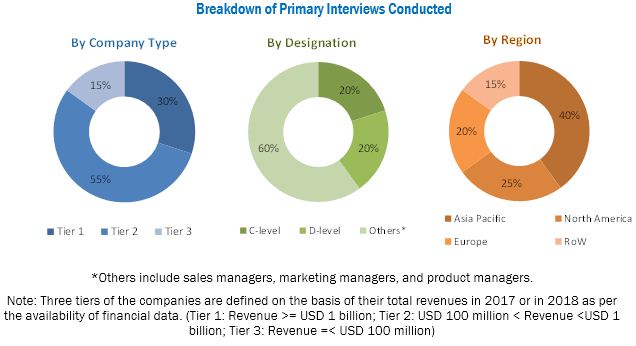
2.1.2.2 Breakdown of Primary Interviews
2.2 Market Size Estimation
2.3 Data Triangulation
2.4 Research Assumptions
2.5 Limitations
3 Executive Summary (Page No. - 27)
4 Premium Insights (Page No. - 32)
4.1 Opportunities in the Molecular Breeding Market
4.2 Molecular Breeding Market, By Application, 2017
4.3 North America: Molecular Breeding Market, By Marker & Country, 2017
4.4 Molecular Breeding Market, By Process & Region, 2017
4.5 Molecular Breeding Market Share, By Key Country
5 Market Overview (Page No. - 37)
5.1 Introduction
5.2 Evolution
5.3 Macroeconomic Indicators
5.3.1 Growth in the Usage of Commercial Seeds
5.3.2 Increasing Trade of Animal Genetic Resources
5.4 Market Dynamics
5.4.1 Drivers
5.4.1.1 Rise in Funds for Agrigenomics
5.4.1.2 Exponential Fall in the Cost for Genomic Solutions
5.4.1.3 Technological Advancements Ensure Strong Market Growth
5.4.1.4 Growing Number of Partnerships, Collaborations, and Acquisitions
5.4.2 Restraints
5.4.2.1 High Cost of Molecular Breeding in Comparison to Conventional Breeding Techniques
5.4.2.2 Infrastructural Restraints
5.4.2.2.1 Lack of Laboratory Infrastructure
5.4.2.2.2 Availability of Few Validated Markers
5.4.2.2.3 Dearth of Skilled Professionals
5.4.2.3 Lesser Awareness and Misconception About Molecular Breeding Programs
5.4.3 Opportunities
5.4.3.1 Emerging Markets
5.4.3.2 Unregulated Environment for Molecular Breeding
5.4.3.3 Opportunities in Livestock Breeding
5.4.4 Challenges
5.4.4.1 Developing Economies Restrict the Adoption of Molecular Breeding
5.5 Patent Analysis
5.6 Supply Chain Analysis
6 Molecular Breeding Market, By Process (Page No. - 54)
6.1 Introduction
6.2 Marker-Assisted Selection (MAS)
6.3 QTL Mapping
6.4 Marker-Assisted Backcrossing (MABC)
6.5 Genomic Selection
6.6 Other Processes
7 Molecular Breeding Market, By Marker (Page No. - 61)
7.1 Introduction
7.2 Single Nucleotide Polymorphism (SNP)
7.3 Simple Sequence Repeats (SSR)
7.4 Other Markers
8 Molecular Breeding Market, By Application (Page No. - 67)
8.1 Introduction
8.2 Crop Breeding
8.2.1 Cereals & Grains
8.2.1.1 Corn
8.2.1.2 Wheat
8.2.1.3 Rice
8.2.1.4 Other Cereals & Grains
8.2.2 Oilseeds
8.2.2.1 Soybean
8.2.2.2 Other Oilseeds
8.2.3 Vegetables
8.2.4 Other Crop Types
8.3 Livestock
8.3.1 Cattle
8.3.2 Poultry
8.3.3 Other Livestock
9 Molecular Breeding Market, By Region (Page No. - 82)
9.1 Introduction
9.2 North America
9.2.1 US
9.2.2 Canada
9.2.3 Mexico
9.3 Europe
9.3.1 Germany
9.3.2 France
9.3.3 Netherlands
9.3.4 UK
9.3.5 Rest of Europe
9.4 Asia Pacific
9.4.1 Australia
9.4.2 China
9.4.3 India
9.4.4 Japan
9.4.5 Rest of Asia Pacific
9.5 Rest of the World (RoW)
9.5.1 Brazil
9.5.2 South Africa
9.5.3 Israel
9.5.4 Others in RoW
10 Competitive Landscape (Page No. - 119)
10.1 Overview
10.2 Company Share Analysis and Rankings
10.3 Competitive Scenario
10.3.1 Mergers & Acquisitions
10.3.2 Expansions & Investments
10.3.3 Agreements, Partnerships, and Joint Ventures
11 Company Profiles (Page No. - 126)
(Business Overview, Products Offered, Recent Developments, SWOT Analysis, MnM View)*
11.1 Eurofins
11.2 Thermo Fisher Scientific
11.3 Illumina Inc.
11.4 SGS
11.5 LGC Group
11.6 Danbred
11.7 Intertek
11.8 Lemnatec
11.9 Charles River
11.10 Slipstream Automation
11.11 Fruitbreedomics
*Details on Business Overview, Products Offered, Recent Developments, SWOT Analysis, MnM View Might Not Be Captured in Case of Unlisted Companies.
12 Appendix (Page No. - 147)
12.1 Discussion Guide
12.2 Knowledge Store: Marketsandmarkets� Subscription Portal
12.3 Available Customizations
12.4 Related Reports
12.5 Author Details
List of Tables (74 Tables)
Table 1 USD Exchange Rates, 2014�2017
Table 2 List of Important Patents for Molecular Breeding, 2013�2018
Table 3 Molecular Breeding Market Size, By Process, 2016�2023 (USD Million)
Table 4 Marker-Assisted Selection: Molecular Breeding Market Size, By Region, 2016�2023 (USD Million)
Table 5 QTL Mapping: Molecular Breeding Market Size, By Region, 2016�2023 (USD Million)
Table 6 Marker-Assisted Backcrossing: Molecular Breeding Market Size, By Region, 2016�2023 (USD Million)
Table 7 Genomic Selection: Molecular Breeding Market Size, By Region, 2016�2023 (USD Million)
Table 8 Other Processes: Molecular Breeding Market Size, By Region, 2016�2023 (USD Million)
Table 9 Feature Difference Between SNP, SSR, and Other Molecular Markers
Table 10 Molecular Breeding Market Size, By Marker, 2016�2023 (USD Million)
Table 11 SNP: Molecular Breeding Market Size, By Region, 2016�2023 (USD Million)
Table 12 SSR: Molecular Breeding Market Size, By Region, 2016�2023 (USD Million)
Table 13 Other Markers: Molecular Breeding Market Size, By Region, 2016�2023 (USD Million)
Table 14 Molecular Breeding Market Size, By Application, 2016�2023 (USD Million)
Table 15 Molecular Breeding Application Market Size for Crops, By Region, 2016�2023 (USD Million)
Table 16 Market Size for Crops, By Type, 2016�2023 (USD Million)
Table 17 Molecular Breeding Market Size for Cereals & Grains, By Region, 2016�2023 (USD Million)
Table 18 Market Size for Cereals & Grains, By Crop, 2016�2023 (USD Million)
Table 19 Market Size for Corn, By Region, 2016�2023 (USD Million)
Table 20 Market Size for Wheat, By Region, 2016�2023 (USD Million)
Table 21 Molecular Breeding Market Size for Rice, By Region, 2016�2023 (USD Million)
Table 22 Market Size for Other Cereals & Grains, By Region, 2016�2023 (USD Million)
Table 23 Market Size for Oilseeds, By Region, 2016�2023 (USD Million)
Table 24 Market Size for Oilseeds, By Crop, 2016�2023 (USD Million)
Table 25 Molecular Breeding Market Size for Soybean, By Region, 2016�2023 (USD Million)
Table 26 Market Size for Other Oilseeds, By Region, 2016�2023 (USD Million)
Table 27 Molecular Breeding Market Size for Vegetables, By Region, 2016�2023 (USD Million)
Table 28 Market Size for Other Crops, By Region, 2016�2023 (USD Million)
Table 29 Market Size for Livestock, By Region, 2016�2023 (USD Million)
Table 30 Market Size for Livestock, By Type, 2016�2023 (USD Million)
Table 31 Molecular Breeding Market Size for Cattle, By Region, 2016�2023 (USD Million)
Table 32 Market Size for Poultry, By Region, 2016�2023 (USD Million)
Table 33 Molecular Breeding Market Size for Other Livestock, By Region, 2016�2023 (USD Million)
Table 34 Market Size, By Region, 2016�2023 (USD Million)
Table 35 North America: Molecular Breeding Market Size, By Country, 2016�2023 (USD Million)
Table 36 North America: Market Size, By Process, 2016�2023 (USD Million)
Table 37 North America: Market Size, By Marker, 2016�2023 (USD Million)
Table 38 North America: Market Size for Crops, By Type, 2016�2023 (USD Million)
Table 39 North America: Market Size for Livestock, By Type, 2016�2023 (USD Million)
Table 40 US: Market Size, By Application, 2016�2023 (USD Million)
Table 41 Canada: Market Size, By Application, 2016�2023 (USD Million)
Table 42 Mexico: Market Size, By Application, 2016�2023 (USD Million)
Table 43 Europe: Molecular Breeding Market Size, By Country, 2016�2023 (USD Million)
Table 44 Europe: Market Size, By Process, 2016�2023 (USD Million)
Table 45 Europe: Market Size, By Marker, 2016�2023 (USD Million)
Table 46 Europe: Market Size for Crops, By Type, 2016�2023 (USD Million)
Table 47 Europe: Market Size for Livestock, By Type, 2016�2023 (USD Million)
Table 48 Germany: Molecular Breeding Market Size, By Application, 2016�2023 (USD Million)
Table 49 France: Market Size, By Application, 2016�2023 (USD Million)
Table 50 Netherlands: Market Size, By Application, 2016�2023 (USD Million)
Table 51 UK: Molecular Breeding Market Size, By Application, 2016�2023 (USD Million)
Table 52 Rest of Europe: Molecular Breeding Market Size, By Application, 2016�2023 (USD Million)
Table 53 Asia Pacific: Molecular Breeding Market Size, By Country, 2016�2023 (USD Million)
Table 54 Asia Pacific: Market Size, By Process, 2016�2023 (USD Million)
Table 55 Asia Pacific: Market Size, By Marker, 2016�2023 (USD Million)
Table 56 Asia Pacific: Market Size for Crops, By Type, 2016�2023 (USD Million)
Table 57 Asia Pacific: Market Size for Livestock, By Type, 2016�2023 (USD Million)
Table 58 Australia: Molecular Breeding Market Size, By Application, 2016�2023 (USD Million)
Table 59 China: Market Size, By Application, 2016�2023 (USD Million)
Table 60 India: Molecular Breeding Market Size, By Application, 2016�2023 (USD Million)
Table 61 Japan: Market Size, By Application, 2016�2023 (USD Million)
Table 62 Rest of Asia Pacific: Molecular Breeding Market Size, By Application, 2016�2023 (USD Million)
Table 63 RoW: Molecular Breeding Market Size, By Country, 2016�2023 (USD Million)
Table 64 RoW: Market Size, By Process, 2016�2023 (USD Million)
Table 65 RoW: Market Size, By Marker, 2016�2023 (USD Million)
Table 66 RoW: Market Size for Crops, By Type, 2016�2023 (USD Million)
Table 67 RoW: Market Size for Livestock, By Type, 2016�2023 (USD Million)
Table 68 Brazil: Market Size, By Application, 2016�2023 (USD Million)
Table 69 South Africa: Molecular Breeding Market Size, By Application, 2016�2023 (USD Million)
Table 70 Israel: Market Size, By Application, 2016�2023 (USD Million)
Table 71 Others in RoW: Molecular Breeding Market Size, By Application, 2016�2023 (USD Million)
Table 72 Mergers & Acquisitions, 2013�2018
Table 73 Expansions & Investments, 2013�2018
Table 74 Collaborations, Agreements, Partnerships, and Joint Ventures, 2015�2018
List of Figures (40 Figures)
Figure 1 Molecular Breeding Market Segmentation
Figure 2 Molecular Breeding Market, By Region
Figure 3 Molecular Breeding: Research Design
Figure 4 Breakdown of Primary Interviews: By Company Type, Designation, and Region
Figure 5 Market Size Estimation Methodology: Bottom-Up Approach
Figure 6 Market Size Estimation Methodology: Top-Down Approach
Figure 7 Data Triangulation
Figure 8 Molecular Breeding Market, By Process, 2018 vs 2023
Figure 9 Market Share, By Marker, 2018
Figure 10 Molecular Breeding Market, By Application, 2018 vs 2023
Figure 11 Molecular Breeding Market: Regional Snapshot
Figure 12 Increased Funding in Agrigenomics Research to Drive Market Growth
Figure 13 Cereals & Grains Accounted for the Highest Adoption Rate Among Crop Growers in 2017
Figure 14 North America: Strong Demand for SNP Markers From Crop Breeders in 2017
Figure 15 North America Dominated the Market Across All Molecular Breeding Services in 2017
Figure 16 US: Important Market for Molecular Breeding, 2017
Figure 17 Evolution of Breeding Technologies
Figure 18 Canada: Animal Genetic Exports (For Breeding Purpose), 2013�2017 (USD Million)
Figure 19 Molecular Breeding Market: Drivers, Restraints, Opportunities, and Challenges
Figure 20 Decline in Genome Sequencing Prices, 2002�2014 (USD Million)
Figure 21 R&D Expenditures, By Country, 2017 (USD Million)
Figure 22 Number of Patents Approved for Molecular Breeding, By Key Company, 2017�2018
Figure 23 Geographical Analysis: Patent Approval for Molecular Breeding, 2017�2018
Figure 24 Supply Chain Analysis: Molecular Breeding Market
Figure 25 Molecular Breeding Market, By Process, 2018 vs 2023 (USD Million)
Figure 26 Molecular Breeding Market, By Marker, 2018 vs 2023 (USD Million)
Figure 27 Molecular Breeding Market, By Application, 2018 vs 2023 (USD Million)
Figure 28 India is Projected to Witness the Strong Growth During the Forecast Period
Figure 29 North America: Market Snapshot
Figure 30 Asia Pacific: Market Snapshot
Figure 31 Key Developments By Leading Players in the Molecular Breeding Market, 2013�2018
Figure 32 Company Share Analysis: Molecular Breeding Market, 2017
Figure 33 Company Ranking: Molecular Breeding Market, 2017
Figure 34 Eurofins: Company Snapshot
Figure 35 Thermo Fisher Scientific: Company Snapshot
Figure 36 Illumina Inc.: Company Snapshot
Figure 37 SGS: Company Snapshot
Figure 38 LGC Group: Company Snapshot
Figure 39 Intertek: Company Snapshot
Figure 40 Charles River: Company Snapshot
The molecular breeding market was valued at USD 1.57 billion in 2017 and is projected to reach USD 3.95 billion by 2023, at a CAGR of 17.11% during the forecast period.
The years considered for the study are as follows:
- Base year � 2017
- Estimated year � 2018
- Projected year � 2023
- Forecast period � 2018 to 2023
The objectives of the report are as follows:
- Determining and projecting the size of the molecular breeding market, with respect to process, marker, application, and regional markets, over a five-year period ranging from 2018 to 2023
- Identifying attractive opportunities in the market by determining the largest and fastest-growing segments across regions.
- Analyzing the demand-side factors based on the impact of macro and microeconomic factors on the market and shifts in demand patterns across different subsegments and regions.
Research Methodology:
- Major regions were identified, along with countries contributing the maximum share.
- Secondary research was conducted to obtain the value of the molecular breeding market for regions such as North America, Europe, Asia Pacific, and RoW.
- Key players have been identified through secondary sources such as the Bloomberg Businessweek, Factiva, agrigenomic magazines, and companies� annual reports while their market share in the respective regions has been determined through both, primary and secondary research. The research methodology includes the study of annual and financial reports of top market players as well as interviews with industry experts (such as CEOs, VPs, directors, and marketing executives) for key insights (both quantitative and qualitative) for the molecular breeding market.
To know about the assumptions considered for the study, download the pdf brochure
The various contributors involved in the value chain of the molecular breeding market include R&D institutes, breeding entities, technology providers, such as Eurofins (Luxembourg), Illumina (US), Thermo Fisher Scientific (US), SGS (Switzerland), and LGC Limited (UK), and government bodies & regulatory associations such as the US Department of Agriculture (USDA), Canadian Association of Genetic Counsellors (CAGC), and the American Genetic Association (AGA).
Target Audience
The stakeholders for the report are as follows:
- Technology providers, lab instrument & equipment manufacturers
- Biotechnological companies
- Genetic solution providers
- Plant & livestock breeders
- Public and private research institutions/agencies/laboratories
- Commercial and GMO seed manufacturers
- Concerned government authorities, and plant breeding societies and associations
Scope of the Report
This research report categorizes the molecular breeding market based on process, marker type, application, and region.
Based on process, the market has been segmented as follows:
- QTL mapping
- Marker-assisted selection (MAS)
- Marker-assisted backcrossing (MABC)
- Genomic selection
- Other processes (marker-assisted recurrent selection (MARS), position gene cloning, and genetic fingerprinting)
Based on marker, the market has been segmented as follows:
- Single nucleotide polymorphism (SNP)
- Simple sequence repeats (SSR)
- Other markers (expressed sequence tags (EST), sequence tagged site, and random amplified polymorphic DNA (RAPD))
Based on application, the market has been segmented as follows:
- Crop
- Cereals & grains
- Corn
- Wheat
- Rice
- Others (sorghum, barley, and oats)
- Oilseeds & pulses
- Soybean
- Others (canola, cotton, and sunflower)
- Vegetables
- Other crop types (fruits, ornamentals, and greenhouse & nursery plants)
- Cereals & grains
- Livestock
- Cattle
- Poultry
- Other livestock (equine, swine, aquaculture, and other avian livestock)
Based on region, the market has been segmented as follows:
- North America
- Europe
- Asia Pacific
- RoW (South America, Africa, and the Middle East)
Available Customizations
With the given market data, MarketsandMarkets offers customizations according to the company�s specific scientific needs.
The following customization options are available for the report:
Product Analysis:
- Product Matrix, which gives a detailed comparison of the product portfolio of each company
Geographic Analysis
- Further breakdown of the Rest of European market for molecular breeding into the Spain, Italy, Belgium, Denmark, and Sweden
- Further breakdown of the Rest of Asia Pacific market for molecular breeding into South Korea, Thailand, the Philippines, and Indonesia
- Further breakdown of others in RoW market for molecular breeding into Argentina, Chile, Colombia, and Nigeria
Company Information
- Detailed analyses and profiling of additional market players (up to five)


Growth opportunities and latent adjacency in Molecular Breeding Market