
Blood Collection Devices Market Size, Growth, Share & Trends Analysis

Blood Collection Devices Market by Product (Tubes (Plasma (EDTA, Heparin), Serum), Needles & Syringes, Blood Bags, Monitors), Method (Manual, Automated), Application (Diagnostics, Therapeutics), End User (Hospitals, Blood Banks) - Global Forecast to 2030


OVERVIEW
Source: Secondary Research, Interviews with Experts, MarketsandMarkets Analysis
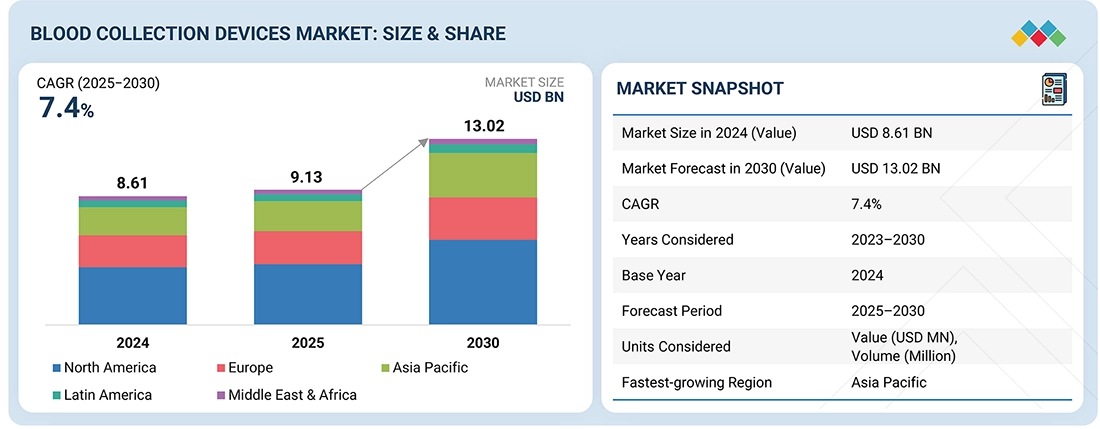
The global blood collection devices market is estimated at USD 9.13 billion in 2025 and is projected to reach USD 13.02 billion by 2030, growing at a CAGR of 7.4% during the forecast period. The market is strongly driven by the rising prevalence of infectious diseases, chronic and lifestyle-related conditions, and the increasing number of hospitals and surgical centers worldwide. The growing number of accidents and trauma cases has further increased the need for rapid and reliable blood collection for diagnostics and emergency care. At the same time, the emergence of liquid biopsy tests, which rely on blood samples for early disease detection and monitoring, is driving the demand for advanced collection devices that ensure sample integrity and accuracy. Additionally, growing awareness and the demand for blood donations and blood components are contributing to the expansion of the market, particularly in emerging regions. Collectively, these factors are increasing adoption, improving patient care and diagnostics, and strengthening the overall growth of the global blood collection devices market.
KEY TAKEAWAYS
-
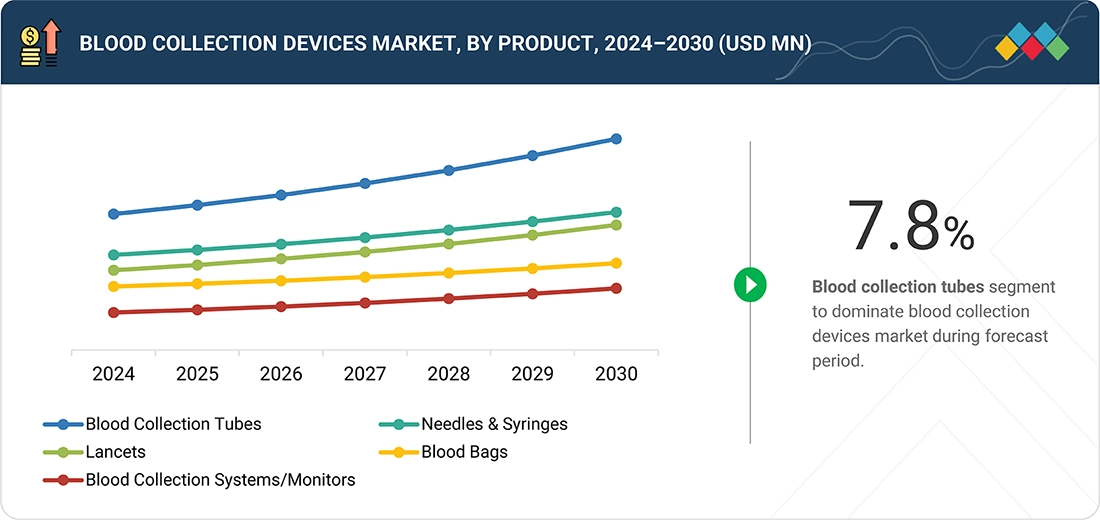
BY PRODUCTBased on products, the blood collection devices market is segmented into blood collection tubes, needles & syringes, blood bags, blood collection systems/monitors, and lancets. Among these, blood collection tubes dominate the market, driven by their widespread use in diagnostic testing, routine health check-ups, and blood banking procedures. These tubes enable multiple samples to be collected from a single patient for various tests, ensuring accuracy, convenience, and efficiency in clinical workflows. The growing prevalence of chronic and infectious diseases, coupled with the increasing demand for reliable diagnostic results, further reinforces the strong demand for blood collection tubes. While other products such as needles, syringes, and blood bags play a vital role in overall blood collection processes, tubes remain the largest contributor to market revenue due to their consistent and recurring use across healthcare settings.
-
BY METHODBased on methods, the blood collection devices market is divided into manual and automated blood collection methods. Manual blood collection continues to be widely used across hospitals, clinics, and blood banks due to its simplicity, cost-effectiveness, and adaptability to various clinical settings. It allows healthcare professionals to collect samples with minimal equipment requirements, making it suitable for both routine and emergency procedures. Manual methods remain essential in regions with limited access to advanced technologies, where they support large-scale diagnostic and therapeutic applications efficiently and reliably.
-
BY APPLICATIONBased on applications, the blood collection devices market is categorized into diagnostic and therapeutic applications. Diagnostic applications account for a major share of usage, as blood testing remains essential for disease detection, health monitoring, and preventive screening. These applications support the identification of infections, chronic diseases, and other medical conditions through accurate and timely blood analysis. Therapeutic applications primarily involve transfusions and related procedures but represent a comparatively smaller portion of overall use. The growing emphasis on early diagnosis and regular health check-ups continues to drive the demand for blood collection devices in diagnostic settings.
-
BY END USERBased on end users, the blood collection devices market is categorized into hospitals, ambulatory surgical centers (ASCs), and nursing homes; diagnostic and pathology laboratories; blood banks; and other end users. Hospitals, ASCs, and nursing homes account for a substantial share of the market due to the high number of patient admissions, surgical procedures, and routine diagnostic tests conducted in these facilities. Diagnostic and pathology laboratories also represent a major end-user segment, as blood testing forms the foundation of disease detection, monitoring, and preventive healthcare. Blood banks rely on these devices for efficient collection, processing, and storage of blood and its components. The continuous expansion of healthcare infrastructure and increasing demand for accurate diagnostic testing are expected to further drive the adoption of blood collection devices across all end-user segments.
-
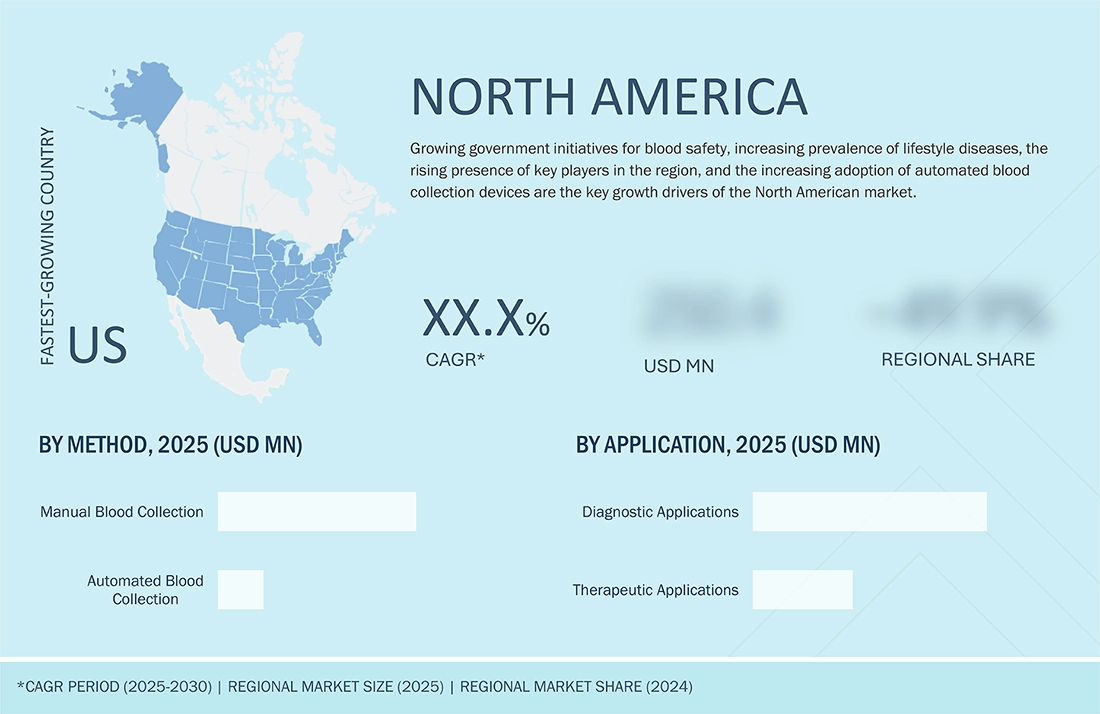
BY REGIONThe blood collection devices market spans North America, Europe, Asia Pacific, Latin America, and the Middle East & Africa. North America dominates the market, supported by a well-established healthcare infrastructure, high diagnostic testing rates, and the strong presence of leading manufacturers. The Asia Pacific region is projected to record the fastest growth due to expanding healthcare access, growing awareness of preventive diagnostics, and increasing demand for advanced blood collection systems across hospitals and diagnostic laboratories.
-
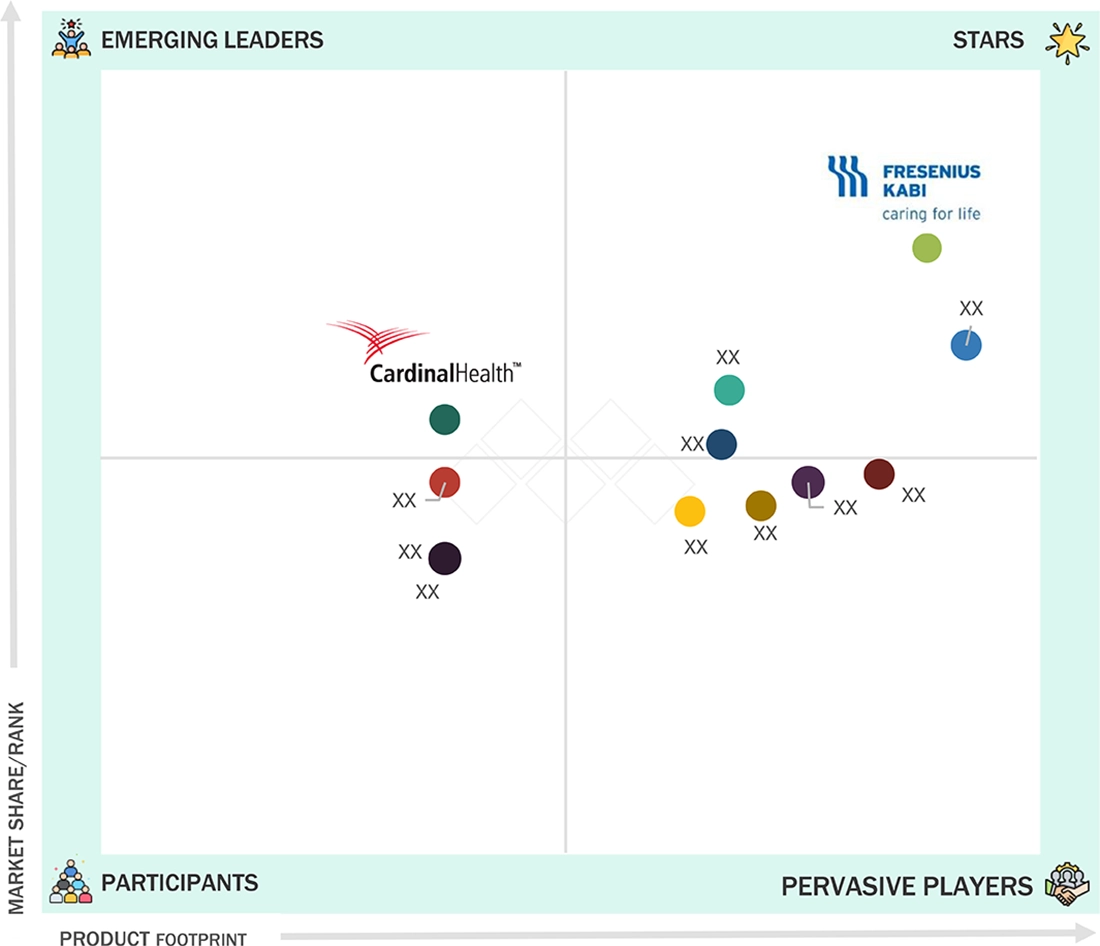
COMPETITIVE LANDSCAPEMajor players in the blood collection devices market have adopted a mix of organic and inorganic growth strategies, including partnerships, collaborations, and investments to expand their product portfolios and global reach. The top five players in the market include Fresenius Kabi AG; Becton, Dickinson and Company; Terumo BCT, Inc.; Greiner Bio-One; and Cardinal Health. These companies focus on introducing advanced blood collection solutions, enhancing manufacturing capabilities, and strengthening distribution networks to cater to the growing global demand for safe and efficient blood collection.
The blood collection devices market is set to experience steady growth in the coming years, driven by the rising prevalence of infectious, chronic, and lifestyle-related diseases, along with an increasing number of hospitals and surgical centers worldwide. The growing incidence of accidents and trauma cases is further boosting the demand for rapid, safe, and efficient blood collection solutions to support emergency care and diagnostics. Additionally, the emergence of liquid biopsy tests, which utilize blood samples for early detection and monitoring of diseases such as cancer, is creating new growth opportunities for advanced blood collection technologies. Expanding awareness and demand for blood donations and blood components are also contributing to market expansion, particularly in developing regions. Moreover, ongoing improvements in healthcare infrastructure and the introduction of automated and safety-engineered collection systems are enhancing the reliability, efficiency, and accessibility of blood collection across diverse clinical settings.
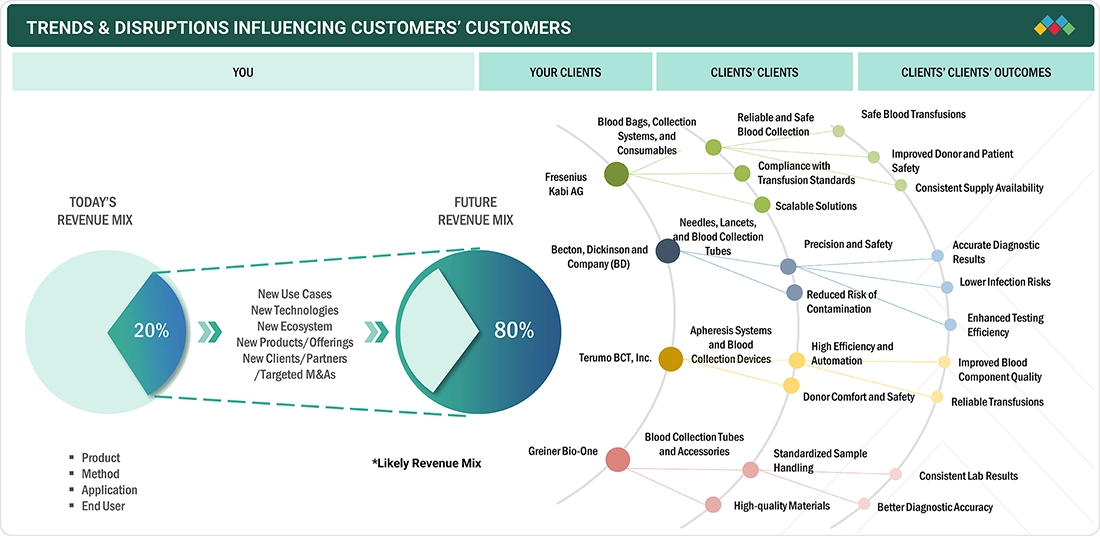
TRENDS & DISRUPTIONS IMPACTING CUSTOMERS' CUSTOMERS
The blood collection devices market is witnessing notable transformation, driven by the rising prevalence of infectious, chronic, and lifestyle diseases, coupled with growing awareness of preventive healthcare and regular testing. Hospitals, diagnostic laboratories, ambulatory surgical centers, and nursing homes represent the primary end users of blood collection devices. Key trends such as the increasing demand for safe and efficient collection systems, adoption of automated and closed blood collection technologies, and advancements in liquid biopsy and plasma separation techniques are reshaping clinical workflows and collection practices. These developments directly influence the procurement of consumables, instruments, and accessories, thereby strengthening the growth outlook and competitive positioning of blood collection device manufacturers.
Source: Secondary Research, Interviews with Experts, MarketsandMarkets Analysis
MARKET DYNAMICS
Level
-
Rising prevalence of infectious diseases and chronic & lifestyle diseases

-
Increasing number of hospitals and surgical centers

Level
-
Rising costs of automated blood collection devices

Level
-
Increasing demand for apheresis

-
Lucrative opportunities in emerging economies

Level
-
Complex storage and shipping

-
Lack of skilled professionals

Source: Secondary Research, Interviews with Experts, MarketsandMarkets Analysis
Driver: Rising prevalence of infectious diseases and chronic & lifestyle diseases
The growing incidence of infectious diseases, along with the increasing burden of chronic and lifestyle-related conditions such as diabetes, cardiovascular disorders, and cancer, is a major driver for the blood collection devices market. Regular blood testing is essential for disease diagnosis, monitoring, and management, leading to heightened demand for efficient and accurate blood collection systems. Moreover, the global emphasis on preventive healthcare and early disease detection is encouraging routine health screenings, further supporting the widespread adoption of advanced blood collection devices in hospitals, diagnostic laboratories, and other healthcare settings.
Restraint: Rising costs of automated blood collection devices
The high cost associated with automated and advanced blood collection systems poses a significant restraint to market expansion, particularly in low- and middle-income countries. Automated devices offer advantages such as improved safety, reduced contamination risk, and faster sample processing, but their elevated price limits adoption among smaller healthcare facilities and diagnostic centers with budget constraints. Additionally, the need for specialized infrastructure and maintenance further increases operational expenses, which may hinder widespread implementation in cost-sensitive markets.
Opportunity: Advancements in blood collection
Technological innovations in blood collection, including the development of minimally invasive and closed-system devices, present significant growth opportunities for the market. The emergence of vacuum-based, microcollection, and laser-assisted devices enhances collection efficiency, patient comfort, and sample quality. Furthermore, the integration of automation, digital monitoring, and connectivity solutions supports error reduction and streamlined laboratory operations. These advancements are driving the transition toward safer, faster, and more patient-friendly blood collection methods, expanding adoption across both hospital and point-of-care settings.
Challenge: Lack of skilled professionals
A shortage of skilled healthcare professionals trained in proper blood collection techniques poses a major challenge for the market. Inadequate training can lead to sample contamination, hemolysis, or patient discomfort, compromising diagnostic accuracy and efficiency. This challenge is particularly evident in rural and resource-limited settings where access to trained phlebotomists and laboratory technicians is limited. Addressing this gap through targeted training programs, certification initiatives, and automated solutions will be crucial to ensuring consistent, high-quality sample collection and sustaining market growth.
Blood Collection Devices Market: COMMERCIAL USE CASES ACROSS INDUSTRIES
| COMPANY | USE CASE DESCRIPTION | BENEFITS |
|---|---|---|
 |
Provides blood collection and processing solutions for transfusion and therapeutic applications, including collection bags, automated devices, and blood component separators. | Enables efficient and sterile blood collection, enhances component quality, reduces wastage, supports safe transfusion practices, and improves donor and patient safety. |
 |
Offers a wide range of blood collection systems, including vacuum-based tubes, needles, and safety-engineered devices used across hospitals and diagnostic laboratories. The company’s Vacutainer system is a global standard for routine and specialized blood testing. | Ensures accurate and contamination-free sample collection, enhances patient and operator safety, supports high-throughput processing, reduces manual errors, and complies with global safety standards. |
 |
Specializes in automated blood and apheresis collection technologies, offering systems such as Trima Accel and Spectra Optia for blood component collection and processing. | Automates and optimizes collection efficiency, enhances accuracy in component separation, reduces operator intervention, supports large-scale blood center operations, and ensures consistent product quality. |
 |
Manufactures high-quality blood collection tubes, needles, and accessories under the VACUETTE brand, widely used in clinical and diagnostic laboratories. | Ensures reliable sample integrity, minimizes pre-analytical errors, provides compatibility with automated analyzers, enhances workflow efficiency, and supports high safety standards. |
 |
Supplies a range of blood collection and laboratory consumables, including safety-engineered needles, holders, and collection systems used in hospitals and diagnostic centers. | Improves safety for healthcare professionals, reduces needlestick injuries, ensures consistent sample quality, simplifies handling, and enhances workflow efficiency in clinical settings. |
Logos and trademarks shown above are the property of their respective owners. Their use here is for informational and illustrative purposes only.
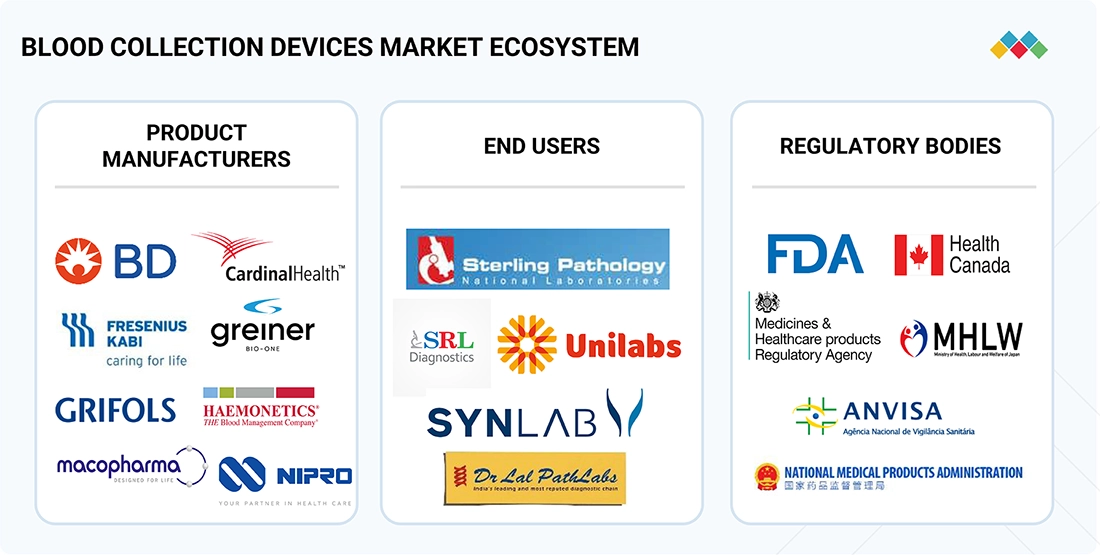
MARKET ECOSYSTEM
The blood collection devices market caters to a broad spectrum of end users, including hospitals, ambulatory surgical centers, nursing homes, diagnostic and pathology laboratories, and blood banks. These end users rely on blood collection systems for diagnostic testing, transfusion, and therapeutic applications. The increasing prevalence of chronic and infectious diseases, coupled with the growing number of diagnostic procedures and surgical interventions, is fueling product adoption across these settings. Furthermore, the integration of safety-engineered devices, automation, and closed-system technologies is improving workflow efficiency, minimizing contamination risks, and enhancing patient and healthcare worker safety. Supportive healthcare policies, rising awareness of regular health checkups, and the expansion of clinical laboratory infrastructure continue to drive growth across all end-user segments.
Logos and trademarks shown above are the property of their respective owners. Their use here is for informational and illustrative purposes only.
MARKET SEGMENTS
Source: Secondary Research, Interviews with Experts, MarketsandMarkets Analysis
Blood Collection Devices Market, By Product
The blood collection devices market is segmented into blood collection tubes, needles & syringes, blood bags, blood collection systems/monitors, and lancets. Among these, blood collection tubes dominate the market, driven by their widespread use in diagnostic testing, routine health check-ups, and blood banking procedures. These tubes enable multiple samples to be collected from a single patient for various tests, ensuring accuracy, convenience, and efficiency in clinical workflows. The growing prevalence of chronic and infectious diseases, coupled with increasing demand for reliable diagnostic results, further reinforces the strong demand for blood collection tubes. While other products such as needles, syringes, and blood bags play a vital role in overall blood collection processes, tubes remain the largest contributor to market revenue due to their consistent and recurring use across healthcare settings.
Blood Collection Devices Market, By Method
The blood collection devices market is divided into manual and automated blood collection methods. Manual blood collection continues to be widely used across hospitals, clinics, and blood banks due to its simplicity, cost-effectiveness, and adaptability to various clinical settings. It allows healthcare professionals to collect samples with minimal equipment requirements, making it suitable for both routine and emergency procedures. Manual methods remain essential in regions with limited access to advanced technologies, where they support large-scale diagnostic and therapeutic applications efficiently and reliably.
Blood Collection Devices Market, By Application
The blood collection devices market is categorized into diagnostic and therapeutic applications. Diagnostic applications account for a major share of usage, as blood testing remains essential for disease detection, health monitoring, and preventive screening. These applications support the identification of infections, chronic diseases, and other medical conditions through accurate and timely blood analysis. Therapeutic applications primarily involve transfusions and related procedures but represent a comparatively smaller portion of overall use. The growing emphasis on early diagnosis and regular health check-ups continues to drive the demand for blood collection devices in diagnostic settings.
Blood Collection Devices Market, By End User
The blood collection devices market is categorized by end user into hospitals, ambulatory surgical centers (ASCs), and nursing homes; diagnostic and pathology laboratories; blood banks; and other end users. Hospitals, ASCs, and nursing homes account for a substantial share of the market due to the high number of patient admissions, surgical procedures, and routine diagnostic tests conducted in these facilities. Diagnostic and pathology laboratories also represent a major end-user segment, as blood testing forms the foundation of disease detection, monitoring, and preventive healthcare. Blood banks rely on these devices for efficient collection, processing, and storage of blood and its components. The continuous expansion of healthcare infrastructure and increasing demand for accurate diagnostic testing are expected to further drive the adoption of blood collection devices across all end-user segments.
REGION
North America accounted for largest share of global blood collection devices market during forecast period
The blood collection devices market in North America is witnessing steady growth, supported by a robust healthcare infrastructure, significant healthcare spending, and increasing adoption of advanced diagnostic technologies. Rising cases of chronic and infectious diseases, along with a surge in surgical procedures and trauma cases, are driving the need for efficient and safe blood collection solutions across healthcare settings. Additionally, a strong presence of major industry players, favorable reimbursement policies, and ongoing technological innovations are further contributing to the market’s continued expansion in the region.
Blood Collection Devices Market: COMPANY EVALUATION MATRIX
Fresenius Kabi AG is a leading player in the global blood collection devices market, recognized for its wide range of high-quality blood bags, collection systems, and related consumables. The company’s strong expertise in transfusion and infusion technologies enables it to cater effectively to the needs of hospitals, blood banks, and healthcare institutions worldwide. With a well-established global presence and focus on product safety, reliability, and innovation, Fresenius Kabi continues to strengthen its position in the market. Strategic collaborations, continuous product enhancements, and a commitment to supporting blood donation and transfusion programs further reinforce the company’s leadership in the blood collection devices segment.
Source: Secondary Research, Interviews with Experts, MarketsandMarkets Analysis
KEY MARKET PLAYERS
MARKET SCOPE
| REPORT METRIC | DETAILS |
|---|---|
| Market Size in 2024 (Value) | USD 8.61 Billion |
| Market Forecast in 2030 (Value) | USD 13.02 Billion |
| Growth Rate | CAGR of 7.4% from 2025–2030 |
| Years Considered | 2023–2030 |
| Base Year | 2024 |
| Forecast Period | 2025–2030 |
| Units Considered | Value (USD Million), Volume (Million) |
| Report Coverage | Revenue Forecast, Company Ranking, Competitive Landscape, Growth Factors, and Trends |
| Segments Covered |
|
| Regional Scope | North America, Europe, Asia Pacific, Latin America, and the Middle East & Africa |
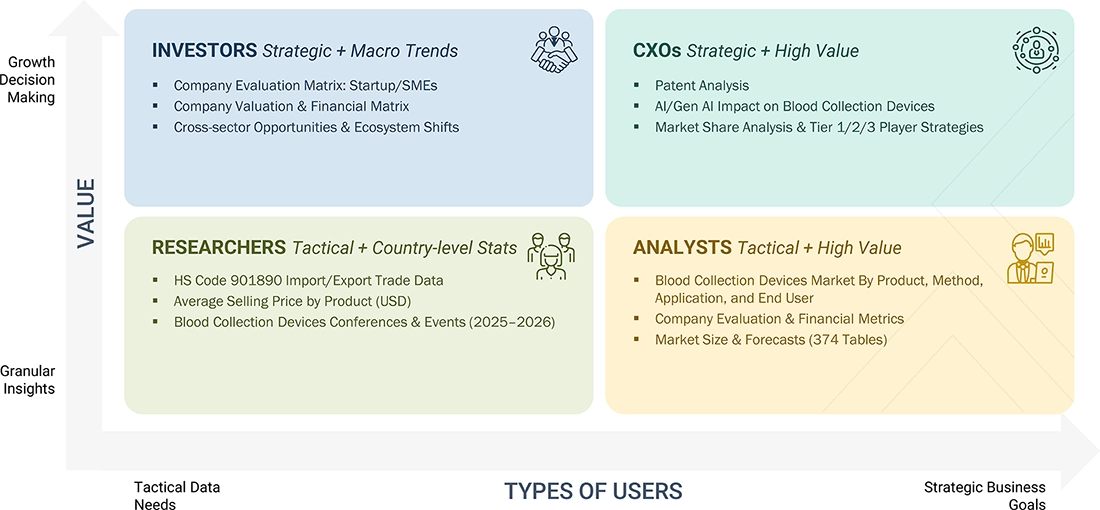
WHAT IS IN IT FOR YOU: Blood Collection Devices Market REPORT CONTENT GUIDE
RECENT DEVELOPMENTS
- January 2025 : Terumo BCT signed a Memorandum of Understanding (MoU) on a strategic partnership with the Shandong Institute of Medical Devices and Pharmaceutical Packaging Inspection. This partnership will strengthen technical research and innovation, with emphasis on Terumo BCT's strategic product areas, including blood component collection.
- January 2025 : Fresenius Kabi received FDA clearance for Adaptive Nomogram, an alternate algorithm that will be available in the Aurora Xi Plasmapheresis System. The algorithm enables an average 11.5% increase in plasma collection per donation while maintaining safe and effective operation.
- December 2024 : BD, along with Babson Diagnostics, launched the BD MiniDraw Capillary Blood Collection System, which incorporates Babson's BetterWay technologies to enable test results from as few as six drops of capillary blood collected from a patient's finger.
- December 2023 : BD received 510(k) clearance from the US Federal Drug Administration (FDA) for a novel blood collection device that obtains blood samples from a fingerstick that produce lab-quality results for some of the most commonly ordered blood tests.
Table of Contents
 Exclusive indicates content/data unique to MarketsandMarkets and not available with any competitors.
Methodology
This research study extensively used secondary sources, directories, and databases to identify and collect valuable information to analyze the global blood collection devices market. In-depth interviews were conducted with various primary respondents, including key industry participants, subject-matter experts (SMEs), C-level executives of key market players, and industry consultants, to obtain and verify critical qualitative & quantitative information and assess the growth prospects in the market. The global market size estimated through secondary research was then triangulated with inputs from primary research to arrive at the final market size.
Secondary Research
This research study extensively used secondary sources, directories, and databases to identify and collect valuable information to analyze the global blood collection devices market. In-depth interviews were conducted with various primary respondents, including key industry participants, subject-matter experts (SMEs), C-level executives of key market players, and industry consultants, to obtain and verify critical qualitative & quantitative information and assess the growth prospects in the market. The global market size estimated through secondary research was then triangulated with inputs from primary research to arrive at the final market size.
Primary Research
In-depth interviews were conducted with various primary respondents, including key industry participants, subject-matter experts (SMEs), C-level executives of key market players, and industry consultants, to obtain and verify the critical qualitative & quantitative information and assess the prospects of the market. Various primary sources from both the supply & demand sides of the market were interviewed to obtain qualitative and quantitative information.
The following is a breakdown of the primary respondents:

To know about the assumptions considered for the study, download the pdf brochure
Market Size Estimation
Both top-down and bottom-up approaches were used to estimate and validate the total size of the blood collection devices market. These methods were also used extensively to estimate the size of various subsegments in the market. The research methodology used to estimate the market size includes the following:

Data Triangulation
The total market was split into several segments and subsegments after arriving at the overall market size from the estimation process. Where applicable, data triangulation and market breakdown procedures were employed to complete the overall market engineering process and arrive at the exact statistics for all segments and subsegments. The data was triangulated by studying various factors and trends from both the demand and supply sides.
Market Definition
Blood collection is the process of acquiring blood samples from patients for diagnostic and therapeutic purposes. It is an integral part of the diagnosis and blood group typing process in hospitals and blood bank centers. The blood collection devices market covers the products used to collect blood from patients/donors.
Stakeholders
- Healthcare Service Providers (Hospitals and Pathology Centers)
- Blood Collection Product Manufacturers
- Blood Banks
- Non-governmental Organizations (NGOs) and Government Organizations Associated with Blood Collection
- Market Research and Consulting Firms
- Venture Capitalists and Investors
Report Objectives
- To define, describe, and segment the global blood collection devices market by product, method, application, end user, and region
- To provide detailed information regarding the major factors influencing the growth of the market (drivers, restraints, opportunities, and challenges)
- To analyze micromarkets with respect to individual growth trends, prospects, and contributions to the global blood collection devices market
- To analyze the opportunities in the market for stakeholders and provide details of the competitive landscape for market players
- To forecast the size of market segments with respect to five major regional segments: North America, Europe, the Asia Pacific (APAC), Latin America, and the Middle East & Africa
- To profile the key players in the market and comprehensively analyze their market positions and core competencies
- To track and analyze competitive developments such as acquisitions, product launches, expansions, agreements, collaborations, and partnerships in the blood collection devices market
Need a Tailored Report?
Customize this report to your needs
Get 10% FREE Customization
Customize This ReportPersonalize This Research
- Triangulate with your Own Data
- Get Data as per your Format and Definition
- Gain a Deeper Dive on a Specific Application, Geography, Customer or Competitor
- Any level of Personalization
Let Us Help You
- What are the Known and Unknown Adjacencies Impacting the Blood Collection Devices Market
- What will your New Revenue Sources be?
- Who will be your Top Customer; what will make them switch?
- Defend your Market Share or Win Competitors
- Get a Scorecard for Target Partners

Custom Market Research Services
We Will Customise The Research For You, In Case The Report Listed Above Does Not Meet With Your Requirements
Get 10% Free CustomisationTESTIMONIALS

JAYANT RAJPUROHIT
Director of Market Insights, Data and Analytics
SFI Health,
Leading Pharmaceutical Companywww.sfihealth.com/

We at SFI Health approached MarketsandMarkets for an Opportunity Assessment on "Incidence and Prevalence of Focus Indications" as we wanted to know the most attractive HCPs like Physician, Functional MD, Naturopath and Pharmacist. The project was critical for us to ensure our focus on the right target which would enable sustainable growth and profitability for SFI Health. The business insights provided exceeded our expectations and we were extremely impressed. The team at MarketsandMarkets is highly professional and detail oriented and very well understood our business needs. MarketsandMarkets offers a unique combination of expertise and dedicated engagement model. We identified 2 new products to be launched in coming months, based on the research findings provided by MarketsandMarkets. We are happy with the services and would strongly recommend MarketsandMarkets to my peers in the industry.

BEATRIZ DE LA CALLE
Head of Commercial Analytics
Qualicaps,
Leading Pharmaceutical Companywww.qualicaps.com/

We partnered with MarketsandMarkets for an assessment study on hard empty capsules. The team was extremely professional in understanding our business requirements and we received timely responses to all our queries. The market intelligence and the recommendations has met our business requirements. We were extremely impressed to see the final study results; it really exceeded our expectations. The market intelligence offered by MarketsandMarkets, and clarity on next steps will help us achieve our business objective for the Year 2021. We are happy with the services and would strongly recommend MarketsandMarkets to my peers in the industry.

Bob Williams,
Senior Director Business Development & Innovation
Bracco Diagnostics Inc.,
Italian Multinational in life sciences sector and a World Leader in imaging diagnosticsimaging.bracco.com/us-en
We were pleased with targeted insights that MarketsandMarkets identified from a custom study on the 'Radiation Dose Management Solutions Market'. Your team identified and characterized the market participants as well as underlying trends accurately. This study was useful to Bracco in formulating business strategies for our dose monitoring product lines and we thank MarketsandMarkets for the job well done.
Cody Coonradt,
Market Development and Strategy Manager
3M Health Information Systems,
Leader in Health care Coding, Payment & Analytics Solutions.www.3m.com/3M/en_US/health-information-systems-us
The value for our organization comes from three things: depth of research, specificity of segments and being easy to work with. As important as the first two are, the third can't be underestimated. MarketsandMarkets, maybe more than any other research vendor, wants to know what is top of mind for our team and what big questions we are grappling to answer.
Their customer first approach and high value engagement model, have given us great analysis and excellent value for money
Growth opportunities and latent adjacency in Blood Collection Devices Market


Samuel
Oct, 2022
Who is the targeted audience for this Study?.
Louie
Oct, 2022
What will be the market value for Blood Collection Devices Market in 2028?.
Mason
Oct, 2022
Which factors are responsible for restraining the growth of Blood Collection Devices Market?.