Boiler Water Treatment Chemicals Market by Type (Corrosion Inhibitors, Scale Inhibitors, Oxygen Scavengers), End-Use Industry (Power, Oil & Gas, Chemical & Petrochemical, Food & Beverage, Pulp & Paper), and Region - Global Forecast to 2022


The boiler water treatment chemicals market is projected to reach USD 4.35 Billion by 2022, at a CAGR of 10.1%. In this study, 2016 has been considered as the base year while the forecast period that has been considered is from 2017 to 2022.
The main objective of this study is to define, describe, and forecast the boiler water treatment chemical market based on type, end-use industry, and region. The report includes detailed information about major factors such as drivers, restraints, opportunities, and industry-specific challenges influencing the growth of the boiler water treatment chemicals market. The report strategically analyzes market segments with respect to individual growth trends, growth prospects, and contribution to the total market. In the report, the boiler water treatment chemical market has been studied for North America, Europe, Asia-Pacific, the Middle East & Africa, and South America.
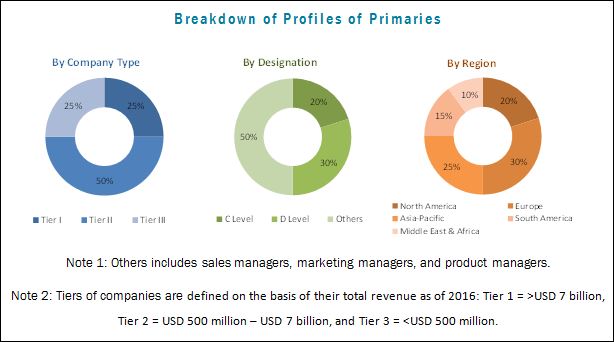
In this report, the market sizes and its different segments have been derived from various research methodologies. In the secondary research process, different sources have been referred to identify and collect information for this study on the boiler water treatment chemicals market. These secondary sources include annual reports, press releases, and investor presentations of companies; associations such as the American Association of Drilling Engineers (AADE), National Association of Corrosion Engineers (NACE), and Association of Water Technologies (AWT); and white papers, certified publications, and articles from recognized authors. In the primary research process, sources from both, supply- and demand-side have been interviewed to obtain qualitative and quantitative information for this report on the boiler water treatment chemical market. The bottom-up approach has been used to estimate the market size, in terms of value. The top-down approach has been implemented to validate the market size in terms of value. With the data triangulation procedure and validation of data through primaries, the exact values of the sizes of the overall parent market and individual markets have been determined and confirmed in this study.
The figure below illustrates the breakdown of the profiles of primaries.
To know about the assumptions considered for the study, download the pdf brochure
The boiler water treatment chemicals market includes raw material suppliers, manufacturers, and end users of boiler water treatment chemicals. BASF (Germany), Ecolab (U.S.), Kemira (Finland), Solenis (Finland), Kurita (Japan), SUEZ (France), Arkema (France) are the leading players operating in the boiler water treatment chemical market.
The stakeholders in the boiler water treatment chemicals market are:
- Manufacturers of Boiler Water Treatment Chemicals
- Traders, Distributors, and Suppliers of Boiler Water Treatment Chemicals
- Raw Material Suppliers
- Governments and Research Organizations
- Associations and Industrial Bodies
- R&D Institutions
- Environment Support Agencies
Boiler Water Treatment Chemicals Market Report Scope
The report forecasts revenue growth and provides an analysis of the trends in each of the subsegments of the boiler water treatment chemicals market. This research report categorizes the market based on the following:
Boiler Water Treatment Chemicals Market, by Type:
- Corrosion Inhibitors
- Scale Inhibitors
- Oxygen Scavengers
- Others
Boiler Water Treatment Chemicals Market, by End-Use Industry:
- Power
- Oil & Gas
- Chemical & Petrochemical
- Food & Beverage
- Pulp & Paper
- Others
Boiler Water Treatment Chemical Market, by Region:
- North America
- Asia-Pacific
- Europe
- Middle East & Africa
- South America
The boiler water treatment chemicals market in each region has been further segmented into its key countries.
Boiler Water Treatment Chemicals Market Report Available Customizations
The following customization options are available for the report:
-
Boiler Water Treatment Chemicals Market Country Information
- Analysis of the boiler water treatment chemicals market for additional countries
-
Boiler Water Treatment Chemicals Market Company Information
- Detailed analysis and profiles of additional market players (up to five)
The boiler water treatment chemicals market is projected to reach USD 4.35 Billion by 2022, at a CAGR of 10.1% from 2017 to 2022. The increasing demand for chemically treated water from various end-use industries is expected to drive the growth of the boiler water treatment chemical market across the globe during the forecast period. The degrading quality of water and aging infrastructure are the factors that are expected to fuel the growth of the boiler water treatment chemicals market during the forecast period.
Based on type, the corrosion inhibitors segment is projected to lead the boiler water treatment chemical market, in terms of volume, during the forecast period. This segment is projected to grow at the highest CAGR, in terms of volume, between 2017 and 2022. Corrosion inhibitors decrease the rate of corrosion rate of boilers by forming a passivation layer to the metal surface of the boiler systems. The performance of these chemicals depends upon the quality of the makeup water used by various end-use industries. Growing industrialization in emerging economies is also expected to fuel the growth of this segment during the forecast period.
Based on end-use industry, the power segment is projected to lead the boiler water treatment chemicals market, in terms of volume, during the forecast period. The growth of this segment can be attributed to rapid urbanization and continuously growing population across the globe. This, in turn, has led to an increased demand for power. Moreover, the rise in the number of nuclear projects in emerging economies across the globe is also contributing to the demand for boiler water treatment chemicals for power.
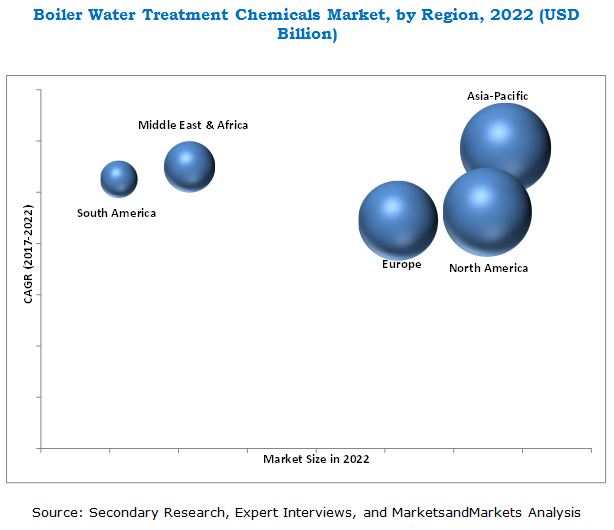
The Asia-Pacific region is expected to be the largest market for boiler water treatment chemicals during the forecast period. A large industrial base and increasing demand for power are the factors expected to fuel the growth of the Asia-Pacific boiler water treatment chemicals market between 2017 and 2022. In addition, government initiatives and policies to attract investments from various international companies are also expected to propel the growth of the Asia-Pacific boiler water treatment chemical market during the forecast period.
The requirement for technical expertise to handle and operate certain boiler water treatment chemicals is the major challenges for the growth of the boiler water treatment chemicals market between 2017 and 2022.
Key Boiler Water Treatment Chemicals Market Industry Players
BASF (Germany), Ecolab (U.S.), Solenis (Finland), Kurita (Japan), SUEZ (France), Arkema (France), and Kemira (Finland) are the key players operating in the boiler water treatment chemical market. These market leaders adopted various organic as well as inorganic growth strategies between January 2015 and October 2017 to strengthen their position in the boiler water treatment chemicals market. The strategy of mergers, joint venture & acquisitions was among the major growth strategies adopted by the leading market players to enhance their regional presence and meet the growing demand for boiler water treatment chemicals in emerging economies.
To speak to our analyst for a discussion on the above findings, click Speak to Analyst
 Exclusive indicates content/data unique to MarketsandMarkets and not available with any competitors.
Table of Contents
1 Introduction (Page No. - 12)
1.1 Objectives of the Study
1.2 Market Definition
1.3 Market Scope
1.3.1 Years Considered for the Study
1.4 Currency
1.5 Units Considered
1.6 Limitations
1.7 Stakeholders
2 Research Methodology (Page No. - 15)
2.1 Research Data
2.1.1 Secondary Data
2.1.1.1 Key Data From Secondary Sources
2.1.2 Primary Data
2.1.2.1 Key Data From Primary Sources
2.1.2.2 Key Industry Insights
2.1.2.3 Breakdown of Primary Interviews
2.2 Market Size Estimation
2.3 Data Triangulation
2.4 Assumptions
3 Executive Summary (Page No. - 23)
4 Premium Insights (Page No. - 26)
4.1 Significant Opportunities in the BWTC Market
4.2 BWTC Market Size, By Type
4.3 BWTC Market Share, By Region
4.4 BWTC Market Size, By End-Use Industry
4.5 BWTC Market Share, By End-Use Industry and Region
5 Market Overview (Page No. - 29)
5.1 Introduction
5.2 Market Dynamics
5.2.1 Drivers
5.2.1.1 Growing Demand for Power
5.2.1.2 Degrading Quality of Water
5.2.1 Restraints
5.2.1.1 Deposit Formation Due to Non-Volatile Nature of Certain BWTC
5.2.2 Opportunities
5.2.2.1 Growing Industrialization in Emerging Economies
5.2.2.2 Increase in the Demand for Specific Formulations
5.2.3 Challenges
5.2.3.1 Requirement of Technical Expertise in Handling and Operation of Certain BWTC
5.3 Porter’s Five Forces Analysis
5.3.1 Threat of New Entrants
5.3.2 Threat of Substitutes
5.3.3 Bargaining Power of Suppliers
5.3.4 Bargaining Power of Buyers
5.3.5 Intensity of Competitive Rivalry
6 BWTC Market, By Type (Page No. - 35)
6.1 Introduction
6.2 Corrosion Inhibitors
6.3 Scale Inhibitors
6.3.1 Phosphonates
6.3.2 Carboxylates/Acrylic
6.3.3 Chelating Agents
6.3.4 Others
6.4 Oxygen Scavengers
6.4.1 Sodium Sulfite
6.4.2 Hydrazine
6.4.3 Deha
6.4.4 Others
6.5 Others
7 BWTC Market, By End-Use Industry (Page No. - 41)
7.1 Introduction
7.2 Power
7.3 Oil & Gas
7.4 Chemical & Petrochemical
7.5 Food & Beverage
7.6 Pulp & Paper
7.7 Others
8 Boiler Water Treatment Chemicals Market, By Region (Page No. - 45)
8.1 Introduction
8.2 APAC
8.2.1 China
8.2.2 India
8.2.3 Japan
8.2.4 South Korea
8.2.5 Rest of APAC
8.3 North America
8.3.1 U.S.
8.3.2 Canada
8.3.3 Mexico
8.4 Europe
8.4.1 Germany
8.4.2 U.K.
8.4.3 France
8.4.4 Italy
8.4.5 Rest of Europe
8.5 Middle East & Africa
8.5.1 Saudi Arabia
8.5.2 South Africa
8.5.3 UAE
8.5.4 Rest of Middle East & Africa
8.6 South America
8.6.1 Brazil
8.6.2 Argentina
8.6.3 Rest of South America
9 Competitive Landscape (Page No. - 81)
9.1 Overview
9.2 Market Ranking of Key Players
9.2.1 Ecolab
9.2.2 Suez
9.2.3 Kemira
9.2.4 Kurita Water Industries
9.2.5 Solenis
9.3 Competitive Situation and Trends
9.3.1 Mergers, Joint Ventures & Acquisitions
9.3.2 Investments & Expansions
9.3.3 New Product Launches
9.3.4 Agreements
10 Company Profiles (Page No. - 88)
Business Overview, Strength of Product Portfolio, Business Strategy Excellence, Recent Developments
10.1 Ecolab
10.2 Suez
10.3 Kemira
10.4 Kurita Water Industries
10.5 Solenis
10.6 Arkema
10.7 BASF
10.8 Chemtreat
10.9 Thermax
10.10 Veolia Water Technologies
*Details Might Not Be Captured in Case of Unlisted Companies.
10.11 Other Key Players
10.11.1 Accepta Water Treatment
10.11.2 Aries Chemical
10.11.3 Akzo Nobel
10.11.4 Buckman Laboratories
10.11.5 BWA Water Additives UK
10.11.6 Chemfax Products
10.11.7 Chemtex Speciality
10.11.8 Dowdupont
10.11.9 Eastman
10.11.10 Feedwater
10.11.11 Guardian Chemicals
10.11.12 Henkel
10.11.13 Ion Exchange
10.11.14 Lenntech
10.11.15 Vasu Chemicals
11 Appendix (Page No. - 113)
11.1 Insights From Industry Experts
11.2 Discussion Guide
11.3 Knowledge Store: Marketsandmarkets Subscription Portal
11.4 Introducing RT: Real-Time Market Intelligence
11.5 Available Customizations
11.6 Related Reports
11.7 Author Details
List of Tables (75 Tables)
Table 1 Boiler Water Treatment Chemicals Market Size, By Type, 2015–2022 (USD Million)
Table 2 Boiler Water Treatment Chemical Market Size, By Type, 2015–2022 (Kiloton)
Table 3 Boiler Water Treatment Chemicals Market Size, By End-Use Industry, 2015–2022 (USD Million)
Table 4 Boiler Water Treatment Chemical Market Size, By End-Use Industry, 2015–2022 (Kiloton)
Table 5 Boiler Water Treatment Chemicals Market Size, By Region, 2015–2022 (USD Million)
Table 6 Boiler Water Treatment Chemical Market Size, By Region, 2015–2022 (Kiloton)
Table 7 APAC: Market Size, By Country, 2015–2022 (USD Million)
Table 8 APAC: Market Size, By Country, 2015–2022 (Kiloton)
Table 9 APAC: Market Size, By End-Use Industry, 2015–2022 (USD Million)
Table 10 APAC: Market Size, By End-Use Industry, 2015–2022 (Kiloton)
Table 11 Macroeconomic Factors of Key APAC Countries
Table 12 China: Market Size, By End-Use Industry, 2015–2022 (USD Million)
Table 13 China: Market Size, By End-Use Industry, 2015–2022 (Kiloton)
Table 14 India: Market Size, By End-Use Industry, 2015–2022 (USD Million)
Table 15 India: Market Size, By End-Use Industry, 2015–2022 (Kiloton)
Table 16 Japan: Market Size, By End-Use Industry, 2015–2022 (USD Million)
Table 17 Japan: Market Size, By End-Use Industry, 2015–2022 (Kiloton)
Table 18 South Korea: Market Size, By End-Use Industry, 2015–2022 (USD Million)
Table 19 South Korea: Market Size, By End-Use Industry, 2015–2022 (Kiloton)
Table 20 Rest of APAC: Market Size, By End-Use Industry, 2015–2022 (USD Million)
Table 21 Rest of APAC: Market Size, By End-Use Industry, 2015–2022 (Kiloton)
Table 22 North America: By Market Size, By Country, 2015–2022 (USD Million)
Table 23 North America: Market Size, By Country, 2015–2022 (Kiloton)
Table 24 North America: Market Size, By End-Use Industry, 2015–2022 (USD Million)
Table 25 North America: Market Size, By End-Use Industry, 2015–2022 (Kiloton)
Table 26 Macroeconomic Factors in Key North American Countries
Table 27 U.S.: Market Size, By End-Use Industry, 2015–2022 (USD Million)
Table 28 U.S.: Market Size, By End-Use Industry, 2015–2022 (Kiloton)
Table 29 Canada: Market Size, By End-Use Industry, 2015–2022 (USD Million)
Table 30 Canada: Market Size, By End-Use Industry, 2015–2022 (Kiloton)
Table 31 Mexico: Market Size, By End-Use Industry, 2015–2022 (USD Million)
Table 32 Mexico: Market Size, By End-Use Industry, 2015–2022 (Kiloton)
Table 33 Europe: Market Size, By Country, 2015–2022 (USD Million)
Table 34 Europe: Market Size, By Country, 2015–2022 (Kiloton)
Table 35 Europe: Market Size, By End-Use Industry, 2015–2022 (USD Million)
Table 36 Europe: Market Size, By End-Use Industry, 2015–2022 (Kiloton)
Table 37 Macroeconomic Factors in Key European Countries
Table 38 Germany: Market Size, By End-Use Industry, 2015–2022 (USD Million)
Table 39 Germany: Market Size, By End-Use Industry, 2015–2022 (Kiloton)
Table 40 U.K.: Market Size, By End-Use Industry, 2015–2022 (USD Million)
Table 41 U.K.: Market Size, By End-Use Industry, 2015–2022 (Kiloton)
Table 42 France: Market Size, By End-Use Industry, 2015–2022 (USD Million)
Table 43 France: Market Size, By End-Use Industry, 2015–2022 (Kiloton)
Table 44 Italy: Market Size, By End-Use Industry, 2015–2022 (USD Million)
Table 45 Italy: Market Size, By End-Use Industry, 2015–2022 (Kiloton)
Table 46 Rest of Europe: Market Size, By End-Use Industry, 2015–2022 (USD Million)
Table 47 Rest of Europe: Market Size, By End-Use Industry, 2015–2022 (Kiloton)
Table 48 Middle East & Africa: Market Size, By Country, 2015–2022 (USD Million)
Table 49 Middle East & Africa: Market Size, By Country, 2015–2022 (Kiloton)
Table 50 Middle East & Africa: Market Size, By End-Use Industry, 2015–2022 (USD Million)
Table 51 Middle East & Africa: Market Size, By End-Use Industry, 2015–2022 (Kiloton)
Table 52 Macroeconomic Factors in Key Middle East & Africa Countries
Table 53 Saudi Arabia: Market Size, By End-Use Industry, 2015–2022 (USD Million)
Table 54 Saudi Arabia: Market Size, By End-Use Industry, 2015–2022 (Kiloton)
Table 55 South Africa: Market Size, By End-Use Industry, 2015–2022 (USD Million)
Table 56 South Africa: Market Size, By End-Use Industry, 2015–2022 (Kiloton)
Table 57 UAE: Market Size, By End-Use Industry, 2015–2022 (USD Million)
Table 58 UAE: Market Size, By End-Use Industry, 2015–2022 (Kiloton)
Table 59 Rest of Middle East & Africa: Market Size, By End-Use Industry, 2015–2022 (USD Million)
Table 60 Rest of Middle East & Africa: Market Size, By End-Use Industry, 2015–2022 (Kiloton)
Table 61 South America: Market Size, By Country, 2015–2022 (USD Million)
Table 62 South America: Market Size, By Country, 2015–2022 (Kiloton)
Table 63 South America: Market Size, By End-Use Industry, 2015–2022 (USD Million)
Table 64 South America: Market Size, By End-Use Industry, 2015–2022 (Kiloton)
Table 65 Macroeconomic Factors in Key South American Countries
Table 66 Brazil: Market Size, By End-Use Industry, 2015–2022 (USD Million)
Table 67 Brazil: Market Size, By End-Use Industry, 2015–2022 (Kiloton)
Table 68 Argentina: Market Size, By End-Use Industry, 2015–2022 (USD Million)
Table 69 Argentina: Market Size, By End-Use Industry, 2015–2022 (Kiloton)
Table 70 Rest of South America: Market Size, By End-Use Industry, 2015–2022 (USD Million)
Table 71 Rest of South America: Market Size, By End-Use Industry, 2015–2022 (Kiloton)
Table 72 Mergers, Joint Ventures & Acquisitions, 2015–2017
Table 73 Investments & Expansions, 2015–2017
Table 74 New Product Launches, 2015–2017
Table 75 Agreements, 2015–2017
List of Figures (36 Figures)
Figure 1 Boiler Water Treatment Chemicals Market: Market Segmentation
Figure 2 BWTC Market: Research Methodology
Figure 3 Market Size Estimation: Bottom-Up Approach
Figure 4 Market Size Estimation: Top-Down Approach
Figure 5 BWTC Market: Data Triangulation
Figure 6 Power to Be the Largest End-Use Industry Between 2017 and 2022
Figure 7 Corrosion Inhibitors to Lead BWTC Market Between 2017–2022
Figure 8 APAC to Be the Fastest-Growing Market During the Forecast Period
Figure 9 Attractive Growth Opportunities in BWTC Market Between 2017 and 2022
Figure 10 Scale Inhibitors Accounted for the Largest Market Share in 2016
Figure 11 APAC Accounted for the Largest Market Share in 2016
Figure 12 Power End-Use Industry to Lead BWTC Market Between 2017 and 2022
Figure 13 Power Was the Largest End-Use Industry of BWTC Market in 2016
Figure 14 Drivers, Restraints, Opportunities, and Challenges in BWTC Market
Figure 15 Porter’s Five Forces Analysis
Figure 16 Corrosion Inhibitors to Be the Fastest-Growing Type During the Forecast Period
Figure 17 Power to Be the Largest End-Use Industry During Forecast the Period
Figure 18 China to Register the Highest CAGR in BWTC Market Between 2017 and 2022
Figure 19 Power is the Largest End-Use Industry of BWTC in APAC
Figure 20 Power to Be Largest Consumer of BWTC in North America
Figure 21 South Africa to Be Fastest-Growing BWTC Market in Middle East & Africa
Figure 22 Companies Adopted Mergers, Joint Ventures & Acquisitions as the Key Growth Strategy Between 2015 and 2017
Figure 23 Ranking of BWTC Manufacturers, 2016
Figure 24 Maximum Number of Developments Witnessed in 2015
Figure 25 Ecolab: Company Snapshot
Figure 26 Ecolab: SWOT Analysis
Figure 27 Suez: Company Snapshot
Figure 28 Suez: SWOT Analysis
Figure 29 Kemira: Company Snapshot
Figure 30 Kemira: SWOT Analysis
Figure 31 Kurita Water Industries: Company Snapshot
Figure 32 Kurita Water Industries: SWOT Analysis
Figure 33 Arkema: Company Snapshot
Figure 34 BASF: Company Snapshot
Figure 35 Thermax: Company Snapshot
Figure 36 Veolia Water Technologies: Company Snapshot


Growth opportunities and latent adjacency in Boiler Water Treatment Chemicals Market