Borescope Market by Type (Video, Flexible, Endoscope, Semi-rigid, Rigid), Diameter (0 mm to 3 mm, 3 mm to 6 mm, 6 mm to 10 mm, Above 10 mm), Angle (0� to 90�, 90� to 180�, 180� to 360�), Industry, and Region - Global Forecast to 2024-2036


Borescope Market Summary
The global Borescope Market is experiencing steady growth as industries increasingly prioritize non-destructive testing (NDT), predictive maintenance, quality assurance, and equipment reliability. Valued at approximately USD 1.1 billion in 2025, the market is projected to reach nearly USD 2.9 billion by 2036, expanding at a CAGR of 9.2% during 2025–2036. Borescopes have become indispensable inspection tools across aerospace, automotive, power generation, oil & gas, manufacturing, and defense sectors, enabling technicians to visually inspect inaccessible or confined spaces without disassembling equipment.
The growing integration of Artificial Intelligence (AI), Industrial Internet of Things (IIoT), cloud-based inspection platforms, robotics, and industrial automation technologies is transforming the borescope industry. Advanced video borescopes equipped with AI-assisted defect detection, image enhancement capabilities, and real-time data sharing functionalities are improving inspection efficiency and accuracy. As industries continue their digital transformation journeys and focus on minimizing downtime, reducing maintenance costs, and extending asset lifecycles, demand for sophisticated borescope solutions is expected to rise significantly through 2036.
Key Market Trends & Insights
- North America remains the leading regional market due to strong aerospace and industrial inspection activities.
- Asia Pacific is projected to witness the fastest growth driven by manufacturing expansion and infrastructure development.
- Video borescopes dominate the market owing to superior imaging and digital inspection capabilities.
- AI-powered defect recognition is emerging as a key technological trend.
- Cloud-connected inspection systems are improving remote collaboration and reporting.
- Predictive maintenance initiatives are increasing borescope adoption across industries.
Market Size & Forecast
- Base Year Market Size (2025): USD 1.1 Billion
- Forecast Market Value (2036): USD 2.9 Billion
- CAGR (2025–2036): 9.2%
- Growth Factors: Increasing NDT requirements, expansion of industrial automation, growing adoption of predictive maintenance, advancements in imaging technology, and rising infrastructure investments.
Borescope Market Top 10 key takeaway
- Borescopes play a critical role in non-destructive inspection and maintenance operations.
- Video borescopes remain the dominant product segment.
- Aerospace applications generate significant market demand.
- AI-assisted defect detection is enhancing inspection accuracy.
- Industrial automation is creating new growth opportunities.
- Asia Pacific is expected to achieve the fastest growth rate.
- Predictive maintenance strategies are accelerating adoption.
- High-definition imaging technologies are improving inspection quality.
- Cloud-based inspection reporting is gaining popularity.
- Energy and power sectors remain key end-users.
Product Insights
Video borescopes currently account for the largest share of the Borescope Market. Their ability to provide real-time visual inspection, high-resolution imaging, image recording, and digital reporting capabilities has made them the preferred choice across multiple industries. Unlike traditional optical borescopes, video borescopes offer enhanced flexibility, improved image quality, and easier documentation of inspection findings.
The dominance of video borescopes is particularly evident in aerospace and industrial maintenance applications. Aircraft engine inspections, turbine assessments, pipeline evaluations, and manufacturing quality control processes increasingly rely on advanced video borescopes to improve operational efficiency and inspection accuracy. High-definition displays and enhanced maneuverability further contribute to their widespread adoption.
Flexible borescopes represent another significant product category. These devices enable inspection of complex geometries and hard-to-reach areas, making them suitable for automotive engines, industrial machinery, and energy infrastructure. Rigid borescopes continue to serve specialized applications where straight-line inspection paths are required.
Emerging product categories include robotic borescopes, wireless inspection systems, AI-enabled video borescopes, and 3D imaging inspection devices. Manufacturers are focusing on developing compact, lightweight, and intelligent inspection tools capable of delivering enhanced visualization and automated defect analysis.
The integration of artificial intelligence into borescope systems is creating new opportunities for automated defect recognition, image classification, and predictive maintenance applications. These innovations are expected to significantly enhance inspection efficiency throughout the forecast period.
Inspection Technology and Component Insights
The Borescope Market is driven by advancements in digital imaging, fiber optics, camera miniaturization, artificial intelligence, cloud connectivity, and robotics technologies. High-definition imaging systems have become a cornerstone of modern borescope solutions, enabling inspectors to identify defects with greater accuracy and confidence.
CMOS and CCD camera technologies continue to evolve, delivering improved image clarity, low-light performance, and enhanced color reproduction. These advancements are particularly important for inspections conducted within engines, turbines, pipelines, and industrial machinery where visibility is often limited.
Artificial intelligence is increasingly being integrated into borescope inspection workflows. AI-powered image analysis systems can automatically detect cracks, corrosion, wear patterns, foreign object damage, and other anomalies. By reducing human error and accelerating inspection processes, AI technologies improve overall maintenance efficiency.
The Industrial Internet of Things (IIoT) is also reshaping the market landscape. Connected borescope systems can transmit inspection data in real time to centralized monitoring platforms, enabling remote diagnostics and collaborative decision-making. Cloud-based storage and analytics further support asset management and predictive maintenance programs.
Automation technologies are creating additional opportunities. Robotic inspection systems equipped with borescopes can access hazardous or difficult-to-reach environments, reducing risks for personnel while improving inspection coverage. Future innovations are expected to focus on augmented reality-assisted inspections, digital twins, AI-powered analytics, and autonomous inspection platforms.
Application Insights
The aerospace sector remains the largest application segment within the Borescope Market. Aircraft engines, turbines, landing gear assemblies, and structural components require regular inspections to ensure operational safety and regulatory compliance. Borescopes enable maintenance teams to inspect internal components without extensive disassembly, reducing maintenance costs and downtime.
Power generation represents another significant application area. Gas turbines, steam turbines, boilers, generators, and associated equipment require routine inspections to maintain efficiency and prevent failures. Borescopes provide valuable insights into equipment condition, supporting predictive maintenance initiatives.
The automotive industry is increasingly adopting borescopes for engine diagnostics, manufacturing quality control, and component inspections. Vehicle manufacturers utilize advanced inspection systems to enhance product quality and improve production efficiency.
Oil & gas applications continue to expand due to the industry's focus on equipment reliability and operational safety. Borescopes are widely used for pipeline inspections, refinery maintenance, offshore platform evaluations, and storage tank assessments.
Future growth opportunities are expected to emerge from renewable energy projects, rail transportation, defense systems, marine applications, and advanced manufacturing facilities where equipment reliability remains a top priority.
Regional Insights
North America currently leads the global Borescope Market due to strong aerospace activity, advanced industrial infrastructure, and widespread adoption of predictive maintenance technologies. The region's focus on asset reliability, operational safety, and digital transformation continues to support market expansion. The United States remains the largest contributor, driven by aerospace, defense, energy, and manufacturing sectors.
Europe represents a mature market characterized by strong industrial automation adoption and rigorous quality assurance standards. Germany, France, and the United Kingdom continue to invest heavily in advanced inspection technologies across manufacturing, aerospace, automotive, and energy industries.
Asia Pacific is expected to register the highest growth rate throughout the forecast period. Rapid industrialization, infrastructure development, manufacturing expansion, and increasing investments in aviation and energy sectors are creating substantial demand for borescope solutions. China, Japan, India, and South Korea are emerging as key growth markets.
Latin America and the Middle East & Africa are gradually increasing adoption of borescopes, particularly in oil & gas, mining, power generation, and infrastructure maintenance applications.
Regional Insights Summary
- North America leads global market revenue.
- Asia Pacific records the fastest forecast growth.
- Europe benefits from strong industrial automation investments.
- Aerospace remains a major regional demand driver.
- Predictive maintenance initiatives support adoption worldwide.
Country-Specific Market Trends
The United States remains the largest national market and is projected to grow at a CAGR of approximately 8.8% through 2036. Strong aerospace manufacturing, defense spending, and industrial maintenance requirements continue to drive demand for advanced borescope systems.
Canada is witnessing increased adoption of borescopes across energy, mining, and aviation sectors. Infrastructure modernization and asset reliability programs are supporting market growth.
Mexico is expanding its industrial inspection capabilities as manufacturing investments increase. Automotive production facilities increasingly utilize borescope technologies for quality assurance and maintenance applications.
China is expected to achieve a CAGR exceeding 10.5% through 2036. Rapid industrial expansion, growing aviation activities, and increasing investments in manufacturing automation are fueling demand for advanced inspection technologies.
Japan remains a leader in precision manufacturing and industrial automation. Companies continue to adopt advanced borescope solutions to improve quality control and equipment maintenance processes.
Germany plays a pivotal role in Europe's industrial inspection market. The country's strong automotive, aerospace, and manufacturing sectors continue to invest in advanced NDT and predictive maintenance technologies.
France is experiencing growing adoption of borescopes across aerospace, transportation, and energy industries. Government-supported infrastructure modernization programs are further contributing to market expansion.
Country-Level Insights Summary
- China demonstrates the highest forecast growth potential.
- The United States remains the largest market globally.
- Germany leads European industrial inspection adoption.
- Japan focuses on precision manufacturing applications.
- Canada benefits from energy and mining sector investments.
Key Borescope Market Company Insights
The Borescope Market is highly competitive, with leading manufacturers focusing on technological innovation, AI integration, imaging enhancements, and strategic partnerships. Companies continue to invest in advanced camera systems, cloud-based inspection platforms, and intelligent analytics capabilities to strengthen their market positions.
Major market participants include Olympus Corporation, Baker Hughes Company, Evident Corporation, GE Aerospace Inspection Technologies, SKF Group, Karl Storz SE & Co. KG, ViZaar Industrial Imaging AG, Mitcorp, Teslong, and Yateks Co., Ltd.
These organizations are increasingly developing AI-assisted inspection solutions that automate defect detection and streamline maintenance workflows. Integration of cloud connectivity, high-definition imaging, and remote collaboration tools remains a key strategic focus across the industry.
Company Strategy Highlights
- Development of AI-powered defect recognition technologies.
- Expansion of high-definition video borescope portfolios.
- Investment in cloud-connected inspection platforms.
- Strategic partnerships with aerospace and industrial operators.
- Focus on predictive maintenance and digital inspection solutions.
Recent Developments
In 2025, several leading inspection technology providers introduced next-generation video borescopes featuring AI-powered defect detection capabilities capable of automatically identifying cracks, corrosion, and surface wear during inspections.
Major aerospace maintenance organizations partnered with inspection technology vendors to implement cloud-connected borescope platforms that enable real-time remote collaboration and digital reporting across maintenance operations.
Several manufacturers launched compact robotic borescope systems designed for hazardous industrial environments, improving inspection accessibility while reducing personnel exposure to operational risks.
Market Segmentation
The Borescope Market is segmented by product, technology, application, and region. By product, the market includes video borescopes, flexible borescopes, rigid borescopes, and robotic inspection systems. Video borescopes account for the largest market share due to their superior imaging capabilities and digital functionality.
Based on technology and components, the market encompasses fiber optic imaging systems, CMOS cameras, CCD cameras, AI-powered inspection software, cloud connectivity solutions, and robotic inspection platforms. Digital imaging technologies continue to dominate due to increasing demand for high-resolution inspection capabilities.
By application, the market serves aerospace, automotive, power generation, oil & gas, manufacturing, defense, transportation, and marine industries. Aerospace remains the largest application segment owing to stringent safety and maintenance requirements.
Regionally, the market is categorized into North America, Europe, Asia Pacific, Latin America, and the Middle East & Africa. North America currently leads global revenue generation, while Asia Pacific is expected to achieve the highest growth through 2036.
Segmentation Highlights
- Video borescopes dominate product demand.
- Digital imaging technologies lead market adoption.
- Aerospace remains the largest application sector.
- North America generates the highest revenue share.
- Asia Pacific offers the strongest growth opportunities.
Conclusion
The global Borescope Market is positioned for strong and sustained growth through 2036, driven by increasing adoption of non-destructive testing, predictive maintenance strategies, and digital inspection technologies. As industries prioritize operational efficiency, asset reliability, and safety compliance, borescopes are becoming indispensable tools for maintenance and quality assurance activities.
The integration of artificial intelligence, IoT connectivity, cloud-based analytics, and automation technologies will continue to reshape the inspection landscape. Future innovations in robotic inspection systems, autonomous defect detection, augmented reality-assisted maintenance, and digital twin integration are expected to unlock significant opportunities across multiple industries. Organizations that invest in advanced inspection technologies will be better positioned to improve productivity, reduce downtime, and enhance operational performance in an increasingly competitive environment.
FAQs
1. What is the current size of the Borescope Market?
The global Borescope Market was valued at approximately USD 1.1 billion in 2025.
2. What is the expected growth rate of the Borescope Market?
The market is projected to grow at a CAGR of 9.2% during 2025–2036.
3. What are the key drivers of market growth?
Major growth drivers include increasing adoption of non-destructive testing, predictive maintenance initiatives, industrial automation, AI-powered inspection technologies, and growing infrastructure investments.
4. Which region leads the Borescope Market?
North America currently leads the market due to strong aerospace, industrial maintenance, and predictive maintenance activities.
5. Who are the key companies operating in the Borescope Market?
Major companies include Olympus Corporation, Baker Hughes Company, Evident Corporation, GE Aerospace Inspection Technologies, SKF Group, Karl Storz SE & Co. KG, ViZaar Industrial Imaging AG, Mitcorp, Teslong, and Yateks Co., Ltd.
 Exclusive indicates content/data unique to MarketsandMarkets and not available with any competitors.
Table of Contents
1 Introduction (Page No. - 15)
1.1 Study Objectives
1.2 Definition
1.3 Study Scope
1.3.1 Markets Covered
1.3.2 Years Considered
1.4 Currency
1.5 Limitations
1.6 Market Stakeholders
2 Research Methodology (Page No. - 18)
2.1 Introduction
2.1.1 Secondary Data
2.1.1.1 List of Major Secondary Sources
2.1.1.2 Key Data From Secondary Sources
2.1.2 Primary Data
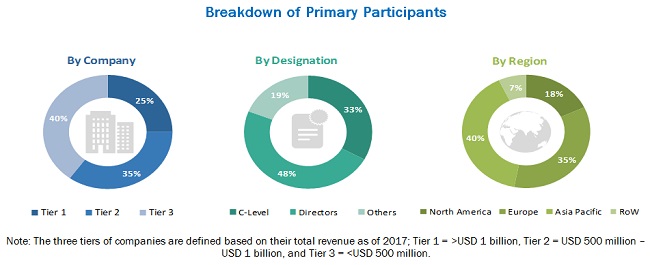
2.1.2.1 Breakdown of Primaries
2.1.2.2 Key Data From Primary Sources
2.1.3 Secondary and Primary Research
2.1.3.1 Key Industry Insights
2.2 Market Size Estimation
2.2.1 Bottom-Up Approach
2.2.1.1 Approach for Arriving at Market Size Using Bottom-Up Analysis
2.2.2 Top-Down Approach
2.2.2.1 Approach for Arriving at Market Size Using Bottom-Up Analysis
2.3 Market Breakdown and Data Triangulation
2.4 Research Assumptions
3 Executive Summary (Page No. - 27)
4 Premium Insights (Page No. - 31)
4.1 Market, 2019–2024 (USD Million)
4.2 Market, By Type
4.3 Market, By Diameter
4.4 Market, By Angle
4.5 Market, By Industry and Region
4.6 Market, By Geography
5 Market Overview (Page No. - 35)
5.1 Introduction
5.2 Market Dynamics
5.2.1 Drivers
5.2.1.1 High Operational Productivity
5.2.1.2 Power Generation Plant Maintenance
5.2.2 Restraints
5.2.2.1 Development of Substitute Technology
5.2.3 Opportunities
5.2.3.1 Large Scale Development of Infrastructure
5.2.3.2 Emergence of Electric Vehicles
5.2.4 Challenges
5.2.4.1 Increasing Training Cost Due to Lack of Skilled Workforce
5.3 Value Chain Analysis
6 Borescope Market, By Type (Page No. - 39)
6.1 Introduction
6.2 Video Borescopes
6.2.1 Video Borescopes to Lead Market During Forecast Period
6.3 Flexible Borescopes
6.3.1 Market for Flexible Borescopes With Diameters Ranging From 3mm to 6mm to Hold Largest Size During Forecast Period
6.4 Endoscopes
6.4.1 Market for Endoscopes With Diameters Ranging From 3mm to 6mm to Grow at Highest Rate During Forecast Period
6.5 Semi-Rigid Borescopes
6.5.1 Semi-Rigid Borescopes With Diameters Ranging From 0 mm to 3 mm to Hold Second-Largest Share During Forecast Period
6.6 Rigid Borescopes
6.6.1 High Resolution and Easy Operation of Rigid Borescopes Makes Them Popular Type of Borescopes
7 Borescope Market, By Diameter (Page No. - 59)
7.1 Introduction
7.2 Borescopes With Diameters Ranging From 0 mm to 3 mm
7.2.1 Market for Video Borescopes With Diameters Ranging From 0 mm to 3 mm to Hold Largest Size During Forecast Period
7.3 Borescopes With Diameters Ranging From 3 mm to 6 mm
7.3.1 Market for Borescopes With Diameters Ranging From 3 mm to 6 mm Held Largest Size of Overall Market in 2018
7.4 Borescopes With Diameters Ranging From 6 mm to 10 mm
7.4.1 Market for Video Borescopes With Diameters Ranging From 6 mm to 10 mm to Grow at Highest CAGR From 2019 to 2024
7.5 Borescopes With Diameters Above 10 mm
7.5.1 Market for Flexible Borescopes With Diameters Above 10 mm to Grow at Highest CAGR During Forecast Period
8 Borescope Market, By Angle (Page No. - 66)
8.1 Introduction
8.2 0° to 90°
8.2.1 Borescopes With Viewing Angles 0° to 90° to Hold Largest Market Share During Forecast Period
8.3 90° to 180°
8.3.1 Borescopes With Viewing Angles 90° to 180° Offer Flexibility
8.4 180° to 360°
8.4.1 Borescopes With Viewing Angles 180° to 360° Articulate in All Directions
9 Borescope Market, By Industry (Page No. - 70)
9.1 Introduction
9.2 Automotive
9.2.1 Adoption of Video Borescopes for Regular Automotive Maintenance
9.3 Aviation
9.3.1 Use of Borescopes for Inspecting Engines, Brakes, and Wings of Aircraft
9.4 Power Generation
9.4.1 Implementation of Borescopes for Inspecting Corrosion, Erosion, Welding, and Other Defects in Power Equipment
9.5 Oil & Gas
9.5.1 Use of Borescopes for Inspection of Storage Tanks, Flares, Crude Units, and Many Other Components
9.6 Manufacturing
9.6.1 Borescopes Ensure Maximum Efficiency of Machinery During Production
9.7 Chemicals
9.7.1 Utilization of Borescopes for Inspecting Processing Equipment Such as Filters, Heat Exchangers, Pumps, and Mixers
9.8 Food & Beverages
9.8.1 Adoption of Borescopes for Testing Common Problems Related to Cleanliness and Contamination
9.9 Pharmaceuticals
9.9.1 Requirement of Borescopes for Non-Destructive Testing to Ensure Quality of Pipelines
9.10 Others
10 Geographic Analysis (Page No. - 85)
10.1 Introduction
10.2 North America
10.2.1 Us
10.2.1.1 US to Hold Largest Market Size of Market in North America During Forecast Period
10.2.2 Canada
10.2.2.1 Canada to Be Fastest-Growing Country in North American Market
10.2.3 Mexico
10.2.3.1 Mexican Market to Be Driven By Growing Food & Beverages and Automotive Industries
10.3 Europe
10.3.1 Germany
10.3.1.1 Increasing Vehicle Production to Drive Market in Germany
10.3.2 UK
10.3.2.1 Rising Demand for Renewable Energy to Create Demand for Borescopes in Uk
10.3.3 France
10.3.3.1 Growing Power and Aviation Industries to Boost Demand for Borescopes in France
10.3.4 Rest of Europe
10.3.4.1 Expanding Manufacturing Capabilities in Rest of European Countries to Create Demand for Borescopes
10.4 APAC
10.4.1 China
10.4.1.1 China to Be Leading and Fastest-Growing Market in APAC
10.4.2 Japan
10.4.2.1 Increasing Growth in Automotive and Aviation Sectors to Boost Market for Non-Destructive Testing
10.4.3 India
10.4.3.1 Rising Fdi to Grow Industrial and Manufacturing Sectors of India
10.4.4 Rest of APAC
10.4.4.1 Growing Mining Industry in Australia to Drive Demand for Borescopes
10.5 RoW
10.5.1 South America
10.5.1.1 Leading Emerging Economies to Account for Largest Market Share of South America
10.5.2 Africa
10.5.2.1 Growing Transportation and Construction Sectors to Create Demand for Borescopes in Africa
10.5.3 Middle East
10.5.3.1 Rising Investments in Oil & Gas Sector to Drive Market in Middle East
11 Competitive Landscape (Page No. - 108)
11.1 Overview
11.2 Ranking of Players in Market
11.3 Competitive Leadership Mapping, 2019
11.3.1 Visionaries
11.3.2 Innovators
11.3.3 Dynamic Differentiators
11.3.4 Emerging Companies
11.4 Competitive Situations & Trends
11.4.1 Product Launches
11.4.2 Collaborations, Expansions, and Partnerships, 2017-2019
12 Company Profiles (Page No. - 115)
12.1 Key Players
12.1.1 Baker Hughes
12.1.1.1 Business Overview
12.1.1.2 Products Offered
12.1.1.3 SWOT Analysis
12.1.2 Flir
12.1.2.1 Business Overview
12.1.2.2 Products Offered
12.1.2.3 SWOT Analysis
12.1.3 Fluke
12.1.3.1 Business Overview
12.1.3.2 Product Offered
12.1.3.3 Recent Developments
12.1.3.4 SWOT Analysis
12.1.4 Olympus
12.1.4.1 Business Overview
12.1.4.2 Products Offered
12.1.4.3 Recent Developments
12.1.4.4 SWOT Analysis
12.1.5 SKF
12.1.5.1 Business Overview
12.1.5.2 Products Offered
12.1.5.3 Recent Developments
12.1.5.4 SWOT Analysis
12.1.6 Advance Inspection Technologies
12.1.6.1 Business Overview
12.1.6.2 Products Offered
12.1.7 Gradient Lens Corporation
12.1.7.1 Business Overview
12.1.7.2 Products Offered
12.1.8 Jme Technologies
12.1.8.1 Business Overview
12.1.8.2 Products Offered
12.1.9 Stanlay
12.1.9.1 Business Overview
12.1.9.2 Product Offered
12.1.10 Vizaar
12.1.10.1 Business Overview
12.1.10.2 Products Offered
12.1.10.3 Recent Developments
12.2 Other Key Players
12.2.1 Lenox
12.2.2 Moritex
12.2.3 Nexxis
12.2.4 PCE Instruments
12.2.5 RF Systems
12.2.6 SPI Engineering
12.2.7 Storz
12.2.8 Teslong
12.2.9 USA Borescope
12.2.10 Yateks
13 Appendix (Page No. - 136)
13.1 Insights of Industry Experts
13.2 Discussion Guide
13.3 Knowledge Store: Marketsandmarkets’ Subscription Portal
13.4 Available Customizations
13.5 Related Reports
13.6 Author Details
List of Tables (106 Tables)
Table 1 Market, By Type, 2016–2024 (USD Million)
Table 2 Market, By Diameter, 2016–2024 (USD Million)
Table 3 Video Borescope, By Angle, 2016–2024 (USD Million)
Table 4 Video Borescope, By Industry, 2016–2024 (USD Million)
Table 5 Video Borescope, By Region, 2016–2024 (USD Million)
Table 6 Video Borescope in North America, By Country, 2016–2024 (USD Million)
Table 7 Video Borescope in Europe, By Country, 2016–2024 (USD Million)
Table 8 Video Borescope in APAC, By Country, 2016–2024 (USD Million)
Table 9 Video Borescope in RoW, By Region, 2016–2024 (USD Million)
Table 10 Flexible Borescope, By Diameter, 2016–2024 (USD Million)
Table 11 Flexible Borescope, By Angle, 2016–2024 (USD Million)
Table 12 Flexible Borescope, By Industry, 2016–2024 (USD Million)
Table 13 Flexible Borescope, By Region, 2016–2024 (USD Million)
Table 14 Flexible Borescope in North America, By Country, 2016–2024 (USD Million)
Table 15 Flexible Borescope in Europe, By Country, 2016–2024 (USD Million)
Table 16 Flexible Borescope in APAC, By Country, 2016–2024 (USD Million)
Table 17 Flexible Borescope in RoW, By Region, 2016–2024 (USD Million)
Table 18 Endoscope Market, By Diameter, 2016–2024 (USD Million)
Table 19 Endoscope Market, By Angle, 2016–2024 (USD Million)
Table 20 Endoscope Market, By Industry, 2016–2024 (USD Million)
Table 21 Endoscope Market, By Region, 2016–2024 (USD Million)
Table 22 Endoscope Market in North America, By Country, 2016–2024 (USD Million)
Table 23 Endoscope Market in Europe, By Country, 2016–2024 (USD Million)
Table 24 Endoscope Market in APAC, By Country, 2016–2024 (USD Million)
Table 25 Endoscope Market in RoW, By Region, 2016–2024 (USD Million)
Table 26 Semi-Rigid Borescope, By Diameter, 2016–2024 (USD Million)
Table 27 Semi-Rigid Borescope, By Angle, 2016–2024 (USD Million)
Table 28 Semi-Rigid Borescope, By Industry, 2016–2024 (USD Million)
Table 29 Semi-Rigid Borescope, By Region, 2016–2024 (USD Million)
Table 30 Semi-Rigid Borescope in North America, By Country, 2016–2024 (USD Million)
Table 31 Semi-Rigid Borescope in Europe, By Country, 2016–2024 (USD Million)
Table 32 Semi-Rigid Borescope in APAC, By Country, 2016–2024 (USD Million)
Table 33 Semi-Rigid Borescope in RoW, By Region, 2016–2024 (USD Million)
Table 34 Rigid Borescope, By Diameter, 2016–2024 (USD Million)
Table 35 Rigid Borescope, By Angle, 2016–2024 (USD Million)
Table 36 Rigid Borescope, By Industry, 2016–2024 (USD Million)
Table 37 Rigid Borescope, By Region, 2016–2024 (USD Million)
Table 38 Rigid Borescope in North America, By Country, 2016–2024 (USD Million)
Table 39 Rigid Borescope in Europe, By Country, 2016–2024 (USD Million)
Table 40 Rigid Borescope in APAC, By Country, 2016–2024 (USD Million)
Table 41 Rigid Borescope in RoW, By Region, 2016–2024 (USD Million)
Table 42 Borescope, By Diameter, 2016–2024 (USD Million)
Table 43 Market for Borescopes With Diameters Ranging From 0 mm to 3 mm, By Type, 2016–2024 (USD Million)
Table 44 Market for Borescopes With Diameters Ranging From 0 mm to 3 mm, By Region, 2016–2024 (USD Million)
Table 45 Market for Borescopes With Diameters Ranging From 3 mm to 6 mm, By Type, 2016–2024 (USD Million)
Table 46 Market for Borescopes With Diameters Ranging From 3 mm to 6 mm, By Region, 2016–2024 (USD Million)
Table 47 Market for Borescopes With Diameters Ranging From 6 mm to 10 mm, By Type, 2016–2024 (USD Million)
Table 48 Market for Borescopes With Diameters Ranging From 6 mm to 10 mm, By Region, 2016–2024 (USD Million)
Table 49 Market for Borescopes With Diameters Above 10 mm, By Type, 2016–2024 (USD Million)
Table 50 Market for Borescopes With Diameters Above 10 mm, By Region, 2016–2024 (USD Million)
Table 51 Market, By Angle, 2016–2024 (USD Million)
Table 52 Market for 0° to 90°, By Type, 2016–2024 (USD Million)
Table 53 Market for 90° to 180°, By Type, 2016–2024 (USD Million)
Table 54 Market for 180° to 360°, By Type, 2016–2024 (USD Million)
Table 55 Market, By Industry, 2016–2024 (USD Million)
Table 56 Market for Automotive, By Type, 2016–2024 (USD Million)
Table 57 Market for Automotive, By Region, 2016–2024 (USD Million)
Table 58 Market for Aviation, By Type, 2016–2024 (USD Million)
Table 59 Market for Aviation, By Region, 2016–2024 (USD Million)
Table 60 Market for Power Generation, By Type, 2016–2024 (USD Million)
Table 61 Market for Power Generation, By Region, 2016–2024 (USD Million)
Table 62 Market for Oil & Gas, By Type, 2016–2024 (USD Million)
Table 63 Market for Oil & Gas, By Region, 2016–2024 (USD Million)
Table 64 Market for Manufacturing, By Type, 2016–2024 (USD Million)
Table 65 Market for Manufacturing, By Region, 2016–2024 (USD Million)
Table 66 Market for Chemicals, By Type, 2016–2024 (USD Million)
Table 67 Market for Chemicals, By Region, 2016–2024 (USD Million)
Table 68 Market for Food & Beverages, By Type, 2016–2024 (USD Million)
Table 69 Market for Food & Beverages, By Region, 2016–2024 (USD Million)
Table 70 Market for Pharmaceuticals, By Type, 2016–2024 (USD Million)
Table 71 Market for Pharmaceuticals, By Region, 2016–2024 (USD Million)
Table 72 Market for Other Industries, By Type, 2016–2024 (USD Million)
Table 73 Market for Other Industries, By Region, 2016–2024 (USD Million)
Table 74 Market, By Region, 2016–2024 (USD Million)
Table 75 Market in North America, By Country, 2016–2024 (USD Million)
Table 76 Market in North America, By Type, 2016–2024 (USD Million)
Table 77 Market in US, By Type, 2016–2024 (USD Million)
Table 78 Market in Canada, By Type, 2016–2024 (USD Million)
Table 79 Market in Mexico, By Type, 2016–2024 (USD Million)
Table 80 Market in North America, By Diameter, 2016–2024 (USD Million)
Table 81 Market in North America, By Industry, 2016–2024 (USD Million)
Table 82 Market in Europe, By Country, 2016–2024 (USD Million)
Table 83 Market in Europe, By Type, 2016–2024 (USD Million)
Table 84 Market in Germany, By Type, 2016–2024 (USD Million)
Table 85 Market in UK, By Type, 2016–2024 (USD Million)
Table 86 Market in France, By Type, 2016–2024 (USD Million)
Table 87 Market in Rest of Europe, By Type, 2016–2024 (USD Million)
Table 88 Market in Europe, By Diameter, 2016–2024 (USD Million)
Table 89 Market in Europe, By Industry, 2016–2024 (USD Million)
Table 90 Market in APAC, By Country, 2016–2024 (USD Million)
Table 91 Market in APAC, By Type, 2016–2024 (USD Million)
Table 92 Market in China, By Type, 2016–2024 (USD Million)
Table 93 Market in Japan, By Type, 2016–2024 (USD Million)
Table 94 Market in India, By Type, 2016–2024 (USD Million)
Table 95 Market in Rest of APAC, By Type, 2016–2024 (USD Million)
Table 96 Market in APAC, By Diameter, 2016–2024 (USD Million)
Table 97 Market in APAC, By Industry, 2016–2024 (USD Million)
Table 98 Market in RoW, By Region, 2016–2024 (USD Million)
Table 99 Market in RoW, By Type, 2016–2024 (USD Million)
Table 100 Market in South America, By Type, 2016–2024 (USD Million)
Table 101 Market in Middle East, By Type, 2016–2024 (USD Million)
Table 102 Market in Africa, By Type, 2016–2024 (USD Million)
Table 103 Market in RoW, By Diameter, 2016–2024 (USD Million)
Table 104 Market in RoW, By Industry, 2016–2024 (USD Million)
Table 105 Product Launches, 2017–2019
Table 106 Collaborations, Expansions, and Partnerships, 2017–2019
List of Figures (50 Figures)
Figure 1 Market: Research Design
Figure 2 Market Size Estimation Methodology: Bottom-Up Approach
Figure 3 Market Size Estimation Methodology: Top-Down Approach
Figure 4 Market Breakdown and Data Triangulation
Figure 5 Assumption for Research Study
Figure 6 Borescope Market Segmentation
Figure 7 Video Borescopes Accounted for Largest Share of Market in 2018
Figure 8 Borescopes With Diameters Ranging From 3 mm to 6 mm Accounted for Largest Share of Overall Market in 2018
Figure 9 Borescopes With Angles Ranging From 0° to 90° Held Largest Share of Overall Market in 2018
Figure 10 Automotive to Register Highest CAGR Market During Forecast Period
Figure 11 APAC to Witness Highest CAGR in Market During Forecast Period
Figure 12 Growing Demand for Machinery Inspection to Boost Market
Figure 13 Video Borescopes to Account for Largest Size of Market From 2019 to 2024
Figure 14 Borescopes With Diameters Ranging From 3 mm to 6 mm to Hold Largest Market Size From 2019 to 2024
Figure 15 Borescopes With Angles Ranging From 0° to 90° to Hold Largest Size of Overall Market From 2019 to 2024
Figure 16 Automotive and North America Were Largest Shareholders of Market in 2018
Figure 17 US to Hold Largest Share of Market By 2019
Figure 18 DROC: Borescope Market, 2019
Figure 19 Value Chain Analysis: Market
Figure 20 Borescope Market, By Type
Figure 21 Automotive Industry to Hold Largest Size of Video Market During Forecast Period
Figure 22 Flexible Market for Automotive Industry to Grow at Highest CAGR During Forecast Period
Figure 23 Endoscope Market for Automotive to Hold Largest Size During Forecast Period
Figure 24 Semi-Rigid Market for Automotive to Hold Largest Market Size During Forecast Period
Figure 25 Rigid Market for Automotive to Hold Largest Market Size During Forecast Period
Figure 26 Market Segmentation, By Diameter
Figure 27 Video Borescopes With Diameters Ranging From 3 mm to 6 mm to Hold Largest Market Size From 2019 to 2024
Figure 28 Video Borescopes With Diameters Above 10 mm to Hold Largest Market Size From 2019 to 2024
Figure 29 Market Segmentation, By Angle
Figure 30 Market, By Industry
Figure 31 Video Borescopes to Hold Largest Market Size of Automotive Industry From 2019 to 2024
Figure 32 Video Borescopes to Hold Largest Market Size F Power Generation Industry From 2019 to 2024
Figure 33 Video Borescopes to Hold Largest Market Size From 2019 to 2024
Figure 34 Video Borescopes to Hold Largest Market Size of Pharmaceuticals Industry From 2019 to 2024
Figure 35 China to Register Highest CAGR in Overall Market During Forecast Period
Figure 36 North America: Market Snapshot
Figure 37 Video Borescopes to Lead Mexican Market During Forecast Period
Figure 38 Europe: Borescope Market Snapshot
Figure 39 Market for Video Borescopes to Grow at Highest CAGR in France During Forecast Period
Figure 40 APAC: Market Snapshot
Figure 41 Automotive Industry to Account for Largest Size of Market in APAC During Forecast Period
Figure 42 RoW: Borescope Market Snapshot
Figure 43 Product Launches Emerged as A Key Growth Strategy Adopted By Players in Market From 2017 to 2019
Figure 44 Ranking of Top 5 Players in Market, 2018
Figure 45 Borescope Market (Global) Competitive Leadership Mapping, 2018
Figure 46 Product Launches Was the Key Strategy Adopted From 2017 to 2019
Figure 47 Baker Hughes: Company Snapshot
Figure 48 Flir: Company Snapshot
Figure 49 Olympus: Company Snapshot
Figure 50 SKF: Company Snapshot
The study involves major activities for estimating the current size of the borescope market. Exhaustive secondary research was carried out to collect information on the market. The next step involved the validation of these findings, assumptions, and sizing with industry experts, identified in the value chain, through primary research. Both top-down and bottom-up approaches were employed to estimate the overall market size. After that, market breakdown and data triangulation were used to estimate the market size of segments and subsegments.
Secondary Research
In the secondary research process, various secondary sources have been referred to for identifying and collecting information important for this study. Secondary sources such as encyclopedias, directories, and databases [American Society of NDT, British Institute of NDT, Investor Presentations, OneSource, and Factiva] have been used to identify and collect information for an extensive technical and commercial study of the borescope market.
Primary Research
In the primary research process, various primary sources from both supply and demand sides have been interviewed to obtain qualitative and quantitative information important for this report. Primary sources, such as experts from related industries and suppliers, have been interviewed to obtain and verify critical information as well as to assess prospects. Key players in the borescope market have been identified through secondary research, and their respective market rankings have been determined through primary and secondary research. This research includes the study of annual reports of the top market players and interviews with key opinion leaders, such as CEOs, directors, and marketing personnel.
To know about the assumptions considered for the study, download the pdf brochure
Market Size Estimation
In the complete market engineering process, both top-down and bottom-up approaches have been implemented, along with several data triangulation methods, to estimate and validate the size of the borescope market and other dependent submarkets listed in this report.
- The key players in the industry and markets have been identified through extensive secondary research.
- The industry’s supply chain and market size, in terms of value, have been determined through primary and secondary research processes.
All percentage shares, splits, and breakdowns have been determined using secondary sources and verified through primary sources.
Data Triangulation
After arriving at the overall market size through the estimation process, the total market has been split into several segments. To complete the overall market engineering process and arrive at the exact statistics for all segments, the market breakdown and data triangulation procedures have been employed, wherever applicable. The data has been triangulated by studying various factors and trends from both the demand and supply sides. The market has also been validated using both top-down and bottom-up approaches.
The objectives of the study are as follows:
- To describe and forecast the borescope market, in terms of value, by type, diameter, angle, and industry
- To forecast market size, in terms of value, by region - North America, Europe, Asia Pacific (APAC), and Rest of the World (RoW)
- To provide detailed information regarding major factors influencing market growth (drivers, restraints, opportunities, and challenges)
- To provide a comprehensive overview of the value chain of the borescope ecosystem
- To strategically analyze micromarkets with regard to individual growth trends, prospects, and contributions to the total market
- To strategically profile key players and comprehensively analyze their market position in terms of ranking and core competencies, along with detailing competitive landscape for market leaders
- To analyze strategic approaches such as contracts, acquisitions, product launches, and expansions and partnerships in the borescope market
Available Customizations:
With the given market data, MarketsandMarkets offers customizations according to a company’s specific need. The following customization options are available for the report.
Company information
- Detailed analysis and profiling of additional market players (up to 5)


Growth opportunities and latent adjacency in Borescope Market