Bovine Serum Albumin Market by Form (Dry, Liquid), Grade (Technical-& Diagnostic-Grade, Research/Reagent-Grade, Food Grade), End User (Life Sciences Industry, Feed Industry, Food Industry, Research Institutes), and Region - Global Forecast to 2025


[153 Pages Report] Bovine serum albumin (BSA) or Fraction V is a major plasma protein found in bovine blood. It aids in maintaining the pH levels of blood. It is a significant by-product of the meat industry and is majorly extracted from the fetal blood serum. BSA is purified from the serum by way of different purification methods such as cold-organic solvent fractionation, heat shock, and ion-exchange chromatography. It is also found in milk and whey proteins in varying proportions. This usually occurs due to the leakage of protein from blood serum into the milk as a part of the secretion from mammary glands. BSA is used extensively in various immunology, biochemistry, and biotechnology applications. It is also used in different cell culture applications for protein supplementation and as a small molecule carrier. Some of the significant industries that demand BSA include the pharmaceutical, diagnostic, feed, and food industries.
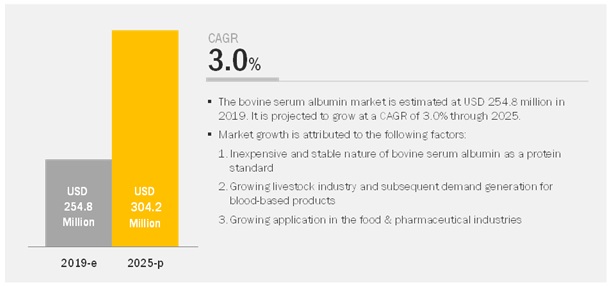
The global bovine serum albumin market is projected to grow from USD 254.8 million in 2019 to USD 304.2 million by 2025, at a CAGR of 3.0%. The global market is growing due to changing consumer preferences for a protein-rich diet and high demand from the life sciences industry.
By end-user, the ‘Life Sciences Industry’ is expected to dominate the market during the forecast period.
The life sciences industry segment dominated the bovine serum albumin market, of which North America accounted for the largest share because of the growing applications of BSA. The rise in chronic illnesses, rising patient compliance, and the growth of biologicals in North America are seen because of high tobacco consumption, excessive alcohol intake, poor nutrition, and lack of physical activity. In the life sciences industry segment, cell culture, as a subsegment, dominated the market. This is because research on animals is banned, leading to most of the research being conducted on culture media. Blood proteins have emulsifying and foaming properties, which create an opportunity in the food industry.
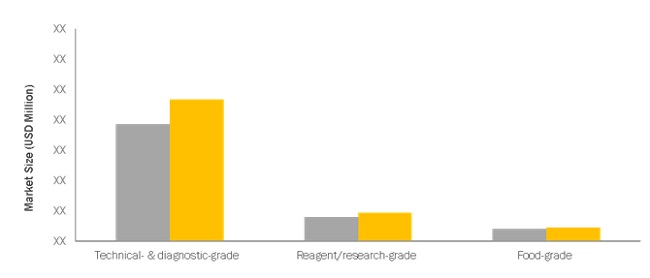
By grade, the technical & diagnostic grade is projected to lead the market during the forecast period.
Across the globe, there are different types of grades offered in the market. Technical- & diagnostic grade dominated the market as it has a wide range of applications such as assay preparations, biotechnology, cell culture applications, and serves as a protein stabilizer. The technical & diagnostic grade of bovine serum albumin (BSA) is used as a blocking agent and is mostly recommended for biotechnology applications. Reagent /research-grade is commonly used in cell culture as a nutrient in tissue culture media, and in immunohematology. Bovine serum albumin can be utilized as a food ingredient or as a nutraceutical.
North America to lead the market during the forecast period.
The North America region accounted for the largest share in the global market. The growing livestock sector, the rising demand for red meat & its products, and the increasing rate of cattle slaughtering drive the growth of the market in the North American region.
Market Dynamics
Driver: Inexpensive and stable nature of bovine serum albumin as a protein standard
Most research organizations make use of bovine serum albumin as a protein standard. It is used to determine the unknown quantities of other proteins by comparing the known quantities of bovine serum albumin. For instance, it is used in Bradford protein assay, a method used to measure the concentration of total protein in a sample, as the stable nature of the serum albumin helps in increasing the signal in assays. Also, bovine serum albumin does not have any effect on many biochemical reactions, which makes scientists in the industry prefer it.. It is relatively cheaper than other protein standards due to large quantities of it, which can be easily purified from bovine blood. Some of its other characteristics, which make it a preferred product, include its highly pure nature and its high solubility in water due to which it is finding increased application in the pharmaceutical and diagnostics industries.
Restraint: Rise in demand for animal-free albumin products
Albumin finds extensive use in biopharmaceuticals, vaccines, and medical device products, among others. The major sources of albumin include human and bovine serum. Blood-borne contaminants have stirred regulatory concerns since issues related to quality and safety might arise within the products that are manufactured using blood as the major ingredient. For instance, animal-derived products might contain viruses, mycoplasma, and transmissible spongiform encephalopathy (TSE) agents, which gets transmitted to the end-user industries. This has led to an increase in demand for safer and consistent animal-free albumin products in the industry. For instance, recombinant animal-free albumin is finding its role in cell culture. Similarly, certain types of animal-free recombinants are being used as reagents, supplements, and enzymes to aid the growth of the plasma-free mammalian cell culture.
Opportunity: Scope for use as a dietary protein for fat reduction
It has been established that this serum albumin is a dietary whey protein that has anti-obesity effects. A research experiment funded by the Republic of Ireland, which is responsible for research and development, training, and advisory services in the food & beverage industry, stated that the intake of BSA as a part of the low-fat diets prevents weight gain. Since obesity is a global problem that has high costs associated with it, the need for a cost-effective solution to tackle the issue of obesity is growing. BSA is a protein that can be easily sourced as a by-product of cheese manufacturing due to which the cost of using it as a potent dietary solution is higher.
Challenge: Existence of alternatives in the diagnostic and pharmaceutical industries
Bovine serum albumin has a significant disadvantage when serving as a protein standard; it exhibits a strong response to dyes due to which there is a possibility of underestimating the protein concentrations within the samples that are being tested. Hence, the need for precision in the measurement of protein concentrations pushes researchers to make effective use of other protein standards such as immunoglobulin G (IgG) and lysozyme. Bovine serum albumin has applications in the pharmaceutical and diagnostics industry due to its abundance, low cost, ease of purification, and unusual ligand-binding properties. However, companies such as Sigma Aldrich have introduced products that can serve as an alternative to bovine serum albumin. The company’s product, Prionex Reagent, a polypeptide fraction extracted from porcine blood finds use as a protein stabilizer, blocking agent, and a protective additive within cell culture applications.
Scope of the Report
|
Report Metric |
Details |
|
Market size available for years |
2017 – 2025 |
|
Base year considered |
2018 |
|
Forecast period |
2019 - 2025 |
|
Forecast units |
Million (USD) |
|
Segments covered |
Form, Grade, End User, Method of Preparation, and Region |
|
Geographies covered |
North America, Europe, Asia Pacific, and RoW |
|
Companies covered |
Key market players including, |
The research report categorizes the Bovine Serum Albumin Market to forecast the revenues and analyze the trends in each of the following sub-segments:
By Form,
- Dry
- Liquid
By Grade,
- Technical- & diagnostic-grade
- Reagent/Research-grade
- Food-grade
By End User,
-
Life sciences industry
- Drug delivery
- Cell culture
- Diagnostics
- Research Institutes
- Food industry
-
Feed industry
- Poultry Feed
- Acqua Feed
- Porcine Feed
- Pet Food
By Region,
-
North America
- Canada
- US
- Mexico
-
Europe
- Germany
- UK
- France
- Spain
- Russia
- Rest of Europe
-
Asia Pacific
- China
- India
- Japan
- Australia & New Zealand
- Rest of Asia Pacific
- Rest of World (RoW)*
Key Market Players
Thermo Fisher Scientific (US), Merck KGAA (Germany), Proliant Biologicals (US), Itoham Yonekyu Holdings Inc (Japan), and Bio-Rad Laboratories, Inc (US)
Recent Developments
- In February 2019, Proliant Biologicals launched its product line for Ultra-High Monomer BSA solution that is mainly designed to improve the performance of BSA in critical research.
- In September 2018, BelHealth Investment Partners, LLC acquired and invested USD 350 million fund in Gemini Bioproducts due to this investment, a wide range of bio-product manufacturing platform was created.
- In February 2018, The company invested USD 44.86 million in a cell culture facility in South Korea, to expand its life science segment in the Asia Pacific region this would help the company to cater to markets in various geographies.
- In January 2018, Itoham Yonekyu Holdings acquired Anzco Foods (New Zealand). This helped the company to expand itself in bovine serum albumin markets of Australia and New Zealand, as it gained the control of Bovogen Biologicals, a subsidiary of Anzco Foods.
Critical questions the report answers:
- What are the new application areas that companies are exploring in the bovine serum albumin market?
- Who are the key players operating in the market?
- What are the significant upcoming trends in the bovine serum albumin market?
- How will the market drivers, restraints, and future opportunities affect market dynamics?
To speak to our analyst for a discussion on the above findings, click Speak to Analyst
 Exclusive indicates content/data unique to MarketsandMarkets and not available with any competitors.
Table of Contents
1 Introduction (Page No. - 16)
1.1 Objectives of the Study
1.2 Market Definition
1.3 Study Scope
1.3.1 Markets Covered
1.3.2 Periodization Considered
1.4 Currency Considered
1.5 Stakeholders
2 Research Methodology (Page No. - 20)
2.1 Research Data
2.1.1 Secondary Data
2.1.2 Primary Data
2.1.2.1 Breakdown of Primaries
2.2 Market Size Estimation
2.3 Data Triangulation
2.4 Research Assumptions & Limitations
2.4.1 Assumptions
2.4.2 Limitations
4 Premium Insights (Page No. - 30)
4.1 Attractive Growth Opportunities in the Market
4.2 Bovine Serum Albumin Market, By Region
4.3 By Market, By End User
4.4 Asia Pacific: By Market, By Grade & Country/Region
4.5 Bovine Serum Albumin Market, By Key Subregional Markets
5 Market Overview (Page No. - 33)
5.1 Introduction
5.2 Market Dynamics
5.2.1 Drivers
5.2.1.1 Inexpensive and Stable Nature of Bovine Serum Albumin as A Protein Standard
5.2.1.2 Growth of the Livestock Industry and Consequent Demand Generation for Blood-Based Products
5.2.1.3 Rise in Application in the Food & Pharmaceutical Industries
5.2.2 Restraints
5.2.2.1 Rise in Demand for Animal-Free Albumin Products
5.2.2.2 Growth in Appeal to Replace Fetal Bovine Serum and Its Components in Cell Culture Applications
5.2.3 Opportunities
5.2.3.1 Scope for Use as A Dietary Protein for Fat Reduction
5.2.3.2 Usage in the Biodegradable and Edible Food Packaging Industry
5.2.4 Challenges
5.2.4.1 Existence of Alternatives in the Diagnostic and Pharmaceutical Industries
5.3 Industry Trends
5.3.1 Supply Chain Analysis
5.4 Porter’s Five Force Analysis
5.4.1 Threat of New Entrants
5.4.2 Threat of Substitutes
5.4.3 Bargaining Power of Buyers
5.4.4 Bargaining Power of Suppliers
5.4.5 Intensity of Rivalry
6 Regulatory Framework (Page No. - 41)
6.1 Introduction
6.1.1 Export to Vietnam: Requirement for Export Certification of Bovine Blood Or Blood Products (Slaughter Collection)
6.1.2 Export to Vietnam: Requirement for Export Certification for Fetal Bovine Serum
6.1.3 Export to Taiwan: Requirement for Export Certification of Bovine Serum Albumin Or Culture Media Containing BSA
6.1.4 Export to Canada: Requirement for Export Certification of Bovine Serum Albumin for Laboratory/Technical Use
6.1.5 Bovine Serum Albumin as an Indicator in the Production of Vaccines
6.1.6 Porcine Blood Products for Use in Animal Feed
7 Bovine Serum Albumin Market, By Method of Preparation (Page No. - 46)
7.1 Introduction
7.2 Cold Ethanol Fractionation
7.2.1 The Cost-Effectiveness and Suitability in Large-Scale Production Drives the Demand for Cold Ethanol Processed BSA
7.3 Ion Exchange Chromatography
7.3.1 The High Efficiency in Separation Makes Ion Exchange Chromatography A Preferred Method for Preparation of BSA
7.4 Heat Shock Fractionation
7.4.1 The Highly Purified BSA Derived Through This Method has Led to Increased Demand From Diagnostics and Research Institutes
7.5 Membrane Filtration
7.5.1 The High Energy Efficiency of the Membrane Filtration Method has Increased Its Demand in the Food Industry
8 Market for Bovine Serum Albumin, By Grade (Page No. - 50)
8.1 Introduction
8.2 Technical- & Diagnostic-Grade
8.2.1 Solubility and Ease of Filtration Make the Diagnostic Grade of BSA Popular in Biotechnological Applications
8.3 Reagent- /Research-Grade
8.3.1 The Market for Reagent-Grade BSA is to Grow Due to Increasing Demand for Vaccines From High-Income Countries
8.4 Food-Grade
8.4.1 The High Demand for Bakery & Confectionery Products is Driving the Demand for Food-Grade BSA
9 Market for Bovine Serum Albumin, By Form (Page No. - 56)
9.1 Introduction
9.2 Dry Form
9.2.1 The Dry Form of Bovine Serum Albumin is Largely Used Because of Its Longer Shelf Life
9.3 Liquid Form
9.3.1 The Liquid Form of BSA is Mostly Used in the Research-Based Pharmaceutical Industry
10 Market for Bovine Serum Albumin, By End User (Page No. - 60)
10.1 Introduction
10.2 Life Sciences Industry
10.2.1 Rise in Prevalence of Chronic Illnesses to Increase the Scope of BSA in the Life Sciences Industry
10.2.2 Drug Delivery
10.2.3 Cell Culture
10.2.4 Diagnostics
10.3 Research Institutes
10.3.1 Research Conducted By Various Institutes for Discovering More Applications for Bovine Serum Albumin
10.4 Food Industry
10.4.1 The Emulsifying and Foaming Properties of Blood Plasma Create Opportunities for Blood Proteins in the Food Industry
10.5 Feed Industry
10.5.1 Increase in Opportunities for Bioactive Ingredients in the Feed Industry Drive Market Growth
10.5.2 Poultry Feed
10.5.3 Aquafeed
10.5.4 Porcine Feed
10.5.5 Pet Food
11 Bovine Serum Albumin Market, By Region (Page No. - 72)
11.1 Introduction
11.2 North America
11.2.1 US
11.2.1.1 The Dynamic Meat Processing Industry is Driving Growth in the US Market
11.2.2 Canada
11.2.2.1 High Demand for Red Meat and Its Products is Set to Drive the Growth of the BSA Market in Canada
11.2.3 Mexico
11.2.3.1 Reduction in Budgetary Allocation for the Livestock Sector to Impact the Market for BSA
11.3 Europe
11.3.1 Germany
11.3.1.1 The Flourishing In-Vitro Diagnostics Industry in Germany is Propelling the Growth of BSA Market
11.3.2 UK
11.3.2.1 The Increase in Rate of Slaughter in Cattle Points to A Growing Market Demand for BSA in the UK
11.3.3 France
11.3.3.1 The Demand for Functional Foods From Consumers Could Propel the Growth of BSA in France
11.3.4 Spain
11.3.4.1 Reduced Feed Costs have Led to an Increased Production in the Country’s Livestock Sector
11.3.5 Russia
11.3.5.1 The Need for Reduction in the Overall Cost of Feed to Drive the Market for BSA in Russia
11.3.6 Rest of Europe
11.3.6.1 The Growth in Demand for Nutritional Supplements and Cost-Effective Ingredients to Drive the Market for BSA in the Region
11.4 Asia Pacific
11.4.1 China
11.4.1.1 Increase in R&D Spending in the Pharmaceutical Industry for Protein-Based Drug Delivery to Increase Opportunities in China
11.4.2 India
11.4.2.1 Increase in R&D on Vaccines That Use Bovine Serum Albumin to Provide Market Growth Prospects in India
11.4.3 Japan
11.4.3.1 Demand for BSA Nanoparticles to Treat Chronic Diseases Will Provide New Avenues for Growth in Japan
11.4.4 Australia & New Zealand
11.4.4.1 Demand for Bse-Free Bovine Serum Albumin Offered By the Australia & New Zealand to Drive Growth
11.4.5 Rest of Asia Pacific
11.4.5.1 Demand for Protein-Based Drugs Used to Treat Various Diseases to Propel Market Growth
11.5 Rest of the World
11.5.1 South America
11.5.1.1 Increase in the Production of Cheese Boosting the Market in South America
11.5.2 Middle East & Africa
11.5.2.1 Rise in Demand for Animal Feed Additives Creating Opportunities for the Market in the Middle East & Africa
12 Competitive Landscape (Page No. - 108)
12.1 Overview
12.2 Competitive Leadership Mapping (Overall Market)
12.2.1 Terminology/Nomenclature
12.2.1.1 Visionary Leaders
12.2.1.2 Innovators
12.2.1.3 Dynamic Differentiators
12.2.1.4 Emerging Companies
12.3 Strength of Product Portfolio
12.4 Business Strategy Excellence
12.5 Ranking of Key Players, 2018
12.6 Competitive Scenario
12.6.1 New Product Launches
12.6.2 Expansions & Investments
12.6.3 Mergers & Acquisitions
13 Company Profiles (Page No. - 117)
(Business Overview, Products Offered, Recent Developments, SWOT Analysis, MnM View)*
13.1 Thermo Fisher Scientific Inc.
13.2 Bio-Rad Laboratories, Inc.
13.3 Merck KGaA
13.4 Itoham Yonekyu Holdings Inc.
13.5 Proliant Biologicals
13.6 Kraeber & Co GmbH
13.7 Rockland Immunochemicals Inc.
13.8 Rocky Mountain Biologicals
13.9 Belhealth Investment Partners, LLC
13.10 Bio-Techne Corporation
13.11 Prospec-Tany Technogene Ltd.
13.12 LGC Group
13.13 Promega Corporation
13.14 Biological Industries
13.15 Serion GmbH
*Details on Business Overview, Products Offered, Recent Developments, SWOT Analysis, MnM View Might Not Be Captured in Case of Unlisted Companies.
14 Appendix (Page No. - 147)
14.1 Discussion Guide
14.2 Knowledge Store: Marketsandmarkets’ Subscription Portal
14.3 Available Customizations
14.4 Related Reports
14.5 Author Details
List of Tables (74 Tables)
Table 1 USD Exchange Rates Considered, 2014–2018
Table 2 Distribution of Plasma Proteins in the Cohn Fractionation System
Table 3 Bovine Serum Albumin Market Size, By Grade, 2017–2025 (USD Million)
Table 4 Technical-& Diagnostic-Grade By Market Size, By Region, 2017–2025 (USD Million)
Table 5 Reagent-/Research-Grade Bovine Serum Albumin Market Size, By Region, 2017–2025 (USD Million)
Table 6 Bovine Serum Albumin-Based Products in the Food Industry
Table 7 Food-Grade Bovine Serum Albumin Market Size, By Region, 2017–2025 (USD Thousand)
Table 8 By Market Size, By Form, 2017–2025 (USD Million)
Table 9 Dry Bovine Serum Albumin Market Size, By Region, 2017–2025 (USD Million)
Table 10 Liquid Bovine Serum Albumin Market Size, By Region, 2017–2025 (USD Million)
Table 11 Market Size For Bovine Serum Albumin, By End User, 2017–2025 (USD Million)
Table 12 By Market Size in Life Sciences Industry, By Region, 2017–2025 (USD Million)
Table 13 By Market Size in Drug Delivery, By Region, 2017–2025 (USD Million)
Table 14 By Market Size in Cell Culture, By Region, 2017–2025 (USD Million)
Table 15 By Market Size in Diagnostics, By Region, 2017–2025 (USD Million)
Table 16 By Market Size in Research Institutes, By Region, 2017–2025 (USD Million)
Table 17 Food Industry: By Market Size, By Region, 2017–2025 (USD Thousand)
Table 18 Bovine Serum Albumin Market Size in Feed Industry, By Region, 2017–2025 (USD Thousands)
Table 19 Market Size For Bovine Serum Albumin, By Region, 2017–2025 (USD Million)
Table 20 Bovine Meat Production in Selected Countries, 2017 (‘000 Tonne)
Table 21 North America: Bovine Serum Albumin Market Size, By Country, 2017–2025 (USD Million)
Table 22 North America: By Market Size, By Form, 2017–2025 (USD Billion)
Table 23 North America: By Market Size, By Grade, 2017–2025 (USD Million)
Table 24 North America: By Market Size, By End User, 2017–2025 (USD Thousand)
Table 25 North America: By Market Size in Life Sciences Industry, By End Use, 2017–2025 (USD Thousand)
Table 26 US: Market Size For Bovine Serum Albumin, By Form, 2017–2025 (USD Million)
Table 27 US: By Market Size, By Grade, 2017–2025 (USD Million)
Table 28 Canada: By Market Size, By Form, 2017–2025 (USD Million)
Table 29 Canada: By Market Size, By Grade, 2017–2025 (USD Thousand)
Table 30 Mexico: By Market Size, By Form, 2017–2025 (USD Thousand)
Table 31 Mexico: By Market Size, By Grade, 2017–2025 (USD Thousand)
Table 32 Europe: By Market Size, By Country, 2017–2025 (USD Million)
Table 33 Europe: Market Size For Bovine Serum Albumin, By Form, 2017–2025 (USD Million)
Table 34 Europe: By Market Size, By Grade, 2017–2025 (USD Million)
Table 35 Europe: By Market Size, By End User, 2017–2025 (USD Thousand)
Table 36 Europe: By Market Size in Life Sciences Industry, By End Use, 2017–2025 (USD Million)
Table 37 Germany: By Market Size, By Form, 2017–2025 (USD Million)
Table 38 Germany : By Market Size, By Grade, 2017–2025 (USD Thousand)
Table 39 UK: Meat Consumption, By Type, 2014–2017
Table 40 UK: Bovine Serum Albumin Market Size, By Form, 2017–2025 (USD Million)
Table 41 UK : By Market Size, By Grade, 2017–2025 (USD Thousand)
Table 42 France: By Market Size, By Form, 2017–2025 (USD Million)
Table 43 France : Market Size For Bovine Serum Albumin, By Grade, 2017–2025 (USD Thousand)
Table 44 Spain: By Market Size, By Form, 2017–2025 (USD Thousand)
Table 45 Spain: By Market Size, By Grade, 2017–2025 (USD Thousand)
Table 46 Russia: By Market Size, By Form, 2017–2025 (USD Thousand)
Table 47 Russia : By Market Size, By Grade, 2017–2025 (USD Thousand)
Table 48 Rest of Europe: Market Size For Bovine Serum Albumin, By Form, 2017–2025 (USD Million)
Table 49 Rest of Europe : By Market Size, By Grade, 2017–2025 (USD Thousand)
Table 50 Asia Pacific: By Market Size, By Country/Region, 2017–2025 (USD Million)
Table 51 Asia Pacific: By Market Size, By Grade, 2017–2025 (USD Million)
Table 52 Asia Pacific: By Market Size, By End User, 2017–2025 (USD Thousand)
Table 53 Asia Pacific: By Market Size, By Form, 2017–2025 (USD Million)
Table 54 China: Bovine Serum Albumin Market Size, By Form, 2017–2025 (USD Million)
Table 55 China: By Market Size, By Grade, 2017–2025 (USD Million)
Table 56 India: By Market Size, By Form, 2017–2025 (USD Thousand)
Table 57 India: By Market Size, By Grade, 2017–2025 (USD Thousand)
Table 58 Japan: By Market Size, By Form, 2017–2025 (USD Thousand)
Table 59 Japan: By Market Size, By Grade, 2017–2025 (USD Thousand)
Table 60 Australia & New Zealand: Market Size For Bovine Serum Albumin, By Form, 2017–2025 (USD Thousand)
Table 61 Australia & New Zealand: By Market Size, By Grade, 2017–2025 (USD Thousand)
Table 62 Rest of Asia Pacific: By Market Size, By Form, 2017–2025 (USD Thousand)
Table 63 Rest of Asia Pacific: By Market Size, By Grade, 2017–2025 (USD Thousand)
Table 64 RoW: Bovine Serum Albumin Market Size, By Region, 2017–2025 (USD Million)
Table 65 RoW: By Market Size, By Grade, 2017–2025 (USD Thousand)
Table 66 RoW: By Market Size, By End User, 2017–2025 (USD Thousand)
Table 67 RoW: By Market Size, By Form, 2017–2025 (USD Million)
Table 68 South America: By Market Size, By Form, 2017–2025 (USD Thousand)
Table 69 South America: By Market Size, By Grade, 2017–2025 (USD Thousand)
Table 70 Middle East & Africa: Market Size For Bovine Serum Albumin, By Form, 2017–2025 (USD Thousand)
Table 71 Middle East & Africa: By Market Size, By Grade, 2017–2025 (USD Thousand)
Table 72 New Product Launches 2017–2019
Table 73 Expansions & Investments 2015–2018
Table 74 Mergers & Acquisitions, 2014–2018
List of Figures (69 Figures)
Figure 1 Market Segmentation
Figure 2 Regional Segmentation
Figure 3 Research Design
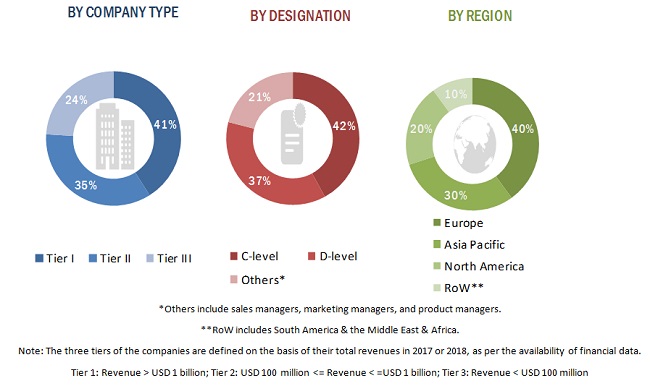
Figure 4 Breakdown of Primary Interviews
Figure 5 Market Size Estimation: Bottom-Up Approach
Figure 6 Market Size Estimation Methodology: Top-Down Approach
Figure 7 Market Size Estimation Methodology: Specific Methodology
Figure 8 Data Triangulation
Figure 9 Market Size For Bovine Serum Albumin, By Grade, 2019 vs 2025 (USD Million)
Figure 10 Bovine Serum Albumin Market Size, By End User, 2019 vs 2025 (USD Million)
Figure 11 By Market Size, By Form, 2019 vs 2025 (USD Million)
Figure 12 Asia Pacific to Grow at the Highest CAGR in the Market From 2019 to 2025
Figure 13 By Market Share and Growth (Value), By Region
Figure 14 Growth in Application in the Food and Pharmaceutical Industries Offer Attractive Opportunities in the Market
Figure 15 North America is to Dominate the Global Market in 2019 and 2025
Figure 16 The Life Sciences Industry is Set to Dominate the Market During the Forecast Period
Figure 17 Technical- & Diagnostic-Grade to Dominate the Market in 2018
Figure 18 China is Projected to Be the Fastest-Growing Individual Market for Bovine Serum Albumin Between 2019 and 2025
Figure 19 Bovine Serum Extraction Process
Figure 20 Widening Scope for Applications in Multifarious Industries Driving the Growth of the Market
Figure 21 Global Bovine Meat Production and Trade, 2015–2017 (In Million Tonnes)
Figure 22 Classification of Animal By-Products
Figure 23 Bovine Serum Albumin Market: Supply Chain
Figure 24 Bovine Serum Extraction Through Cold Ethanol Process
Figure 25 Extraction of Albumin Through Ion Exchange Chromatography
Figure 26 Bovine Serum Extraction Through Heat Shock Fractionation
Figure 27 Market Size For Bovine Serum Albumin, By Grade, 2019 vs 2025 (USD Million)
Figure 28 Technical- & Diagnostic-Grade Bovine Serum Albumin Market Size, By Region, 2019 vs 2025 (USD Million)
Figure 29 Market Size For Bovine Serum Albumin, By Form, 2019 vs 2025 (USD Million)
Figure 30 Dry Form Bovine Serum Albumin Market, 2019 vs 2025 (USD Million)
Figure 31 Market Size For Bovine Serum Albumin, By End User, 2019 vs 2025 (USD Million)
Figure 32 By Market Size in Life Sciences Industry, By Region, 2019 vs 2025 (USD Million)
Figure 33 Global Feed Production, By Target Animal (Million Metric Tons)
Figure 34 Poultry Feed Production, By Region, 2018 (Million Metric Ton)
Figure 35 Aquafeed Production, By Region, 2018 (Million Metric Ton)
Figure 36 Porcine Feed Production, By Region, 2018 (Million Metric Ton)
Figure 37 Pet Food Production, By Region, 2018 (Million Metric Ton)
Figure 38 US Accounted for the Largest Market Share in the Market During the Forecast Period
Figure 39 North America: Bovine Serum Albumin Market Snapshot
Figure 40 US: Market Shares of Types of Meat Processed, 2017
Figure 41 European Union: Bovine Meat Production Share, By Key Country, 2017
Figure 42 Europe: Market Snapshot, 2018
Figure 43 Germany: Food & Beverage Industry, By Segment, 2017
Figure 44 UK: Cattle and Calf Production on Agricultural Landholdings, 2013–2017 (Thousand)
Figure 45 UK: Monthly Livestock Slaughtered, 2019 (‘000 Head)
Figure 46 Turnover of French Food Processing Companies, 2017 (USD Million)
Figure 47 Major Food Products Consumed in Spain, 2015
Figure 48 Russia: Annual Pharmaceutical Sales, 2015–2017 (USD Million)
Figure 49 Asia Pacific: Bovine Serum Albumin Market Snapshot, 2018
Figure 50 Global Milk Production Share, By Region, 2018
Figure 51 Cheese Export of Argentina, 2018 (Tonne)
Figure 52 Feed Production Share, By Region, 2018 (Million Tonne)
Figure 53 Feed Production Share, By Target Livestock Type, 2018
Figure 54 Growth in Feed Production, By Region, 2018
Figure 55 Key Developments of the Leading Players in the Market, 2014-2019
Figure 56 Bovine Serum Albumin Market Competitive Leadership Mapping, 2018
Figure 57 Merck KGaA Led the Market In, 2018
Figure 58 Market Evaluation Framework, 2016–2018
Figure 59 Thermo Fisher Scientific Inc.: Company Snapshot
Figure 60 Thermo Fisher Scientific Inc.: SWOT Analysis
Figure 61 Bio-Rad Laboratories, Inc.: Company Snapshot
Figure 62 Bio-Rad Laboratories, Inc.: SWOT Analysis
Figure 63 Merck KGaA: Company Snapshot
Figure 64 Merck KGaA: SWOT Analysis
Figure 65 Itoham Yonekyu Holdings Inc.: Company Snapshot
Figure 66 Itoham Yonekyu Holdings Inc.: SWOT Analysis
Figure 67 Proliant Biologicals.: SWOT Analysis
Figure 68 Bio-Techne Corporation.: Company Snapshot
Figure 69 LGC Group.: Company Snapshot
The study involves four major activities to estimate the current market size of the bovine serum albumin market. Exhaustive secondary research was done to collect information on the market, peer market, and parent market. These findings, assumptions, and market sizes were validated with industry experts across the value chain through primary research. Both the top-down and bottom-up approaches were employed to estimate the complete market size. Thereafter, the market breakdown and data triangulation approaches were used to estimate the market size of segments and sub-segments.
Secondary Research
In the secondary research process, various secondary sources such as Hoovers, Bloomberg BusinessWeek, and Dun & Bradstreet were referred to, to identify and collect information for this study. These secondary sources included annual reports, press releases & investor presentations of companies, white papers, certified publications, articles by recognized authors, gold standard & silver standard websites, food safety organizations, regulatory bodies, trade directories, and databases.
Primary Research
The bovine serum albumin market comprises several stakeholders such as manufacturers, importers and exporters, traders, distributors and suppliers of bovine serum albumin, and government & research organizations. The demand-side of this market is characterized by the rising demand for blood protein such as bovine serum albumin from pharmaceutical and diagnostic industries, researchers, importers/exporters, and distributors. The supply-side is characterized by the supply of processed blood plasma from various suppliers in the market and by the presence of key providers of bovine serum albumin. Various primary sources from both the supply and demand sides of the market were interviewed to obtain qualitative and quantitative information. Following is the breakdown of primary respondents:
To know about the assumptions considered for the study, download the pdf brochure
Market Size Estimation
Both the top-down and bottom-up approaches were used to estimate and validate the total size of the bovine serum albumin market. These methods were also used extensively to estimate the size of various subsegments in the market. The research methodology used to estimate the market size includes the following:
- The key players in the industry and markets were identified through extensive secondary research
- The industry’s supply chain and market size, in terms of value, was determined through primary and secondary research processes
- All percentage shares, splits, and breakdowns were determined using secondary sources and verified through primary respondents
Data Triangulation
After arriving at the overall market size—using the market size estimation processes as explained above—the market was split into several segments and subsegments. In order to complete the overall market engineering process and arrive at the exact statistics of each market segment and subsegment, the data triangulation and market breakdown procedures were employed. The data was triangulated by studying various factors and trends from both the demand and supply sides in the bovine serum albumin market.
Report Objectives
- To define, segment, and project the global market size of the bovine serum albumin market
- To understand the bovine serum albumin market by identifying its various subsegments
- To provide detailed information about the key factors influencing the growth of the market (drivers, restraints, opportunities, and industry-specific challenges)
- To analyze the micromarkets, with respect to individual growth trends, prospects, and their contribution to the total market
- To project the size of the market and its submarkets, in terms of value, with respect to the regions (along with their respective key countries)
- To profile the key players and comprehensively analyze their core competencies
- To understand the competitive landscape and identify the major growth strategies adopted by the players across the key regions
- To analyze the competitive developments such as expansions & investments, mergers & acquisitions, new product launches, partnerships, joint ventures, and agreements
Available Customizations
With the given market data, MarketsandMarkets offers customizations according to company-specific scientific needs.
The following customization options are available for the report:
Product Analysis
- Product matrix, which gives a detailed comparison of the product portfolio of each company
Geographic Analysis
- Further breakdown of the Rest of Europe bovine serum albumin market into the Netherlands, Denmark, Belgium, and Italy
- Further breakdown of the Rest of Asia Pacific bovine serum albumin market into Thailand, Vietnam, Malaysia, and South Korea
- Further breakdown of the RoW bovine serum albumin market into South America and the Middle East & Africa.
Company Information
- Detailed analyses and profiling of additional market players (up to five)


Growth opportunities and latent adjacency in Bovine Serum Albumin Market
I want to know in detail about the regulatory bodies and the possible market restraints. Is it possible to get such information at the global level?