[167 Pages Report] The global cardiac marker testing market size is projected to reach USD 5.5 billion by 2025 from USD 3.6 billion in 2020, at a CAGR of 8.9% during the forecast period growth in the cardiac marker testing market is majorly driven by growing incidence of cardiovascular diseases, rapidly increasing geriatric population, and growing funding from public and private organizations for research on cardiac biomarkers.
To know about the assumptions considered for the study, Request for Free Sample Report
The cardiac marker testing market is also faced a period of short-term negative growth, which can be attributed to factors such as a greater than 50% drop in the number of patients with cardiovascular conditions and those diagnosed with myocardial infarction. All areas of cardiology service provision sustained significant reductions, which included outpatient clinics, investigations, procedures, and cardiology community services such as cardiac rehabilitation.
The prevalence of lifestyle diseases such as hypertension, obesity, dyslipidemia, and diabetes, which are major risk factors for CVD, is also on the rise. In 2016, more than 1.9 billion adults globally were overweight; of these, over 600 million people were obese. It is estimated that ~41% of the world’s population will be overweight or obese by 2030 (Source: WHO). The association between obesity and the risk of coronary heart disease was published by investigators (Bogers RP, Bemelmans WJ, Hoogenveen RT, et al.) through a meta-analysis of 21 long-term studies conducted by them with more than 300,000 participants. It was observed that participants who were overweight had a 32% higher risk of developing coronary artery disease (CAD), and those who were obese had an 81% higher risk as compared with participants who were a normal weight.
Many epidemiology studies use cardiac biomarkers to investigate different stages of diseases in humans. It requires careful handling and storage of precious biological samples with the goal of obtaining a large amount of information from limited samples and minimizing future research costs with the use of banked samples. Sample collection is thus one of the key issues faced by service providers, followed by access to these samples. Similarly, stringent quality control is also required for these samples, and they need to be stored under the right conditions to avoid any loss. Also, different samples are required for risk detection, screening, diagnosis, and monitoring processes. The validity of results from cardiac biomarker studies using archived specimens is dependent on the integrity of specimens and the manner in which they were collected, processed, and stored.
In the past few years, the demand for point-of-care testing (POCT) assays has increased considerably, owing to the globally increasing number of cardiovascular disease patients in emergency departments (EDs) requiring urgent disease diagnosis. The adoption of POCT with cardiac biomarkers is growing in diagnostic procedures for cardiovascular diseases across the globe, owing to the advantages offered by it. These include reduced lengths of stay, improved emergency department efficiency, increased patient satisfaction and user experience, better turnaround times, and simpler sample collection. To capitalize on the opportunities in the POC segment, key industry players are increasingly focusing on developing technologically advanced POCT for cardiovascular diseases.
Growing number of cardiac marker testing procedures, accessibility to a wide range of cardiac biomarker reagents and kits, and the growing demand for reliable, specific, and faster detection of cardiovascular diseases at an early stage are the key growth factors for this segment.
Troponin I and T is estimated to be the fastest-growing segment in the cardiac marker testing market. The large share of this segment can be attributed high sensitivity and specificity, long elevation times, and rapid prediction of outcome or mortality.
North America is estimated to be the largest market due to increasing incidence of cardiovascular diseases, growing public and private investments, NIH support for the development of novel cardiac biomarkers, and the rising geriatric population.
Roche Diagnostics Ltd. (Switzerland), Abbott Laboratories (US), Siemens Healthineers AG (Germany), Danaher Corporation (US), bioMérieux SA (France), LSI Medience Corporation (Japan), Ortho Clinical Diagnostics (US), Randox laboratories Ltd. (UK), Guangzhou Wondfo Biotech Co., Ltd (China), DiaSorin S.p.A. (Italy), Becton, Dickinson and Company (US), Bio-Rad Laboratories, Inc. (US), PerkinElmer Inc. (US), Thermo Fisher Scientific Inc. (US), and Tosoh Corporation (Japan)
Roche Diagnostics was the largest player in the cardiac marker testing market. Roche Diagnostics has established itself as a leader in the cardiac markers market. The company invests a significant amount in R&D activities to launch advanced products in the market. To remain competitive in the market, the company also focuses on inorganic growth strategies such as agreements and acquisitions. These strategies enable the company to expand its point-of-care molecular testing portfolio. The company’s focus on product integration, through the launch of holistic and user-friendly products, will help it to further strengthen its presence in the cardiac marker testing market.
Report Metric |
Details |
Market Size Available for Years |
2018–2025 |
Base Year Considered |
2019 |
Forecast Period |
2020–2025 |
Forecast Units |
Value (USD Billion) |
Segments Covered |
Product, Biomarker Type, Disease, End User, and Region |
Geographies Covered |
North America (US & Canada), Europe (Germany, the UK, France, Italy, Spain, and RoE), APAC (Japan, China, India, and the RoAPAC), LATAM (Brazil, Mexico, and RoLATAM), and MEA |
Companies Covered |
Roche Diagnostics Ltd. (Switzerland), Abbott Laboratories (US), Siemens Healthineers AG (Germany), Danaher Corporation (US), bioMérieux SA (France), LSI Medience Corporation (Japan), Ortho Clinical Diagnostics (US), Randox laboratories Ltd. (UK), Guangzhou Wondfo Biotech Co., Ltd (China), DiaSorin S.p.A. (Italy), Becton, Dickinson and Company (US), Bio-Rad Laboratories, Inc. (US), PerkinElmer Inc. (US), Thermo Fisher Scientific Inc. (US), and Tosoh Corporation (Japan) |
This research report categorizes the cardiac marker testing market based on product, biomarker type, disease, end user, and region
What are the drivers for the cardiac marker testing market?
The growth in the cardiac marker testing market is driven majorly growing incidence cardiovascular diseases, rapidly increasing geriatric population, growing funding from public and private organizations for research on cardiac biomarkers, and ongoing clinical trials for the identification of novel cardiac biomarkers.
Which segment provides the most opportunity for growth?
Reagents and kits in product segment is expected to show the most opportunity for growth.
Who are the leading vendors operating in this market?
Roche Diagnostics Ltd. (Switzerland), Abbott Laboratories (US), Siemens Healthineers AG (Germany), Danaher Corporation (US), bioMérieux SA (France), LSI Medience Corporation (Japan), Ortho Clinical Diagnostics (US), Randox laboratories Ltd. (UK), Guangzhou Wondfo Biotech Co., Ltd (China), DiaSorin S.p.A. (Italy), Becton, Dickinson and Company (US), Bio-Rad Laboratories, Inc. (US), PerkinElmer Inc. (US), Thermo Fisher Scientific Inc. (US), and Tosoh Corporation (Japan)
Which region is expected to witness significant demand for cardiac marker testing in the coming years?
The Asia Pacific is the fastest-growing geographic segment in the cardiac marker testing market, with a CAGR of 12.1% during the forecast period. The Asia Pacific market is driven due increased healthcare spending by a larger population base, healthcare infrastructure modernization, and the rising penetration of cutting-edge clinical laboratory technologies (especially in rural areas) in Asia Pacific countries.
What is the COVID 19 impact on cardiac marker testing in the coming years?
The cardiac marker testing market is also faced a period of short-term negative growth, which can be attributed to factors such as a greater than 50% drop in the number of patients with cardiovascular conditions and those diagnosed with myocardial infarction. All areas of cardiology service provision sustained significant reductions, which included outpatient clinics, investigations, procedures, and cardiology community services such as cardiac rehabilitation. .
To speak to our analyst for a discussion on the above findings, click Speak to Analyst
TABLE OF CONTENTS
1 INTRODUCTION (Page No. - 23)
1.1 OBJECTIVES OF THE STUDY
1.2 MARKET DEFINITION
1.2.1 INCLUSIONS & EXCLUSIONS OF THE STUDY
1.3 MARKET SCOPE
1.3.1 MARKETS COVERED
1.3.2 YEARS CONSIDERED FOR THE STUDY
1.4 CURRENCY USED FOR THE STUDY
1.5 STAKEHOLDERS
1.6 SUMMARY OF CHANGES
2 RESEARCH METHODOLOGY (Page No. - 27)
2.1 RESEARCH DATA
FIGURE 1 RESEARCH DESIGN
2.1.1 SECONDARY DATA
2.1.1.1 Indicative list of secondary sources
2.1.2 PRIMARY DATA
FIGURE 2 BREAKDOWN OF PRIMARIES: CARDIAC MARKER TESTING MARKET
2.2 MARKET ESTIMATION METHODOLOGY
FIGURE 3 RESEARCH METHODOLOGY: HYPOTHESIS BUILDING
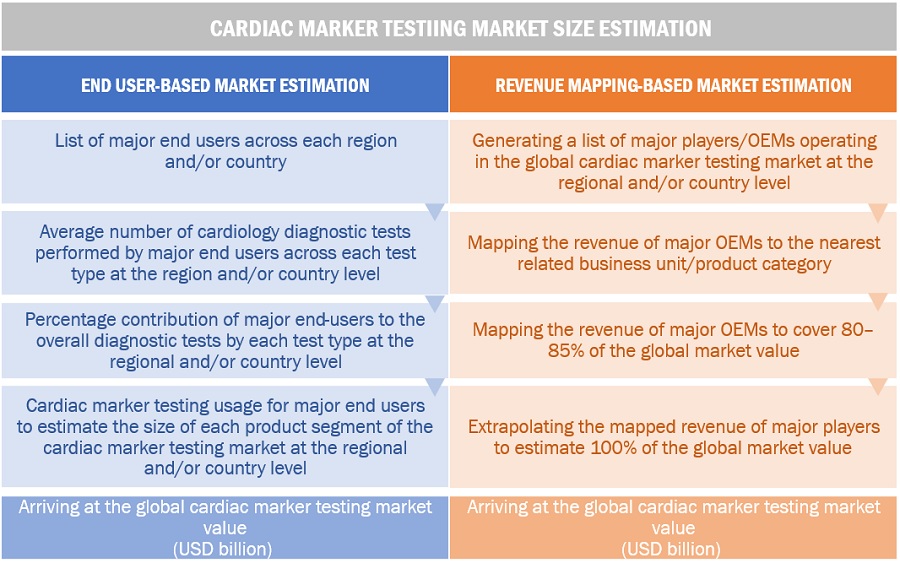
2.2.1 REVENUE MAPPING-BASED MARKET ESTIMATION
2.2.2 END USER-BASED MARKET ESTIMATION
FIGURE 4 MARKET SIZE ESTIMATION: CARDIAC MARKER TESTING MARKET
2.2.3 PRIMARY RESEARCH VALIDATION
2.3 DATA TRIANGULATION
FIGURE 5 DATA TRIANGULATION METHODOLOGY
2.4 RESEARCH ASSUMPTIONS
2.5 RESEARCH LIMITATIONS
3 EXECUTIVE SUMMARY (Page No. - 35)
FIGURE 6 CARDIAC MARKER TESTING MARKET, BY BIOMARKER TYPE, 2020 VS. 2025 (USD MILLION)
FIGURE 7 CARDIAC MARKER TESTING MARKET, BY END USER, 2020 VS. 2025 (USD MILLION)
FIGURE 8 GEOGRAPHICAL SNAPSHOT OF THE CARDIAC MARKER TESTING MARKET
4 PREMIUM INSIGHTS (Page No. - 38)
4.1 CARDIAC MARKER TESTING MARKET OVERVIEW
FIGURE 9 INCREASING INCIDENCE OF CARDIOVASCULAR DISEASES TO DRIVE MARKET GROWTH
4.2 CARDIAC MARKER TESTING MARKET SHARE, BY PRODUCT, 2020 VS. 2025
FIGURE 10 REAGENTS & KITS SEGMENT WILL CONTINUE TO DOMINATE THE CARDIAC MARKER TESTING MARKET IN 2025
4.3 CARDIAC MARKER TESTING MARKET, BY REGION, 2020–2025
FIGURE 11 APAC REGION TO REGISTER THE HIGHEST GROWTH RATE DURING THE FORECAST PERIOD
5 MARKET OVERVIEW (Page No. - 40)
5.1 INTRODUCTION
5.2 MARKET DYNAMICS
FIGURE 12 CARDIAC MARKER TESTING MARKET: DRIVERS, RESTRAINTS, AND OPPORTUNITIES
5.2.1 DRIVERS
5.2.1.1 Growing incidence of cardiovascular diseases
5.2.1.2 Rapidly increasing geriatric population and the subsequent increase in the burden of heart diseases worldwide
5.2.1.3 Growing funding from public and private organizations for research on cardiac biomarkers
5.2.1.4 Ongoing clinical trials for the identification of novel cardiac biomarkers
5.2.2 RESTRAINTS
5.2.2.1 Technical problems related to sample collection and storage
5.2.2.2 Issues related to regulatory and reimbursement systems
5.2.3 OPPORTUNITIES
5.2.3.1 Point-of-care testing (POCT) with cardiac biomarkers
5.2.3.2 Ongoing research on novel cardiac biomarkers for cardiovascular diseases
5.2.3.3 Emerging markets to offer high-growth opportunities for market players
5.3 COVID-19 IMPACT ON THE CARDIAC MARKER TESTING MARKET
5.4 REGULATORY ANALYSIS
5.4.1 US
TABLE 1 US: CLASSIFICATION OF IN VITRO DIAGNOSTIC DEVICES
FIGURE 13 US: REGULATORY PROCESS FOR IVD DEVICES
5.4.2 CANADA
FIGURE 14 CANADA: REGULATORY PROCESS FOR IVD DEVICES
5.4.3 EUROPE
TABLE 2 EUROPE: CLASSIFICATION OF IVD DEVICES
FIGURE 15 EUROPE: REGULATORY PROCESS FOR IVD DEVICES
5.4.4 JAPAN
FIGURE 16 JAPAN: REGULATORY PROCESS FOR IVD DEVICES
TABLE 3 JAPAN: CLASSIFICATION OF IVD REAGENTS
TABLE 4 JAPAN: TIME, COST, AND COMPLEXITY OF REGISTRATION PROCESS
5.4.5 CHINA
TABLE 5 CHINA: TIME, COST, AND COMPLEXITY OF REGISTRATION PROCESS
5.4.6 INDIA
FIGURE 17 INDIA: REGULATORY PROCESS FOR IVD DEVICES
5.4.7 RUSSIA
TABLE 6 RUSSIA: CLASSIFICATION OF IVD DEVICES
5.4.8 MEXICO
FIGURE 18 MEXICO: REGULATORY PROCESS FOR IVD DEVICES
TABLE 7 MEXICO: TIME, COST, AND COMPLEXITY OF REGISTRATION PROCESS
5.4.9 BRAZIL
FIGURE 19 BRAZIL: REGULATORY PROCESS FOR IVD DEVICES
5.4.10 SOUTH KOREA
TABLE 8 SOUTH KOREA: TIME, COST, AND COMPLEXITY OF REGISTRATION PROCESS
5.5 REIMBURSEMENT SCENARIO
TABLE 9 REIMBURSEMENT CODES FOR VARIOUS BIOMARKERS
5.6 VALUE CHAIN ANALYSIS
FIGURE 20 CARDIAC MARKER TESTING MARKET: VALUE CHAIN ANALYSIS
5.7 ECOSYSTEM: PARENT INDUSTRY (IN VITRO DIAGNOSTICS)
5.8 SE CASES: IN VITRO DIAGNOSTICS MARKET
5.8.1 REVENUE OPPORTUNITIES: IVD ASSAY DEVELOPMENT SERVICES
5.8.2 REVENUE OPPORTUNITIES: IVD CONTRACT RESEARCH SERVICES
6 CARDIAC MARKER TESTING MARKET, BY PRODUCT (Page No. - 59)
6.1 INTRODUCTION
TABLE 10 CARDIAC MARKER TESTING MARKET, BY PRODUCT, 2018–2025 (USD MILLION)
6.2 REAGENTS & KITS
6.2.1 INCREASING NUMBER OF TESTS PERFORMED TO DRIVE THE MARKET GROWTH
TABLE 11 CARDIAC MARKER TESTING REAGENTS AND KITS MARKET, BY REGION, 2018–2025 (USD MILLION)
TABLE 12 CARDIAC MARKER TESTING REAGENTS AND KITS MARKET, BY BIOMARKER TYPE, 2018–2025 (USD MILLION)
6.3 INSTRUMENTS
TABLE 13 CARDIAC MARKER TESTING INSTRUMENTS MARKET, BY TECHNIQUE, 2018–2025 (USD MILLION)
TABLE 14 CARDIAC MARKER TESTING INSTRUMENTS MARKET, BY BIOMARKER TYPE, 2018–2025 (USD MILLION)
TABLE 15 CARDIAC MARKER TESTING INSTRUMENTS MARKET, BY REGION, 2018–2025 (USD MILLION)
6.3.1 CHEMILUMINESCENCE
6.3.1.1 Chemiluminescence is the most preferred method for the quantification of cardiac biomarkers
TABLE 16 CARDIAC MARKER TESTING INSTRUMENTS MARKET FOR CHEMILUMINESCENCE, BY REGION, 2018–2025 (USD MILLION)
TABLE 17 CARDIAC MARKER TESTING INSTRUMENTS MARKET FOR CHEMILUMINESCENCE, BY BIOMARKER TYPE, 2018–2025 (USD MILLION)
6.3.2 IMMUNOFLUORESCENCE
6.3.2.1 Demand for stable and safer reagents to support market growth
TABLE 18 CARDIAC MARKER TESTING INSTRUMENTS MARKET FOR IMMUNOFLUORESCENCE, BY REGION, 2018–2025 (USD MILLION)
TABLE 19 CARDIAC MARKER TESTING INSTRUMENTS MARKET FOR IMMUNOFLUORESCENCE, BY BIOMARKER TYPE, 2018–2025 (USD MILLION)
6.3.3 ELISA
6.3.3.1 Ease of use and simplicity of the method are the key advantages associated with ELISA
TABLE 20 CARDIAC MARKER TESTING INSTRUMENTS MARKET FOR ELISA, BY REGION, 2018–2025 (USD MILLION)
TABLE 21 CARDIAC MARKER TESTING INSTRUMENTS MARKET FOR ELISA, BY BIOMARKER TYPE, 2018–2025 (USD MILLION)
6.3.4 IMMUNOCHROMATOGRAPHY
6.3.4.1 Increasing use in point-of-care settings to fuel the adoption of this technique
TABLE 22 CARDIAC MARKER TESTING INSTRUMENTS MARKET FOR IMMUNOCHROMATOGRAPHY, BY REGION, 2018–2025 (USD MILLION)
TABLE 23 CARDIAC MARKER TESTING INSTRUMENTS MARKET FOR IMMUNOCHROMATOGRAPHY, BY BIOMARKER TYPE, 2018–2025 (USD MILLION)
7 CARDIAC MARKER TESTING MARKET, BY BIOMARKER TYPE (Page No. - 68)
7.1 INTRODUCTION
TABLE 24 CARDIAC MARKER TESTING MARKET, BY BIOMARKER TYPE, 2018–2025 (USD MILLION)
7.2 TROPONIN I AND T
7.2.1 HIGH SENSITIVITY OF THIS BIOMARKER TEST IS SUPPORTING ITS INCREASED ADOPTION IN THE MARKET
TABLE 25 CHARACTERISTICS OF TROPONIN CARDIAC MARKERS
TABLE 26 CARDIAC MARKER TESTING MARKET FOR TROPONIN I AND T, BY REGION, 2018–2025 (USD MILLION)
TABLE 27 CARDIAC MARKER TESTING MARKET FOR TROPONIN I AND T, BY DISEASE, 2018–2025 (USD MILLION)
TABLE 28 CARDIAC MARKER TESTING MARKET FOR TROPONIN I AND T, BY END USER, 2018–2025 (USD MILLION)
7.3 CK-MB
7.3.1 CK-MB IS USEFUL FOR THE DIAGNOSIS OF ACUTE MYOCARDIAL INJURY
TABLE 29 CHARACTERISTICS OF CK-MB CARDIAC MARKERS
TABLE 30 CARDIAC MARKER TESTING MARKET FOR CK-MB, BY REGION, 2018–2025 (USD MILLION)
TABLE 31 CARDIAC MARKER TESTING MARKET FOR CK-MB, BY DISEASE, 2018–2025 (USD MILLION)
TABLE 32 CARDIAC MARKER TESTING MARKET FOR CK-MB, BY END USER, 2018–2025 (USD MILLION)
7.4 BNP AND NT-PROBNP
7.4.1 THE ABILITY OF THIS BIOMARKER TO BE USED WITH OTHER MARKERS IS SUPPORTING MARKET GROWTH
TABLE 33 CARDIAC MARKER TESTING MARKET FOR BNP AND NT-PROBNP, BY REGION, 2018–2025 (USD MILLION)
TABLE 34 CARDIAC MARKER TESTING MARKET FOR BNP AND NT-PROBNP, BY DISEASE, 2018–2025 (USD MILLION)
TABLE 35 CARDIAC MARKER TESTING MARKET FOR BNP AND NT-PROBNP, BY END USER, 2018–2025 (USD MILLION)
7.5 MYOGLOBIN
7.5.1 RAPID INCREASE AND NORMALIZATION ASSOCIATED WITH MYOGLOBIN TO DRIVE MARKET GROWTH
TABLE 36 CHARACTERISTICS OF MYOGLOBIN CARDIAC MARKERS
TABLE 37 CARDIAC MARKER TESTING MARKET FOR MYOGLOBIN, BY REGION, 2018–2025 (USD MILLION)
TABLE 38 CARDIAC MARKER TESTING MARKET FOR MYOGLOBIN, BY DISEASE, 2018–2025 (USD MILLION)
TABLE 39 CARDIAC MARKER TESTING MARKET FOR MYOGLOBIN, BY END USER, 2018–2025 (USD MILLION)
7.6 HSCRP
7.6.1 ABILITY OF HSCRP TESTS TO ACCURATELY MEASURE LOW LEVELS OF CRP WILL SUPPORT MARKET GROWTH
TABLE 40 CUT-OFFS FOR CRP USING STANDARDIZED ASSAY
TABLE 41 CARDIAC MARKER TESTING MARKET FOR HSCRP, BY REGION, 2018–2025 (USD MILLION)
TABLE 42 CARDIAC MARKER TESTING MARKET FOR HSCRP, BY DISEASE, 2018–2025 (USD MILLION)
TABLE 43 CARDIAC MARKER TESTING MARKET FOR HSCRP, BY END USER, 2018–2025 (USD MILLION)
7.7 OTHER BIOMARKERS
TABLE 44 CARDIAC MARKER TESTING MARKET FOR OTHER BIOMARKERS, BY REGION, 2018–2025 (USD MILLION)
TABLE 45 CARDIAC MARKER TESTING MARKET FOR OTHER BIOMARKERS, BY DISEASE, 2018–2025 (USD MILLION)
TABLE 46 CARDIAC MARKER TESTING MARKET FOR OTHER BIOMARKERS, BY END USER, 2018–2025 (USD MILLION)
8 CARDIAC MARKER TESTING MARKET, BY DISEASE (Page No. - 82)
8.1 INTRODUCTION
TABLE 47 CARDIAC MARKER TESTING MARKET, BY DISEASE, 2018–2025 (USD MILLION)
8.2 MYOCARDIAL INFARCTION
8.2.1 AVAILABILITY OF HIGH-SENSITIVITY BIOMARKERS FOR THE DETECTION OF MI TO SUPPORT MARKET GROWTH
TABLE 48 CARDIAC MARKER TESTING MARKET FOR MYOCARDIAL INFARCTION, BY REGION, 2018–2025 (USD MILLION)
8.3 CONGESTIVE HEART FAILURE
8.3.1 GROWING USE OF MULTI-MARKER TESTING IS DRIVING MARKET GROWTH
TABLE 49 CARDIAC MARKER TESTING MARKET FOR CONGESTIVE HEART FAILURE, BY REGION, 2018–2025 (USD MILLION)
8.4 ACUTE CORONARY SYNDROME
8.4.1 INCREASING INCIDENCE OF RISK FACTORS ASSOCIATED WITH ACS TO DRIVE THE ADOPTION OF CARDIAC MARKERS
TABLE 50 CARDIAC MARKER TESTING MARKET FOR ACUTE CORONARY SYNDROME, BY REGION, 2018–2025 (USD MILLION)
8.5 ATHEROSCLEROSIS
8.5.1 HIGH PREVALENCE OF ATHEROSCLEROSIS WILL PROPEL THE ADOPTION OF CARDIAC MARKERS
TABLE 51 CARDIAC MARKER TESTING MARKET FOR ATHEROSCLEROSIS, BY REGION, 2018–2025 (USD MILLION)
8.6 ISCHEMIA
8.6.1 MULTIPLE COMPLICATIONS CAUSED BY ISCHEMIA IS RESULTING IN THE INCREASED ADOPTION OF DIAGNOSTICS TESTS
TABLE 52 CARDIAC MARKER TESTING MARKET FOR ISCHEMIA, BY REGION, 2018–2025 (USD MILLION)
9 CARDIAC MARKER TESTING MARKET, BY END USER (Page No. - 89)
9.1 INTRODUCTION
TABLE 53 CARDIAC MARKER TESTING MARKET, BY END USER, 2018–2025 (USD MILLION)
9.2 LABORATORY TESTING FACILITIES
TABLE 54 CARDIAC MARKER TESTING MARKET FOR LABORATORY TESTING FACILITIES, BY TYPE, 2018–2025 (USD MILLION)
TABLE 55 CARDIAC MARKER TESTING MARKET FOR LABORATORY TESTING FACILITIES, BY REGION, 2018–2025 (USD MILLION)
9.2.1 HOSPITAL LABORATORIES
9.2.1.1 Emergency patient care and early diagnosis associated with in-house labs to drive market growth
TABLE 56 CARDIAC MARKER TESTING MARKET FOR HOSPITAL LABORATORIES, BY REGION, 2018–2025 (USD MILLION)
9.2.2 REFERENCE LABORATORIES
9.2.2.1 Cost and time savings associated with reference laboratories to support market growth
TABLE 57 CARDIAC MARKER TESTING MARKET FOR REFERENCE LABORATORIES, BY REGION, 2018–2025 (USD MILLION)
9.2.3 CONTRACT TESTING LABORATORIES
9.2.3.1 Access to a wide range of tests in such settings allows multiple tests to be performed
TABLE 58 CARDIAC MARKER TESTING MARKET FOR CONTRACT TESTING LABORATORIES, BY REGION, 2018–2025 (USD MILLION)
9.3 ACADEMIC INSTITUTES
9.3.1 CONTINUOUS RESEARCH & DEVELOPMENT OF NOVEL BIOMARKERS TO DRIVE MARKET GROWTH
TABLE 59 CARDIAC MARKER TESTING MARKET FOR ACADEMIC INSTITUTES, BY REGION, 2018–2025 (USD MILLION)
9.4 POINT-OF-CARE TESTING FACILITIES
9.4.1 EARLY DETECTION AND LOWER TURNAROUND TEST TIME WILL DRIVE MARKET GROWTH
TABLE 60 CARDIAC MARKER TESTING MARKET FOR POC TESTING FACILITIES, BY REGION, 2018–2025 (USD MILLION)
10 CARDIAC MARKER TESTING MARKET, BY REGION (Page No. - 96)
10.1 INTRODUCTION
TABLE 61 CARDIAC MARKER TESTING MARKET, BY REGION, 2018-2025 (USD MILLION)
10.2 NORTH AMERICA
FIGURE 21 NORTH AMERICA: CARDIAC MARKER TESTING MARKET SNAPSHOT
TABLE 62 NORTH AMERICA: CARDIAC MARKER TESTING MARKET, BY COUNTRY, 2018–2025 (USD MILLION)
TABLE 63 NORTH AMERICA: CARDIAC MARKER TESTING MARKET, BY BIOMARKER TYPE, 2018–2025 (USD MILLION)
TABLE 64 NORTH AMERICA: CARDIAC MARKER TESTING MARKET, BY PRODUCT, 2018–2025 (USD MILLION)
TABLE 65 NORTH AMERICA: CARDIAC MARKER TESTING INSTRUMENTS MARKET, BY TECHNOLOGY, 2018–2025 (USD MILLION)
TABLE 66 NORTH AMERICA: CARDIAC MARKER TESTING MARKET, BY END USER, 2018–2025 (USD MILLION)
10.2.1 US
10.2.1.1 Increasing public-private investments for cardiac biomarker research to drive market growth
TABLE 67 US: CARDIAC MARKER TESTING MARKET, BY PRODUCT, 2018–2025 (USD MILLION)
10.2.2 CANADA
10.2.2.1 Increasing government initiatives to support the cardiac marker testing market in Canada
TABLE 68 CANADA: CARDIAC MARKER TESTING MARKET, BY PRODUCT, 2018–2025 (USD MILLION)
10.3 EUROPE
TABLE 69 EUROPE: CARDIAC MARKER TESTING MARKET, BY COUNTRY, 2018–2025 (USD MILLION)
TABLE 70 EUROPE: CARDIAC MARKER TESTING MARKET, BY BIOMARKER TYPE, 2018–2025 (USD MILLION)
TABLE 71 EUROPE: CARDIAC MARKER TESTING MARKET, BY PRODUCT, 2018–2025 (USD MILLION)
TABLE 72 EUROPE: CARDIAC MARKER TESTING INSTRUMENTS MARKET, BY TECHNOLOGY, 2018–2025 (USD MILLION)
TABLE 73 EUROPE: CARDIAC MARKER TESTING MARKET, BY END USER, 2018–2025 (USD MILLION)
10.3.1 GERMANY
10.3.1.1 Higher healthcare spending to fuel diagnostic testing
TABLE 74 GERMANY: CARDIAC MARKER TESTING MARKET, BY PRODUCT, 2018–2025 (USD MILLION)
10.3.2 UK
10.3.2.1 Increasing number of accredited clinical laboratories to increase the adoption of cardiac marker tests in the country
TABLE 75 UK: CARDIAC MARKER TESTING MARKET, BY PRODUCT, 2018–2025 (USD MILLION)
10.3.3 FRANCE
10.3.3.1 Increasing demand for early disease diagnosis to drive market growth
TABLE 76 FRANCE: CARDIAC MARKER TESTING MARKET, BY PRODUCT, 2018–2025 (USD MILLION)
10.3.4 ITALY
10.3.4.1 Increasing prevalence of chronic and infectious diseases to drive market growth
TABLE 77 ITALY: CARDIAC MARKER TESTING MARKET, BY PRODUCT, 2018–2025 (USD MILLION)
10.3.5 SPAIN
10.3.5.1 Rising geriatric population in the country to support market growth
TABLE 78 SPAIN: CARDIAC MARKER TESTING MARKET, BY PRODUCT, 2018–2025 (USD MILLION)
10.3.6 REST OF EUROPE (ROE)
TABLE 79 REST OF EUROPE: CARDIAC MARKER TESTING MARKET, BY PRODUCT, 2018–2025 (USD MILLION)
10.4 ASIA PACIFIC
FIGURE 22 ASIA PACIFIC: CARDIAC MARKER TESTING MARKET SNAPSHOT
TABLE 80 ASIA PACIFIC: CARDIAC MARKER TESTING MARKET, BY COUNTRY, 2018–2025 (USD MILLION)
TABLE 81 ASIA PACIFIC: CARDIAC MARKER TESTING MARKET, BY BIOMARKER TYPE, 2018–2025 (USD MILLION)
TABLE 82 ASIA PACIFIC: CARDIAC MARKER TESTING MARKET, BY PRODUCT, 2018–2025 (USD MILLION)
TABLE 83 ASIA PACIFIC: CARDIAC MARKER TESTING INSTRUMENTS MARKET, BY TECHNOLOGY, 2018–2025 (USD MILLION)
TABLE 84 ASIA PACIFIC: CARDIAC MARKER TESTING MARKET, BY END USER, 2018–2025 (USD MILLION)
10.4.1 JAPAN
10.4.1.1 Presence of a well-developed healthcare system to drive market growth in Japan
TABLE 85 JAPAN: CARDIAC MARKER TESTING MARKET, BY PRODUCT, 2018–2025 (USD MILLION)
10.4.2 CHINA
10.4.2.1 Increasing disposable income of the Chinese population to fuel market growth
TABLE 86 CHINA: CARDIAC MARKER TESTING MARKET, BY PRODUCT, 2018–2025 (USD MILLION)
10.4.3 INDIA
10.4.3.1 Presence of a large patient population to fuel the demand for cardiac marker testing in the country
TABLE 87 INDIA: CARDIAC MARKER TESTING MARKET, BY PRODUCT, 2018–2025 (USD MILLION)
10.4.4 SOUTH KOREA
10.4.4.1 Growing number of private hospitals and independent testing laboratories to drive market growth
TABLE 88 SOUTH KOREA: CARDIAC MARKER TESTING MARKET, BY PRODUCT, 2018–2025 (USD MILLION)
10.4.5 AUSTRALIA
10.4.5.1 High healthcare expenditure in the country to support market growth
TABLE 89 AUSTRALIA: CARDIAC MARKER TESTING MARKET, BY PRODUCT, 2018–2025 (USD MILLION)
10.4.6 REST OF ASIA PACIFIC (ROAPAC)
TABLE 90 REST OF ASIA PACIFIC: CARDIAC MARKER TESTING MARKET, BY PRODUCT, 2018–2025 (USD MILLION)
10.5 LATIN AMERICA
TABLE 91 LATIN AMERICA: CARDIAC MARKER TESTING MARKET, BY COUNTRY, 2018–2025 (USD MILLION)
TABLE 92 LATIN AMERICA: CARDIAC MARKER TESTING MARKET, BY BIOMARKER TYPE, 2018–2025 (USD MILLION)
TABLE 93 LATIN AMERICA: CARDIAC MARKER TESTING MARKET, BY PRODUCT, 2018–2025 (USD MILLION)
TABLE 94 LATIN AMERICA: CARDIAC MARKER TESTING INSTRUMENTS MARKET, BY TECHNOLOGY, 2018–2025 (USD MILLION)
TABLE 95 LATIN AMERICA: CARDIAC MARKER TESTING MARKET, BY END USER, 2018–2025 (USD MILLION)
10.5.1 BRAZIL
10.5.1.1 Rising investments by leading IVD manufacturers in the country to drive market growth
TABLE 96 BRAZIL: CARDIAC MARKER TESTING MARKET, BY PRODUCT, 2018–2025 (USD MILLION)
10.5.2 MEXICO
10.5.2.1 Availability of technologically advanced IVD products in the country to propel market growth
TABLE 97 MEXICO: CARDIAC MARKER TESTING MARKET, BY PRODUCT, 2018–2025 (USD MILLION)
10.5.3 REST OF LATIN AMERICA
TABLE 98 REST OF LATIN AMERICA: CARDIAC MARKER TESTING MARKET, BY PRODUCT, 2018–2025 (USD MILLION)
10.6 MIDDLE EAST & AFRICA
10.6.1 IMPROVING HEALTHCARE INFRASTRUCTURE TO DRIVE MARKET GROWTH
TABLE 99 MIDDLE EAST & AFRICA: CARDIAC MARKER TESTING MARKET, BY BIOMARKER TYPE, 2018–2025 (USD MILLION)
TABLE 100 MIDDLE EAST & AFRICA: CARDIAC MARKER TESTING MARKET, BY PRODUCT, 2018–2025 (USD MILLION)
TABLE 101 MIDDLE EAST & AFRICA: CARDIAC MARKER TESTING INSTRUMENTS MARKET, BY TECHNOLOGY, 2018–2025 (USD MILLION)
TABLE 102 MIDDLE EAST & AFRICA: CARDIAC MARKER TESTING MARKET, BY END USER, 2018–2025 (USD MILLION)
11 COMPETITIVE LANDSCAPE (Page No. - 122)
11.1 INTRODUCTION
11.2 STRATEGIC OVERVIEW
FIGURE 23 KEY DEVELOPMENTS IN THE CARDIAC MARKER TESTING MARKET, 2017- 2020
11.3 MARKET SHARE ANALYSIS
FIGURE 24 CARDIAC MARKER TESTING MARKET SHARE, BY KEY PLAYER, 2019
11.4 COMPETITIVE SCENARIO
11.5 KEY MARKET DEVELOPMENTS
11.5.1 PRODUCT LAUNCHES AND APPROVALS
11.5.2 ACQUISITIONS
11.5.3 PARTNERSHIPS, COLLABORATIONS, AND AGREEMENTS
11.5.4 EXPANSIONS
12 COMPANY EVALUATION MATRIX AND COMPANY PROFILES (Page No. - 127)
12.1 COMPANY EVALUATION MATRIX
12.1.1 STARS
12.1.2 EMERGING LEADERS
12.1.3 EMERGING COMPANIES
12.1.4 PERVASIVE
FIGURE 25 CARDIAC MARKER TESTING MARKET: COMPETITIVE LEADERSHIP MAPPING, 2019
12.2 COMPANY PROFILES
(Business overview, Products offered, Recent developments, MNM view)*
12.2.1 ABBOTT LABORATORIES
FIGURE 26 ABBOTT LABORATORIES: COMPANY SNAPSHOT (2019)
12.2.2 BECTON, DICKINSON AND COMPANY
FIGURE 27 BECTON, DICKINSON AND COMPANY: COMPANY SNAPSHOT (2019)
12.2.3 BIOMÉRIEUX SA
FIGURE 28 BIOMÉRIEUX SA: COMPANY SNAPSHOT (2019)
12.2.4 BIO-RAD LABORATORIES, INC.
FIGURE 29 BIO-RAD LABORATORIES: COMPANY SNAPSHOT (2019)
12.2.5 DANAHER CORPORATION
FIGURE 30 DANAHER CORPORATION: COMPANY SNAPSHOT (2019)
12.2.6 DIASORIN
FIGURE 31 DIASORIN: COMPANY SNAPSHOT (2019)
12.2.7 F. HOFFMANN-LA ROCHE AG
FIGURE 32 F. HOFFMANN-LA ROCHE AG: COMPANY SNAPSHOT (2019)
12.2.8 GUANGZHOU WONDFO BIOTECH CO., LTD.
12.2.9 LSI MEDIENCE CORPORATION
FIGURE 33 MITSUBISHI CHEMICAL HOLDINGS CORPORATION: COMPANY SNAPSHOT (2019)
12.2.10 ORTHO CLINICAL DIAGNOSTICS
12.2.11 PERKINELMER, INC.
FIGURE 34 PERKINELMER: COMPANY SNAPSHOT (2019)
12.2.12 RANDOX LABORATORIES
12.2.13 SIEMENS HEALTHINEERS AG
FIGURE 35 SIEMENS HEALTHINEERS AG: COMPANY SNAPSHOT (2019)
12.2.14 THERMO FISHER SCIENTIFIC
FIGURE 36 THERMO FISHER SCIENTIFIC: COMPANY SNAPSHOT (2019)
12.2.15 TOSOH CORPORATION
FIGURE 37 TOSOH CORPORATION: COMPANY SNAPSHOT (2019)
*Business overview, Products offered, Recent developments, MNM view might not be captured in case of unlisted companies.
13 APPENDIX (Page No. - 159)
13.1 DISCUSSION GUIDE
13.2 KNOWLEDGE STORE: MARKETSANDMARKETS’ SUBSCRIPTION PORTAL
13.3 AVAILABLE CUSTOMIZATIONS
13.4 RELATED REPORTS
13.5 AUTHOR DETAILS
The study involved four major activities to estimate the current size of the cardiac marker testing market. Exhaustive secondary research was carried out to collect information on the market and its different subsegments. The next step was to validate these findings, assumptions, and sizing with industry experts across the value chain through primary research. Top-down and bottom-up approaches were employed to estimate the complete market size. Thereafter, market breakdown and data triangulation procedures were used to estimate the size of segments and subsegments.
In the secondary research process, various secondary sources, such as annual reports, press releases & investor presentations of companies, white papers, certified publications, articles by recognized authors, gold-standard & silver-standard websites, regulatory bodies, and databases (such as D&B Hoovers, Bloomberg Business, and Factiva) were referred to in order to identify and collect information for the cardiac marker testing market study.
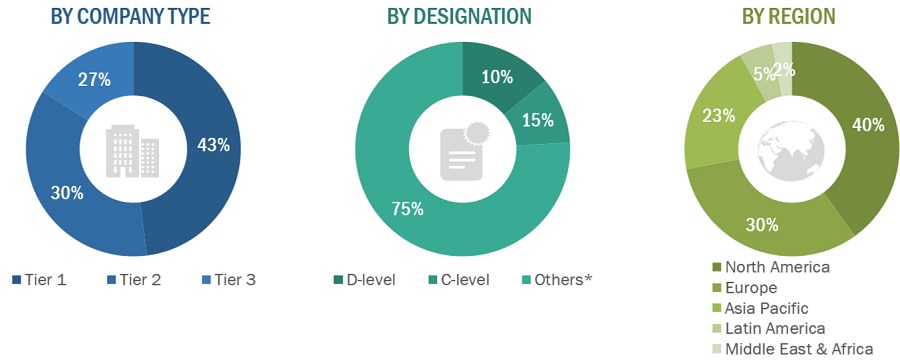
The cardiac marker testing market comprises several stakeholders such as diagnostic & pathology laboratories, clinical testing facilities, research laboratories and academic institutions, and point-of-care testing laboratories. The demand side of this market is characterized growing incidence of cardiovascular diseases, rapidly increasing geriatric population, growing funding from public and private organizations for research on cardiac biomarkers, and ongoing clinical trials for the identification of novel cardiac biomarkers. Various primary sources from both the supply and demand sides of the market were interviewed to obtain qualitative and quantitative information. The following is the breakdown of primary respondents:
To know about the assumptions considered for the study, download the pdf brochure
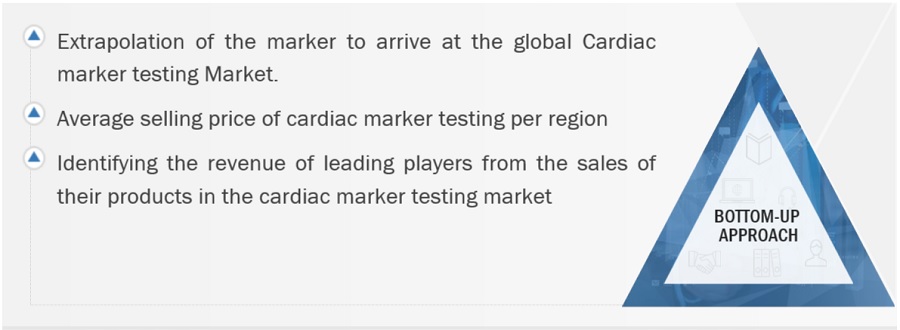
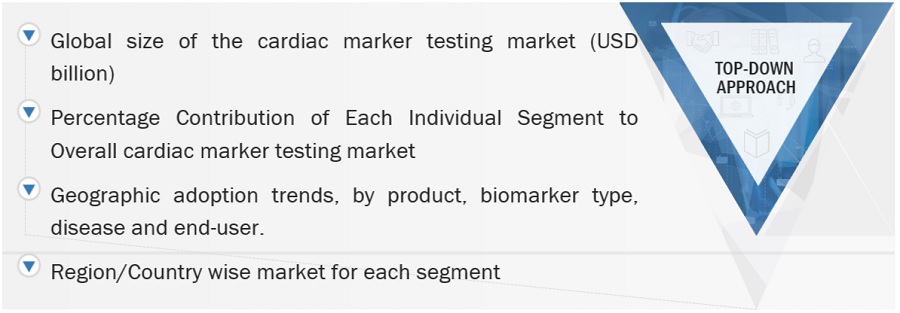
Both top-down and bottom-up approaches were used to estimate and validate the total size of the cardiac marker testing market. These methods were also used extensively to estimate the size of various subsegments in the market. The research methodology used to estimate the market size includes the following:
After arriving at the overall market size-using the market size estimation processes as explained above-the cardiac marker testing market was split into several segments and subsegments. In order to complete the overall market engineering process and arrive at the exact statistics of each market segment and subsegment, data triangulation and market breakdown procedures were employed, wherever applicable. The data was triangulated by studying various factors and trends from both the demand and supply sides in the cardiac marker testing industry.
With the given market data, MarketsandMarkets offers customizations as per the company’s specific needs. The following customization options are available for the cardiac marker testing market report:
Benchmarking the rapid strategy shifts of the Top 100 companies in the Cardiac Marker Testing Market
Request For Special Pricing
Growth opportunities and latent adjacency in Cardiac Marker Testing Market