Cartilage Repair Market | Cartilage Regeneration Market by Treatment Modalities (Cell-Based (Chondrocyte Transplantation, Stem Cells, Growth Factors), Non-Cell (Tissue Scaffolds)), Application (Hyaline, Fibrocartilage), Site, and Region - Global Forecast to 2028
Market Growth Outlook Summary
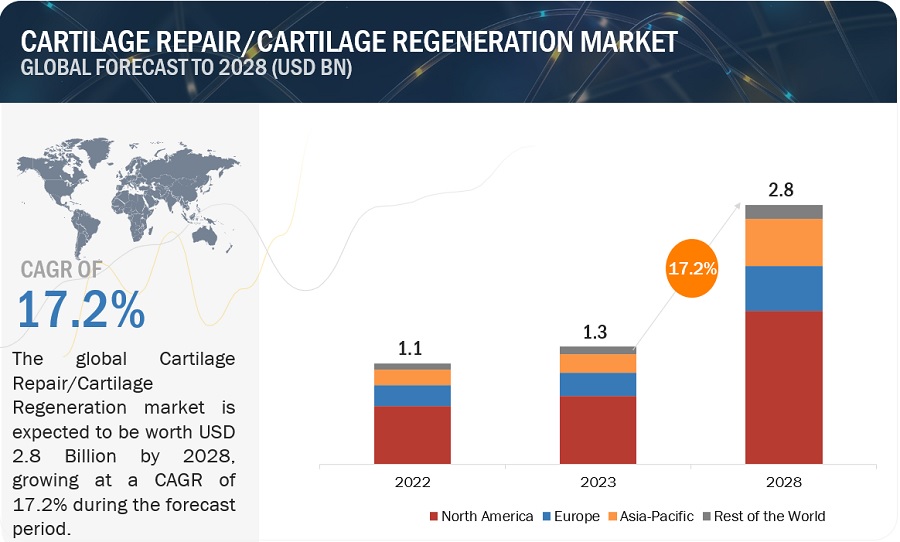
The global cartilage repair market, valued at US$1.1 billion in 2022, stood at US$1.3 billion in 2023 and is projected to advance at a resilient CAGR of 17.2% from 2023 to 2028, culminating in a forecasted valuation of US$2.8 billion by the end of the period. Growth in this market is mainly driven by the Increasing incidence of osteoarthritis, Increasing research funding and investments and the rising number of sports and accident-related orthopedic injuries.
Attractive Opportunities in the Cartilage Repair Market
To know about the assumptions considered for the study, Request for Free Sample Report
Global Cartilage Repair Market Dynamics
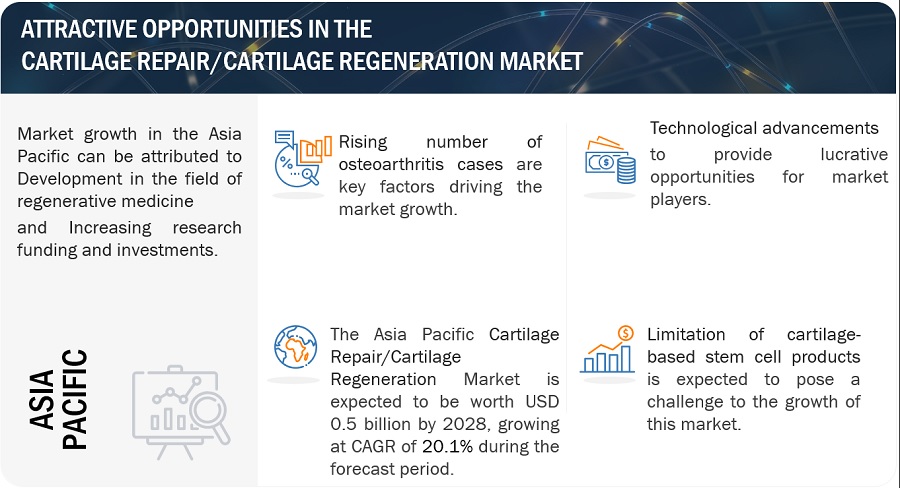
Driver: Increasing number of osteoarthritis cases
Over the years, the incidence of osteoarthritis has increased across the globe. According to WHO data from July 2023, about 528 million people worldwide were living with osteoarthritis in 2019, an increase of 113% since 1990. About 73% of people living with osteoarthritis are older than 55 years, and 60% are female. With a prevalence of 365 million, the knee is the most frequently affected joint, followed by the hip and the hand.
According to the Lancet (August 2023), a new study revealed the most common form of arthritis, osteoarthritis, affects 15% of the global population over the age of 30. In 2020, obesity was responsible for approximately 20% of the disability of osteoarthritis. By 2050, nearly 1 billion people are projected to have osteoarthritis.
Some of the most used treatments for osteoarthritis are autologous chondrocyte implantation and scaffold implants. Thus, the increasing incidence of osteoarthritis is expected to drive the demand for cartilage repair and regeneration products.
Restraint: High cost of cartilage repair surgeries
Cartilage repair surgeries are costly though they have better and longer-lasting treatment results as compared to total knee replacement surgeries. As the high cost of cartilage repair therapies is the major factor that is limiting their adoption of the cartilage repair procedures mainly in the developing countries. Therefore, knee replacement procedures average cost is around USD 16,000 where as cartilage repair procedures average cost is approximately USD 18,000–USD 23,000. These barriers may be more pronounced in low-resource settings and developing countries, which is restricting the growth of the cartilage repair market.
Opportunity: Technological advancements
The number of companies are currently focusing on the research and development for the cartilage repair therapies for advance treatment offered for cartilage demage and injury. Therefore, currently the number of clinical trials for the development of new technologies for cartilage regeneration has increased which drive the in market growth of global cartilage repair/cartilage regeneration. For instance, According to the Royal Society of Chemistry, in 2023, a global patient population of ~250 million people has shown an increasing demand for new therapies with excellent results, and tissue engineering scaffolds have been proposed as a potential strategy for the repair and reconstruction of cartilage defects. The precise control and high flexibility of 3D printing provide a platform for subversive innovation. In this perspective, cartilage tissue engineering (CTE) scaffolds manufactured using different biomaterials are summarized from the perspective of 3D printing strategies.
Challenge: Limitations of cartilage-based stem cell products
Clinical research are ongoing to identify an universal source of progenitor cells like embryonic and induced pluripotent stem cells for the treatment of cartilage repair. However, there are challenges associated with their clinical use like immune rejection, tumorigenesis, and teratoma formation as various authorities such as the Human Tissue Authority (HTA), Human Fertilization and Embryology Authority (HFEA), Medicines and Healthcare Products Regulatory Agency (MHRA), and the Central Ethics Committee for Stem Cell Research to monitor these activities have been formulated. Hence, due to the presence of these regulatory organizations and ethical concerns on the use of embryonic stem cells in research and development is restricted globally.
Cartilage Regeneration Market Ecosystem
Prominent companies in this market include well-established manufacturers of Cartilage Regeneration Market and offer a wide range of products. These companies have been operating in the market for several years and possess a diversified product portfolio, state-of-the-art technologies, and strong global sales and marketing networks. Prominent companies in this market include Smith+Nephew (UK), DePuy Synthes (Johnson & Johnson) (US), Zimmer Biomet Holdings, Inc. (US), Stryker Corporation (US), and Vericel Corporation (US).
In 2022, Hyaline Cartilage segment to observe highest growth rate of the cartilage regeneration industry, by Application.
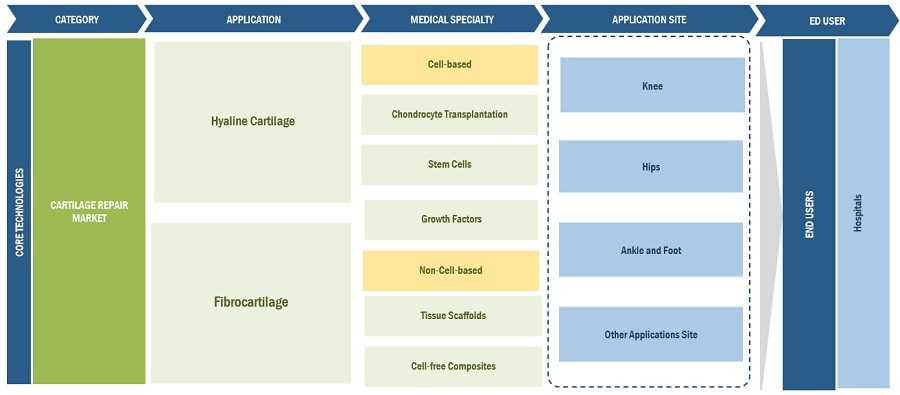
Based on the Application, The cartilage repair market, by application, has been segmented into Hyaline Cartilage and Fibrocartilage. Hyaline Cartilage will drive the growth of the market due to growing number of contracts and agreements between key market players and the availability of funding and rising investment in the research and development of the advancement of tissue-engineered products for the treatment of cartilage injury/damage.
In 2022, Knee segment to dominate the cartilage repair industry, by the Application site.
Based on Application site, the cartilage regeneration market is segmented knee, hip, Ankle and foot and other application site. Knee segment is expected to grow highest due to the increasing number of Knee arthroscopy procedures. As Arthroscopic surgery is often used for cartilage reattachment as well as the microfracture technique.
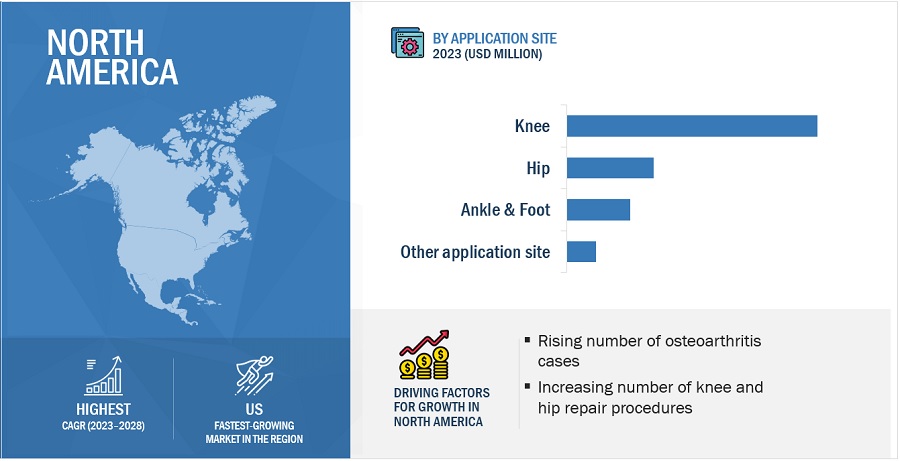
In 2022, North America to dominate the cartilage repair industry, by the Application site as knee segment had the highest growth the region.
The global cartilage repair market is segmented into North America, Europe, Asia Pacific, and Rest of the World. North America market is expected to rise due to increasing geriatric population and the rising incidence of sport related injuries, alongside an increasing number of knee and hip repair procedures supporting the growth of this market.
To know about the assumptions considered for the study, download the pdf brochure
The cartilage repair market is dominated by players such as Smith+Nephew (UK), DePuy Synthes (Johnson & Johnson) (US), Zimmer Biomet Holdings, Inc. (US), Stryker Corporation (US), and Vericel Corporation (US).
Cartilage Repair Market Report Scope
|
Report Metric |
Details |
|
Market Revenue in 2023 |
$1.3 billion |
|
Projected Revenue by 2028 |
$2.8 billion |
|
Revenue Rate |
Poised to Grow at a CAGR of 17.2% |
|
Market Driver |
Increasing number of osteoarthritis cases |
|
Market Opportunity |
Technological advancements |
This research report categorizes the cartilage repair market into the following segments and subsegments:
By Region
- North America
- Europe
- Asia Pacific
- Rest of the World
By Treatment Modality
-
Cell-based
- Chondrocyte Transplantation
- Stem Cells
- Growth Factors
-
Non-cell-based
- Tissue Scaffolds
- Cell-free Composites
By Application
- Knee
- Hip
- Ankle and Foot
- Other Application Sites
By Application Site
- Hyaline Cartilage
- Fibrocartilage
Frequently Asked Questions (FAQ):
What is the projected growth rate of the global cartilage repair market between 2023 and 2028?
The global cartilage repair market is projected to grow from USD 1.3 billion in 2023 to USD 2.8 billion by 2028, demonstrating a robust CAGR of 17.2%.
What factors are driving the growth of the cartilage repair market?
Key factors driving the cartilage repair market include the rising incidence of osteoarthritis, especially among the elderly, increased healthcare spending in emerging markets, and technological advancements in treatment modalities.
What challenges does the cartilage repair market face?
The market faces challenges such as the high cost of cartilage repair surgeries, which can deter patients from opting for these procedures, particularly in developing countries where healthcare budgets are constrained.
Which regions are expected to see significant growth in the cartilage repair market?
North America is expected to dominate the cartilage repair market, particularly due to the high number of knee arthroscopy procedures. Emerging markets in Asia Pacific and Europe also show promising growth opportunities.
What types of products are commonly used in cartilage repair?
Common products in cartilage repair include autologous chondrocyte implantation, scaffold implants, tissue scaffolds, and stem cell-based therapies. These products are designed to enhance tissue regeneration and healing.
How is the increasing incidence of osteoarthritis influencing the cartilage repair market?
The growing incidence of osteoarthritis is significantly driving the demand for cartilage repair products and procedures, as more individuals seek effective treatments for joint pain and mobility issues.
What are the recent technological advancements in cartilage repair?
Recent advancements include improvements in tissue-engineered products, better techniques for chondrocyte transplantation, and innovations in stem cell therapies aimed at enhancing cartilage regeneration and repair.
How do major companies influence the cartilage repair market?
Prominent companies like Smith+Nephew, DePuy Synthes, and Zimmer Biomet play a crucial role in the market by providing a wide range of innovative products, enhancing competition, and driving research and development in cartilage repair technologies.
What types of cartilage are commonly repaired, and what is their significance?
The most commonly repaired types of cartilage are hyaline cartilage and fibrocartilage. Hyaline cartilage is significant due to its prevalence in joints and its role in joint health, while fibrocartilage is crucial for cushioning and support in various joint structures.
How do ethical concerns affect the development of cartilage-based stem cell therapies?
Ethical concerns regarding the use of embryonic stem cells, including issues of immune rejection and regulatory scrutiny, have restricted the development and clinical application of cartilage-based stem cell therapies, posing challenges for researchers and developers.
To speak to our analyst for a discussion on the above findings, click Speak to Analyst


- 5.1 INTRODUCTION
-
5.2 MARKET DYNAMICSMARKET DRIVERS- Increasing incidence of osteoarthritis- Increasing research funding and investments- Rising number of sports and accident-related orthopedic injuriesRESTRAINTS- High cost of cartilage repair surgeries- Unfavorable reimbursement scenarioOPPORTUNITIES- Technological advancements- Developments in regenerative medicineCHALLENGES- Limitations of cartilage-based stem cell products- Need for skilled personnel
- 5.3 SUPPLY CHAIN ANALYSIS
-
5.4 REGULATORY LANDSCAPEINTRODUCTIONNORTH AMERICAEUROPEASIA PACIFIC
-
5.5 PATENT ANALYSIS
-
5.6 PIPELINE ANALYSISPIPELINE ANALYSIS, BY CLINICAL TRIAL PHASE
- 5.7 TECHNOLOGY ANALYSIS
- 6.1 INTRODUCTION
-
6.2 CELL-BASED CARTILAGE REPAIR/CARTILAGE REGENERATIONCHONDROCYTE TRANSPLANTATION- Cost-effectiveness to support market growthGROWTH FACTORS- Promising results associated with growth factors to drive marketSTEM CELLS- Advancements in stem cell-based tissue engineering to support market growth
-
6.3 NON-CELL-BASED CARTILAGE REPAIR/CARTILAGE REGENERATIONTISSUE SCAFFOLDS- Benefits of one-step procedure likely to boost market growthCELL-FREE COMPOSITES- Increasing research to support market growth
- 7.1 INTRODUCTION
-
7.2 KNEEINCREASING CASES OF KNEE ARTHROSCOPY TO DRIVE MARKET GROWTH
-
7.3 HIPINCREASING ADOPTION OF MINIMALLY INVASIVE ARTHROSCOPY PROCEDURES TO SUPPORT MARKET GROWTH
-
7.4 ANKLE & FOOTINCREASING SPORTS INJURIES TO DRIVE DEMAND
- 7.5 OTHER APPLICATION SITES
- 8.1 INTRODUCTION
-
8.2 HYALINE CARTILAGEHYALINE CARTILAGE SEGMENT TO HOLD LARGER MARKET SHARE
-
8.3 FIBROCARTILAGESUPPORT AND STRENGTH ADVANTAGES FOR SURROUNDING STRUCTURES TO DRIVE MARKET
- 9.1 INTRODUCTION
-
9.2 NORTH AMERICANORTH AMERICA: RECESSION IMPACTUS- Increasing incidence of osteoporosis to drive marketCANADA- Increasing investments in regenerative medicine research to drive market
-
9.3 EUROPEEUROPE: RECESSION IMPACTGERMANY- Strong R&D base and focus on minimally invasive surgeries to support market growthUK- Rising prevalence of joint diseases to boost demandFRANCE- Rising degenerative disease and healthcare expenditure to drive marketREST OF EUROPE
-
9.4 ASIA PACIFICASIA PACIFIC: RECESSION IMPACTJAPAN- Japan to hold largest market share throughout forecast periodCHINA- China to register highest growth in APAC marketINDIA- Rising number of hospitals and developing healthcare infrastructure to propel market growthREST OF ASIA PACIFIC
-
9.5 REST OF THE WORLDREST OF THE WORLD: RECESSION IMPACT

- 10.1 INTRODUCTION
- 10.2 REVENUE ANALYSIS
- 10.3 MARKET SHARE ANALYSIS
-
10.4 COMPANY EVALUATION MATRIXSTARSEMERGING LEADERSPERVASIVE PLAYERSPARTICIPANTS
-
10.5 COMPETITIVE SCENARIOPRODUCT APPROVALSDEALSOTHER DEVELOPMENTS
-
11.1 KEY COMPANIESSMITH+NEPHEW- Business overview- Products/Solutions/Services offered- Recent developments- MnM viewDEPUY SYNTHES (JOHNSON & JOHNSON)- Business overview- Products/Solutions/Services offered- Recent developments- MnM viewZIMMER BIOMET HOLDINGS, INC.- Business overview- Products/Solutions/Services offered- Recent developments- MnM viewSTRYKER CORPORATION- Business overview- Products/Solutions/Services offered- Recent developmentsVERICEL CORPORATION- Business overview- Products/Solutions/Services offered- Recent developmentsB. BRAUN MELSUNGEN AG- Business overview- Products/Solutions/Services offeredANIKA THERAPEUTICS, INC.- Business overview- Products/Solutions/Services offeredRTI SURGICAL- Business overview- Products/Solutions/Services offered- Recent developmentsCONMED CORPORATION- Business overview- Products/Solutions/Services offered- Recent developmentsARTHREX INC.- Business overview- Products/Solutions/Services offeredREGROW BIOSCIENCES- Business overview- Products/Solutions/Services offeredMEDIPOST- Business overview- Products/solutions/services offered- Recent developments
-
11.2 OTHER PLAYERSGEISTLICH PHARMA AGALLOSOURCEORTHOCELL LTD.CARTIHEAL, INC.REGENTIS BIOMATERIALSLIFENET HEALTHMATRICEL GMBHTHERACELL ADVANCED BIOTECHNOLOGY
- 12.1 DISCUSSION GUIDE
- 12.2 KNOWLEDGESTORE: MARKETSANDMARKETS’ SUBSCRIPTION PORTAL
- 12.3 CUSTOMIZATION OPTIONS
- 12.4 RELATED REPORTS
- 12.5 AUTHOR DETAILS
- TABLE 1 INCLUSIONS AND EXCLUSIONS
- TABLE 2 REVENUE ESTIMATION APPROACH BY CALCULATING NUMBER OF CARTILAGE REPAIR TREATMENTS PROCEDURES IN US
- TABLE 3 CLASSIFICATION BASED ON SUBMISSION REQUIRED FOR REGULATORY APPROVAL
- TABLE 4 INDICATIVE LIST OF CANDIDATES IN CLINICAL TRIALS
- TABLE 5 CARTILAGE REPAIR/CARTILAGE REGENERATION MARKET, BY TREATMENT MODALITY, 2021–2028 (USD MILLION)
- TABLE 6 CELL-BASED CARTILAGE REPAIR/CARTILAGE REGENERATION MARKET, BY TYPE, 2021–2028 (USD MILLION)
- TABLE 7 CELL-BASED CARTILAGE REPAIR/CARTILAGE REGENERATION MARKET, BY REGION, 2021–2028 (USD MILLION)
- TABLE 8 NORTH AMERICA: CELL-BASED CARTILAGE REPAIR/CARTILAGE REGENERATION MARKET, BY COUNTRY, 2021–2028 (USD MILLION)
- TABLE 9 EUROPE: CELL-BASED CARTILAGE REPAIR/CARTILAGE REGENERATION MARKET, BY COUNTRY, 2021–2028 (USD MILLION)
- TABLE 10 ASIA PACIFIC: CELL-BASED CARTILAGE REPAIR/CARTILAGE REGENERATION MARKET, BY COUNTRY, 2021–2028 (USD MILLION)
- TABLE 11 CHONDROCYTE TRANSPLANTATION MARKET, BY REGION, 2021–2028 (USD MILLION)
- TABLE 12 NORTH AMERICA: CHONDROCYTE TRANSPLANTATION MARKET, BY COUNTRY, 2021–2028 (USD MILLION)
- TABLE 13 GROWTH FACTORS MARKET, BY REGION, 2021–2028 (USD MILLION)
- TABLE 14 NORTH AMERICA: GROWTH FACTORS MARKET, BY COUNTRY, 2021–2028 (USD MILLION)
- TABLE 15 STEM CELLS MARKET, BY REGION, 2021–2028 (USD MILLION)
- TABLE 16 NORTH AMERICA: STEM CELLS MARKET, BY COUNTRY, 2021–2028 (USD MILLION)
- TABLE 17 NON-CELL-BASED CARTILAGE REPAIR/CARTILAGE REGENERATION MARKET, BY TYPE, 2021–2028 (USD MILLION)
- TABLE 18 NON-CELL-BASED CARTILAGE REPAIR/CARTILAGE REGENERATION MARKET, BY REGION, 2021–2028 (USD MILLION)
- TABLE 19 NORTH AMERICA: NON-CELL-BASED CARTILAGE REPAIR/CARTILAGE REGENERATION MARKET, BY COUNTRY, 2021–2028 (USD MILLION)
- TABLE 20 EUROPE: NON-CELL-BASED CARTILAGE REPAIR/CARTILAGE REGENERATION MARKET, BY COUNTRY, 2021–2028 (USD MILLION)
- TABLE 21 ASIA PACIFIC: NON-CELL-BASED CARTILAGE REPAIR/CARTILAGE REGENERATION MARKET, BY COUNTRY, 2021–2028 (USD MILLION)
- TABLE 22 TISSUE SCAFFOLDS MARKET, BY REGION, 2021–2028 (USD MILLION)
- TABLE 23 CELL-FREE COMPOSITES MARKET, BY REGION, 2021–2028 (USD MILLION)
- TABLE 24 CARTILAGE REPAIR/CARTILAGE REGENERATION MARKET, BY APPLICATION SITE, 2021–2028 (USD MILLION)
- TABLE 25 KNEE CARTILAGE REPAIR/CARTILAGE REGENERATION MARKET, BY REGION, 2021–2028 (USD MILLION)
- TABLE 26 NORTH AMERICA: KNEE CARTILAGE REPAIR/CARTILAGE REGENERATION MARKET, BY COUNTRY, 2021–2028 (USD MILLION)
- TABLE 27 EUROPE: KNEE CARTILAGE REPAIR/CARTILAGE REGENERATION MARKET, BY COUNTRY, 2021–2028 (USD MILLION)
- TABLE 28 ASIA PACIFIC: KNEE CARTILAGE REPAIR/CARTILAGE REGENERATION MARKET, BY COUNTRY, 2021–2028 (USD MILLION)
- TABLE 29 HIP CARTILAGE REPAIR/CARTILAGE REGENERATION MARKET, BY REGION, 021–2028 (USD MILLION)
- TABLE 30 NORTH AMERICA: HIP CARTILAGE REPAIR/CARTILAGE REGENERATION MARKET, BY COUNTRY, 2021–2028 (USD MILLION)
- TABLE 31 EUROPE: HIP CARTILAGE REPAIR/CARTILAGE REGENERATION MARKET, BY COUNTRY, 2021–2028 (USD MILLION)
- TABLE 32 ASIA PACIFIC: HIP CARTILAGE REPAIR/CARTILAGE REGENERATION MARKET, BY COUNTRY, 2021–2028 (USD MILLION)
- TABLE 33 ANKLE & FOOT CARTILAGE REPAIR/CARTILAGE REGENERATION MARKET, BY REGION, 2021–2028 (USD MILLION)
- TABLE 34 NORTH AMERICA: ANKLE & FOOT CARTILAGE REPAIR/CARTILAGE REGENERATION MARKET, BY COUNTRY, 2021–2028 (USD MILLION)
- TABLE 35 EUROPE: ANKLE & FOOT CARTILAGE REPAIR/CARTILAGE REGENERATION MARKET, BY COUNTRY, 2021–2028 (USD MILLION)
- TABLE 36 CARTILAGE REPAIR/CARTILAGE REGENERATION MARKET FOR OTHER APPLICATION SITES, BY REGION, 2021–2028 (USD MILLION)
- TABLE 37 NORTH AMERICA: CARTILAGE REPAIR/CARTILAGE REGENERATION MARKET FOR OTHER APPLICATION SITES, BY COUNTRY, 2021–2028 (USD MILLION)
- TABLE 38 CARTILAGE REPAIR/CARTILAGE REGENERATION MARKET, BY APPLICATION, 2021–2028 (USD MILLION)
- TABLE 39 HYALINE CARTILAGE REPAIR/CARTILAGE REGENERATION MARKET, BY REGION, 2021–2028 (USD MILLION)
- TABLE 40 NORTH AMERICA: HYALINE CARTILAGE REPAIR/CARTILAGE REGENERATION MARKET, BY COUNTRY, 2021–2028 (USD MILLION)
- TABLE 41 EUROPE: HYALINE CARTILAGE REPAIR/CARTILAGE REGENERATION MARKET, BY COUNTRY, 2021–2028 (USD MILLION)
- TABLE 42 ASIA PACIFIC: HYALINE CARTILAGE REPAIR/CARTILAGE REGENERATION MARKET, BY COUNTRY, 2021–2028 (USD MILLION)
- TABLE 43 FIBROCARTILAGE REPAIR/REGENERATION MARKET, BY REGION, 2021–2028 (USD MILLION)
- TABLE 44 NORTH AMERICA: FIBROCARTILAGE REPAIR/REGENERATION MARKET, BY COUNTRY, 2021–2028 (USD MILLION)
- TABLE 45 EUROPE: FIBROCARTILAGE REPAIR/REGENERATION MARKET, BY COUNTRY, 2021–2028 (USD MILLION)
- TABLE 46 ASIA PACIFIC: FIBROCARTILAGE REPAIR/REGENERATION MARKET, BY COUNTRY, 2021–2028 (USD MILLION)
- TABLE 47 CARTILAGE REPAIR/CARTILAGE REGENERATION MARKET, BY REGION, 2021–2028 (USD MILLION)
- TABLE 48 NORTH AMERICA: CARTILAGE REPAIR/CARTILAGE REGENERATION MARKET, BY COUNTRY, 2021–2028 (USD MILLION)
- TABLE 49 NORTH AMERICA: CARTILAGE REPAIR/CARTILAGE REGENERATION MARKET, BY TREATMENT MODALITY, 2021–2028 (USD MILLION)
- TABLE 50 NORTH AMERICA: CELL-BASED CARTILAGE REPAIR/CARTILAGE REGENERATION MARKET, BY TYPE, 2021–2028 (USD MILLION)
- TABLE 51 NORTH AMERICA: NON-CELL-BASED CARTILAGE REPAIR/CARTILAGE REGENERATION MARKET, BY TYPE, 2021–2028 (USD MILLION)
- TABLE 52 NORTH AMERICA: CARTILAGE REPAIR/CARTILAGE REGENERATION MARKET, BY APPLICATION, 2021–2028 (USD MILLION)
- TABLE 53 NORTH AMERICA: CARTILAGE REPAIR/CARTILAGE REGENERATION MARKET, BY APPLICATION SITE, 2021–2028 (USD MILLION)
- TABLE 54 US: CARTILAGE REPAIR/CARTILAGE REGENERATION MARKET, BY TREATMENT MODALITY, 2021–2028 (USD MILLION)
- TABLE 55 US: CELL-BASED CARTILAGE REPAIR/CARTILAGE REGENERATION MARKET, BY TYPE, 2021–2028 (USD MILLION)
- TABLE 56 US: NON-CELL-BASED CARTILAGE REPAIR/CARTILAGE REGENERATION MARKET, BY TYPE, 2021–2028 (USD MILLION)
- TABLE 57 US: CARTILAGE REPAIR/CARTILAGE REGENERATION MARKET, BY APPLICATION, 2021–2028 (USD MILLION)
- TABLE 58 US: CARTILAGE REPAIR/CARTILAGE REGENERATION MARKET, BY APPLICATION SITE, 2021–2028 (USD MILLION)
- TABLE 59 CANADA: CARTILAGE REPAIR/CARTILAGE REGENERATION MARKET, BY TREATMENT MODALITY, 2021–2028 (USD MILLION)
- TABLE 60 CANADA: CELL-BASED CARTILAGE REPAIR/CARTILAGE REGENERATION MARKET, BY TYPE, 2021–2028 (USD MILLION)
- TABLE 61 CANADA: NON-CELL-BASED CARTILAGE REPAIR/CARTILAGE REGENERATION MARKET, BY TYPE, 2021–2028 (USD MILLION)
- TABLE 62 CANADA: CARTILAGE REPAIR/CARTILAGE REGENERATION MARKET, BY APPLICATION, 2021–2028 (USD MILLION)
- TABLE 63 CANADA: CARTILAGE REPAIR/CARTILAGE REGENERATION MARKET, BY APPLICATION SITE, 2021–2028 (USD MILLION)
- TABLE 64 EUROPE: CARTILAGE REPAIR/CARTILAGE REGENERATION MARKET, BY COUNTRY, 2021–2028 (USD MILLION)
- TABLE 65 EUROPE: CARTILAGE REPAIR/CARTILAGE REGENERATION MARKET, BY TREATMENT MODALITY, 2021–2028 (USD MILLION)
- TABLE 66 EUROPE: CELL-BASED CARTILAGE REPAIR/CARTILAGE REGENERATION MARKET, BY TYPE, 2021–2028 (USD MILLION)
- TABLE 67 EUROPE: NON-CELL-BASED CARTILAGE REPAIR/CARTILAGE REGENERATION MARKET, BY TYPE, 2021–2028 (USD MILLION)
- TABLE 68 EUROPE: CARTILAGE REPAIR/CARTILAGE REGENERATION MARKET, BY APPLICATION, 2021–2028 (USD MILLION)
- TABLE 69 EUROPE: CARTILAGE REPAIR/CARTILAGE REGENERATION MARKET, BY APPLICATION SITE, 2021–2028 (USD MILLION)
- TABLE 70 GERMANY: CARTILAGE REPAIR/CARTILAGE REGENERATION MARKET, BY TREATMENT MODALITY, 2021–2028 (USD MILLION)
- TABLE 71 GERMANY: CELL-BASED CARTILAGE REPAIR/CARTILAGE REGENERATION MARKET, BY TYPE, 2021–2028 (USD MILLION)
- TABLE 72 GERMANY: NON-CELL-BASED CARTILAGE REPAIR/CARTILAGE REGENERATION MARKET, BY TYPE, 2021–2028 (USD MILLION)
- TABLE 73 GERMANY: CARTILAGE REPAIR/CARTILAGE REGENERATION MARKET, BY APPLICATION, 2021–2028 (USD MILLION)
- TABLE 74 GERMANY: CARTILAGE REPAIR/CARTILAGE REGENERATION MARKET, BY APPLICATION SITE, 2021–2028 (USD MILLION)
- TABLE 75 UK: CARTILAGE REPAIR/CARTILAGE REGENERATION MARKET, BY TREATMENT MODALITY, 2021–2028 (USD MILLION)
- TABLE 76 UK: CELL-BASED CARTILAGE REPAIR/CARTILAGE REGENERATION MARKET, BY TYPE, 2021–2028 (USD MILLION)
- TABLE 77 UK: NON-CELL-BASED CARTILAGE REPAIR/CARTILAGE REGENERATION MARKET, BY TYPE, 2021–2028 (USD MILLION)
- TABLE 78 UK: CARTILAGE REPAIR/CARTILAGE REGENERATION MARKET, BY APPLICATION, 2021–2028 (USD MILLION)
- TABLE 79 UK: CARTILAGE REPAIR/CARTILAGE REGENERATION MARKET, BY APPLICATION SITE, 2021–2028 (USD MILLION)
- TABLE 80 FRANCE: CARTILAGE REPAIR/CARTILAGE REGENERATION MARKET, BY TREATMENT MODALITY, 2021–2028 (USD MILLION)
- TABLE 81 FRANCE: CELL-BASED CARTILAGE REPAIR/CARTILAGE REGENERATION MARKET, BY TYPE, 2021–2028 (USD MILLION)
- TABLE 82 FRANCE: NON-CELL-BASED CARTILAGE REPAIR/CARTILAGE REGENERATION MARKET, BY TYPE, 2021–2028 (USD MILLION)
- TABLE 83 FRANCE: CARTILAGE REPAIR/CARTILAGE REGENERATION MARKET, BY APPLICATION, 2021–2028 (USD MILLION)
- TABLE 84 FRANCE: CARTILAGE REPAIR/CARTILAGE REGENERATION MARKET, BY APPLICATION SITE, 2021–2028 (USD MILLION)
- TABLE 85 REST OF EUROPE: CARTILAGE REPAIR/CARTILAGE REGENERATION MARKET, BY TREATMENT MODALITY, 2021–2028 (USD MILLION)
- TABLE 86 REST OF EUROPE: CELL-BASED CARTILAGE REPAIR/CARTILAGE REGENERATION MARKET, BY TYPE, 2021–2028 (USD MILLION)
- TABLE 87 REST OF EUROPE: NON-CELL-BASED CARTILAGE REPAIR/CARTILAGE REGENERATION MARKET, BY TYPE, 2021–2028 (USD MILLION)
- TABLE 88 REST OF EUROPE: CARTILAGE REPAIR/CARTILAGE REGENERATION MARKET, BY APPLICATION, 2021–2028 (USD MILLION)
- TABLE 89 REST OF EUROPE: CARTILAGE REPAIR/CARTILAGE REGENERATION MARKET, BY APPLICATION SITE, 2021–2028 (USD MILLION)
- TABLE 90 ASIA PACIFIC: CARTILAGE REPAIR/CARTILAGE REGENERATION MARKET, BY COUNTRY, 2021–2028 (USD MILLION)
- TABLE 91 ASIA PACIFIC: CARTILAGE REPAIR/CARTILAGE REGENERATION MARKET, BY TREATMENT MODALITY, 2021–2028 (USD MILLION)
- TABLE 92 ASIA PACIFIC: CELL-BASED CARTILAGE REPAIR/CARTILAGE REGENERATION MARKET, BY TYPE, 2021–2028 (USD MILLION)
- TABLE 93 ASIA PACIFIC: NON-CELL-BASED CARTILAGE REPAIR/CARTILAGE REGENERATION MARKET, BY TYPE, 2021–2028 (USD MILLION)
- TABLE 94 ASIA PACIFIC: CARTILAGE REPAIR/CARTILAGE REGENERATION MARKET, BY APPLICATION, 2021–2028 (USD MILLION)
- TABLE 95 ASIA PACIFIC: CARTILAGE REPAIR/CARTILAGE REGENERATION MARKET, BY APPLICATION SITE, 2021–2028 (USD MILLION)
- TABLE 96 JAPAN: CARTILAGE REPAIR/CARTILAGE REGENERATION MARKET, BY TREATMENT MODALITY, 2021–2028 (USD MILLION)
- TABLE 97 JAPAN: CELL-BASED CARTILAGE REPAIR/CARTILAGE REGENERATION MARKET, BY TYPE, 2021–2028 (USD MILLION)
- TABLE 98 JAPAN: NON-CELL-BASED CARTILAGE REPAIR/CARTILAGE REGENERATION MARKET, BY TYPE, 2021–2028 (USD MILLION)
- TABLE 99 JAPAN: CARTILAGE REPAIR/CARTILAGE REGENERATION MARKET, BY APPLICATION, 2021–2028 (USD MILLION)
- TABLE 100 JAPAN: CARTILAGE REPAIR/CARTILAGE REGENERATION MARKET, BY APPLICATION SITE, 2021–2028 (USD MILLION)
- TABLE 101 CHINA: CARTILAGE REPAIR/CARTILAGE REGENERATION MARKET, BY TREATMENT MODALITY, 2021–2028 (USD MILLION)
- TABLE 102 CHINA: CELL-BASED CARTILAGE REPAIR/CARTILAGE REGENERATION MARKET, BY TYPE, 2021–2028 (USD MILLION)
- TABLE 103 CHINA: NON-CELL-BASED CARTILAGE REPAIR/CARTILAGE REGENERATION MARKET, BY TYPE, 2021–2028 (USD MILLION)
- TABLE 104 CHINA: CARTILAGE REPAIR/CARTILAGE REGENERATION MARKET, BY APPLICATION, 2021–2028 (USD MILLION)
- TABLE 105 CHINA: CARTILAGE REPAIR/CARTILAGE REGENERATION MARKET, BY APPLICATION SITE, 2021–2028 (USD MILLION)
- TABLE 106 INDIA: CARTILAGE REPAIR/CARTILAGE REGENERATION MARKET, BY TREATMENT MODALITY, 2021–2028 (USD MILLION)
- TABLE 107 INDIA: CELL-BASED CARTILAGE REPAIR/CARTILAGE REGENERATION MARKET, BY TYPE, 2021–2028 (USD MILLION)
- TABLE 108 INDIA: NON-CELL-BASED CARTILAGE REPAIR/CARTILAGE REGENERATION MARKET, BY TYPE, 2021–2028 (USD MILLION)
- TABLE 109 INDIA: CARTILAGE REPAIR/CARTILAGE REGENERATION MARKET, BY APPLICATION, 2021–2028 (USD MILLION)
- TABLE 110 INDIA: CARTILAGE REPAIR/CARTILAGE REGENERATION MARKET, BY APPLICATION SITE, 2021–2028 (USD MILLION)
- TABLE 111 REST OF ASIA PACIFIC: CARTILAGE REPAIR/CARTILAGE REGENERATION MARKET, BY TREATMENT MODALITY, 2021–2028 (USD MILLION)
- TABLE 112 REST OF ASIA PACIFIC: CELL-BASED CARTILAGE REPAIR/CARTILAGE REGENERATION MARKET, BY TYPE, 2021–2028 (USD MILLION)
- TABLE 113 REST OF ASIA PACIFIC: NON-CELL-BASED CARTILAGE REPAIR/CARTILAGE REGENERATION MARKET, BY TYPE, 2021–2028 (USD MILLION)
- TABLE 114 REST OF ASIA PACIFIC: CARTILAGE REPAIR/CARTILAGE REGENERATION MARKET, BY APPLICATION, 2021–2028 (USD MILLION)
- TABLE 115 REST OF ASIA PACIFIC: CARTILAGE REPAIR/CARTILAGE REGENERATION MARKET, BY APPLICATION SITE, 2021–2028 (USD MILLION)
- TABLE 116 REST OF THE WORLD: CARTILAGE REPAIR/CARTILAGE REGENERATION MARKET, BY TREATMENT MODALITY, 2021–2028 (USD MILLION)
- TABLE 117 REST OF THE WORLD: CELL-BASED CARTILAGE REPAIR/CARTILAGE REGENERATION MARKET, BY TYPE, 2021–2028 (USD MILLION)
- TABLE 118 REST OF THE WORLD: NON-CELL-BASED CARTILAGE REPAIR/CARTILAGE REGENERATION MARKET, BY TYPE, 2021–2028 (USD MILLION)
- TABLE 119 REST OF THE WORLD: CARTILAGE REPAIR/CARTILAGE REGENERATION MARKET, BY APPLICATION, 2021–2028 (USD MILLION)
- TABLE 120 REST OF THE WORLD: CARTILAGE REPAIR/CARTILAGE REGENERATION MARKET, BY APPLICATION SITE, 2021–2028 (USD MILLION)
- TABLE 121 CARTILAGE REPAIR/CARTILAGE REGENERATION MARKET: DEGREE OF COMPETITION
- TABLE 122 KEY PRODUCT APPROVALS, JANUARY 2020–NOVEMBER 2023
- TABLE 123 KEY DEALS, JANUARY 2020–NOVEMBER 2023
- TABLE 124 OTHER KEY DEVELOPMENTS, JANUARY 2020–NOVEMBER 2023
- TABLE 125 SMITH+NEPHEW: COMPANY OVERVIEW
- TABLE 126 JOHNSON & JOHNSON: COMPANY OVERVIEW
- TABLE 127 ZIMMER BIOMET HOLDINGS, INC.: COMPANY OVERVIEW
- TABLE 128 STRYKER CORPORATION: COMPANY OVERVIEW
- TABLE 129 VERICEL CORPORATION: COMPANY OVERVIEW
- TABLE 130 B. BRAUN MELSUNGEN AG: COMPANY OVERVIEW
- TABLE 131 ANIKA THERAPEUTICS, INC.: COMPANY OVERVIEW
- TABLE 132 RTI SURGICAL: COMPANY OVERVIEW
- TABLE 133 CONMED CORPORATION.: COMPANY OVERVIEW
- TABLE 134 ARTHREX INC.: COMPANY OVERVIEW
- TABLE 135 REGROW BIOSCIENCES: COMPANY OVERVIEW
- TABLE 136 MEDIPOST: COMPANY OVERVIEW
- FIGURE 1 CARTILAGE REPAIR/CARTILAGE REGENERATION MARKET: RESEARCH DESIGN
- FIGURE 2 PRIMARY SOURCES
- FIGURE 3 BREAKDOWN OF PRIMARY INTERVIEWS: BY COMPANY TYPE, DESIGNATION, AND REGION
- FIGURE 4 BOTTOM-UP APPROACH: COMPANY REVENUE ESTIMATION
- FIGURE 5 GROWTH FORECAST
- FIGURE 6 CAGR PROJECTIONS: SUPPLY-SIDE ANALYSIS
- FIGURE 7 TOP-DOWN APPROACH
- FIGURE 8 DATA TRIANGULATION METHODOLOGY
- FIGURE 9 CARTILAGE REPAIR/CARTILAGE REGENERATION MARKET, BY TREATMENT MODALITY, 2023 VS. 2028 (USD MILLION)
- FIGURE 10 CARTILAGE REPAIR/CARTILAGE REGENERATION MARKET, BY APPLICATION, 2023 VS. 2028 (USD MILLION)
- FIGURE 11 CARTILAGE REPAIR/CARTILAGE REGENERATION MARKET, BY APPLICATION SITE, 2023 VS. 2028 (USD MILLION)
- FIGURE 12 CARTILAGE REPAIR/CARTILAGE REGENERATION MARKET: GEOGRAPHIC SNAPSHOT
- FIGURE 13 INCREASING INCIDENCE OF OSTEOARTHRITIS TO DRIVE MARKET
- FIGURE 14 HYALINE CARTILAGE HELD LARGEST SHARE IN 2022
- FIGURE 15 JAPAN TO WITNESS HIGHEST GROWTH DURING FORECAST PERIOD
- FIGURE 16 CARTILAGE REPAIR/CARTILAGE REGENERATION MARKET: DRIVERS, RESTRAINTS, OPPORTUNITIES, AND CHALLENGES
- FIGURE 17 DISTRIBUTION—KEY STRATEGY PREFERRED BY PROMINENT COMPANIES
- FIGURE 18 PATENT ANALYSIS FOR CARTILAGE REPAIR/CARTILAGE REGENERATION MARKET
- FIGURE 19 CARTILAGE REPAIR CANDIDATE PRODUCTS IN CLINICAL PHASES ONE TO FOUR
- FIGURE 20 NORTH AMERICA: CARTILAGE REPAIR/CARTILAGE REGENERATION MARKET SNAPSHOT
- FIGURE 21 ASIA PACIFIC: CARTILAGE REPAIR/CARTILAGE REGENERATION MARKET
- FIGURE 22 TOP FIVE PLAYERS HAVE DOMINATED MARKET IN LAST FIVE YEARS
- FIGURE 23 CARTILAGE REPAIR/CARTILAGE REGENERATION MARKET: MARKET SHARE ANALYSIS, 2022
- FIGURE 24 GLOBAL CARTILAGE REPAIR/CARTILAGE REGENERATION MARKET: COMPANY EVALUATION MATRIX, 2022
- FIGURE 25 SMITH+NEPHEW: COMPANY SNAPSHOT (2022)
- FIGURE 26 JOHNSON & JOHNSON: COMPANY SNAPSHOT (2022)
- FIGURE 27 ZIMMER BIOMET HOLDINGS, INC.: COMPANY SNAPSHOT (2022)
- FIGURE 28 STRYKER CORPORATION: COMPANY SNAPSHOT (2022)
- FIGURE 29 VERICEL CORPORATION: COMPANY SNAPSHOT (2022)
- FIGURE 30 B. BRAUN MELSUNGEN AG: COMPANY SNAPSHOT (2022)
- FIGURE 31 ANIKA THERAPEUTICS, INC: COMPANY SNAPSHOT (2022)
- FIGURE 32 CONMED CORPORATION: COMPANY SNAPSHOT (2022)
- FIGURE 33 MEDIPOST: COMPANY SNAPSHOT (2022)
The objective of the study is to analyze the key market dynamics, such as drivers, opportunities, challenges, restraints, and key player strategies. To track company developments such as acquisitions, product launches, expansions, collaborations, agreements, and partnerships of the leading players, the competitive landscape of the cartilage repair/cartilage regeneration market to analyze market players on various parameters within the broad categories of business and product strategy. Top-down and bottom-up approaches were used to estimate the market size. To estimate the market size of segments and subsegments, the market breakdown and data triangulation were used.
The four steps involved in estimating the market size are:
Collecting Secondary Data
The secondary research data collection process involves the usage of secondary sources, directories, databases (such as Bloomberg Businessweek, Factiva, and D&B), annual reports, investor presentations, and SEC filings of companies. Secondary research was used to identify and collect information useful for the extensive, technical, market-oriented, and commercial study of the cartilage repair/cartilage regeneration market. A database of the key industry leaders was also prepared using secondary research.
Collecting Primary Data
The primary research data was collected after acquiring knowledge about the cartilage repair/cartilage regeneration market scenario through secondary research. A significant number of primary interviews were conducted with stakeholders from both the demand side (such as Hospitals) and supply side (such as included various industry experts, such as Directors, Chief X Officers (CXOs), Vice Presidents (VPs) from business development, marketing, and product development teams, product manufacturers, wholesalers, channel partners, and distributors) across major countries of North America, Europe, Asia Pacific and Rest of the world. Approximately 40% of the primary interviews were conducted with stakeholders from the demand side, while those from the supply side accounted for the remaining 60%. Primary data for this report was collected through questionnaires, emails, and telephonic interviews.
A breakdown of the primary respondents is provided below:
Breakdown of Primary Participants:
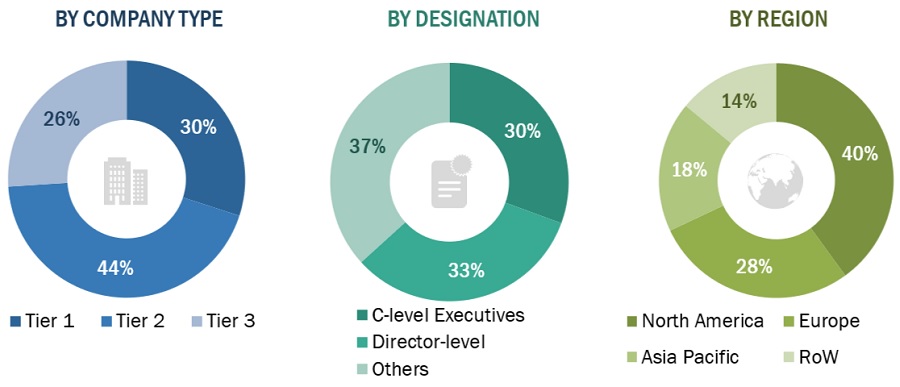
Note 1: *Others include sales managers, marketing managers, and product managers.
Note 2: Tiers are defined based on a company’s total revenue as of 2022: Tier 1=> USD 1 billion, Tier 2 = USD 500 million to USD 1 billion, and Tier 3=< USD 500 million.
To know about the assumptions considered for the study, download the pdf brochure
|
COMPANY NAME |
DESIGNATION |
|
Vericel Corporation (US) |
Product Manager |
|
Zimmer Biomet Holdings, Inc. (US) |
Regional Manager |
|
Smith+Nephew (UK) |
Regional Business Head |
Market Size Estimation
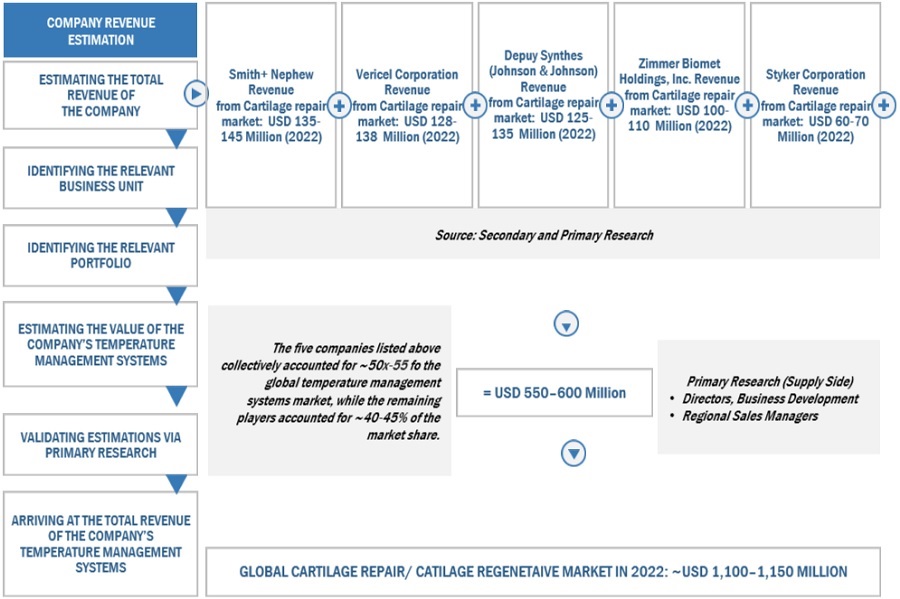
All major product manufacturers offering various cartilage repair/cartilage regeneration markets were identified at the global/regional level. Revenue mapping was done for the major players and was extrapolated to arrive at the global market value of each type of segment. The market value cartilage repair/cartilage regeneration market was also split into various segments and subsegments at the regional and country levels based on the following:
- Product mapping of various manufacturers for each solution of cartilage repair/cartilage regeneration market at the regional and country-level
- Relative adoption pattern of each cartilage repair/cartilage regeneration market among key application segments at the regional and/or country-level
- Detailed primary research to gather qualitative and quantitative information related to segments and subsegments at the regional and/or country level.
- Detailed secondary research to gauge the prevailing market trends at the regional and/or country level
Global Cartilage Repair/Cartilage Regeneration Market Size: Botton-Up Approach
To know about the assumptions considered for the study, Request for Free Sample Report
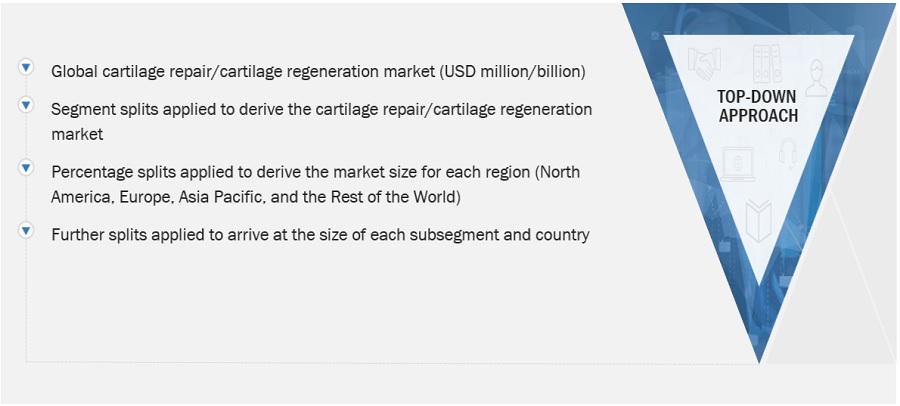
Global Cartilage Repair/Cartilage Regeneration Market Size: Top-Down Approach
Data Triangulation
After arriving at the overall market size—using the market size estimation processes—the market was split into several segments and subsegments. To complete the overall market engineering process and arrive at the exact statistics of each market segment and subsegment, data triangulation and market breakdown procedures were employed, wherever applicable. The data was triangulated by studying various factors and trends from both the demand and supply sides in the cartilage repair/cartilage regeneration market.
Market Definition
Cartilage repair refers to the process of restoring damaged or injured cartilage tissue, which is a tough, flexible connective tissue found in various parts of the body, including joints. Cartilage does not have a direct blood supply, which makes its natural healing capacity limited. Therefore, injuries to cartilage often result in pain and limited joint function. The cartilage tissue is made of specialized cells called chondrocytes. Cartilage injuries are most commonly observed in athletes and individuals with an active lifestyle. As cartilage is avascular and does not have a blood supply, cartilage repair and regeneration is one of the most challenging medical treatments. Cartilage repair treatment involves the repair, removal, replacement, or restoration of the surface of articular cartilage.
Key Stakeholders
- Senior Management
- End User
- Finance/Procurement Department
- R&D Department
Report Objectives
- To provide detailed information about the factors influencing the market growth (such as drivers, restraints, opportunities, and challenges)
- To define, describe, segment, and forecast the cartilage repair/cartilage regeneration market by Product, Application, Medical specialty and Region
- To analyze market opportunities for stakeholders and provide details of the competitive landscape for key players
- To analyze micro markets with respect to individual growth trends, prospects, and contributions to the overall cartilage repair/cartilage regeneration market
- To forecast the size of the cartilage repair/cartilage regeneration market in four main regions along with their respective key countries, namely, North America, Europe, the Asia Pacific, and Rest of the world
- To profile key players in the cartilage repair/cartilage regeneration market and comprehensively analyze their core competencies and market shares
- To track and analyze competitive developments, such as acquisitions; product launches; expansions; collaborations, agreements, & partnerships; and R&D activities of the leading players in the cartilage repair/cartilage regeneration market.
- To benchmark players within the cartilage repair/cartilage regeneration market using the Competitive Leadership Mapping framework, which analyzes market players on various parameters within the broad categories of business and product strategy.
Available Customizations
MarketsandMarkets offers the following customizations for this market report:
- Additional country-level analysis of the cartilage repair/cartilage regeneration market
- Profiling of additional market players (up to 5) Product Analysis
- Product matrix, which provides a detailed comparison of the product portfolio of each company in the cartilage repair/cartilage regeneration market


 Generating Response ...


Growth opportunities and latent adjacency in Cartilage Repair Market