Cell Dissociation Market

Cell Dissociation Market by Product (Trypsin, Papain, DNase, Hyaluronidase, Instruments), Tissue Type (Connective Tissue, Epithelial Tissue), End User (Pharma, Biopharma, Research Institutes) & Region - Global Forecasts to 2028

Report Code: BT 6129 Mar, 2023, by marketsandmarkets.com

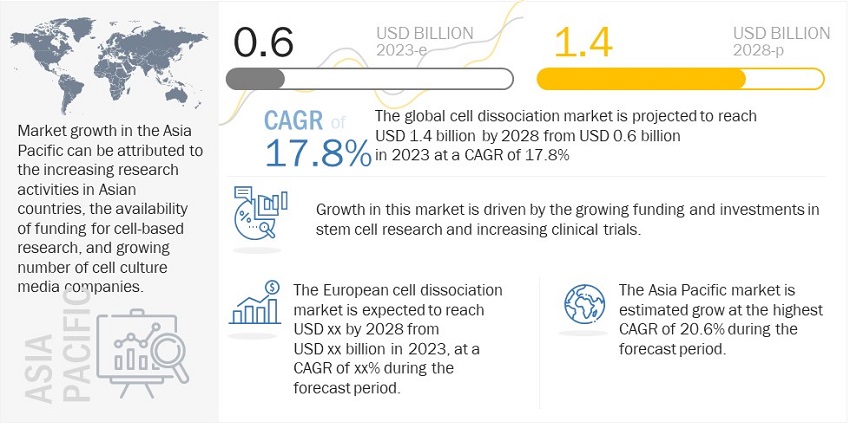
The global cell dissociation market in terms of revenue was estimated to be worth $0.6 billion in 2023 and is poised to reach $1.4 billion by 2028, growing at a CAGR of 17.8% from 2023 to 2028. The new research study consists of an industry trend analysis of the market. The new research study consists of industry trends, pricing analysis, patent analysis, conference and webinar materials, key stakeholders, and buying behaviour in the market. The new edition of the report provides updated financial information through 2022 (depending on availability) for each listed company in a graphical representation. This would help in the easy analysis of the present status of profiled companies in terms of their financial strength, profitability, key revenue-generating region or country, and business segment focus in terms of the highest revenue-generating segment. Key driving factors of the market include an increase in demand for personalized medicine, cGMP approvals each year for new production facilities developing cell therapies, and the growing use of cell dissociation products in mammalian cell culture to develop recombinant therapeutics. Additionally, advancements in non-enzymatic dissociation approaches are expected to offer lucrative opportunities for the end users of this market. Expensive cell-based research is a major hindrance to the market growth.
Cell Dissociation Market

To know about the assumptions considered for the study, download the pdf brochure

Cell dissociation Market Dynamics

Driver: Increase in recombinant therapeutics sourced from mammalian cells

The biopharmaceutical industry has witnessed a considerable increase in the proportion of recombinant therapeutics sourced from mammalian cells since 2002. The number of approved recombinant products from mammalian cell culture increased by 8.5% annually from 2002 to 2022. As of June 2022, more than 300 recombinant products have been commercialized, indicating a rapid shift towards mammalian-based therapeutics, which nearly account for 67% of therapeutics in 2022. .Cell culture products, including cell dissociation form an integral part of developing mammalian-based recombinant therapeutics, propelling the industry growth.

Restraint: High cost of cell-based research

Isolation and purification of cell organelles integrates expensive products, additionally, automated/sem-automated benchtop instruments are more expensive than traditional methods. Despite significant benefits offered by automated instruments, high costs associated with these instruments may limit the adoption of products further restraining the market growth.

Opportunity: Advancements in non-enzymatic tissue dissociation

Companies operating in the market are introducing innovative and advanced products to overcome competition and generate more revenue. Most researchers in R&D institutes and biotechnology companies have primarily relied on traditional enzymatic dissociation products to separate cells from primary tissues. Although these traditional enzymatic dissociation products have advantages, such as better dissociation while performing research, they can sometimes be cytotoxic and damage viable cells. To overcome this issue and differentiate their product offerings, several companies are introducing non-enzymatic products that are non-cytotoxic. Owing to this advantage, the demand for non-enzymatic dissociation products is increasing among several end users.

Challenge: Limitations associated with dissociated cell culture

The key limitation of dissociated cultures is the small number of cells relative to immortalized cell lines. This makes it difficult to perform biochemical experiments requiring a high starting material volume. Additionally, most primary cell cultures are not homogeneous, which poses a challenging scenario for cell dissociation experiments. Neuronal cultures are often mixtures of both glia and neurons that respond to different neurotransmitters, so identifying an individual population of cells can be difficult.

The enzymatic dissociation segment accounted for the largest share of the cell dissociation industry in 2022

Based on the product, the cell dissociation market is segmented into non-enzymatic dissociation products, enzymatic dissociation products and instruments & accessories. Collagenase segment is the key contributor to the dominance of enzymatic dissociation products. More than 20 different types of collagenases exist, but only a handful are most suited for the enzyme dissociation of tissues. These suitable collagenases can maximize the number of viable, dissociated cells. Collagenase type 1 is typically recommended for liver, epithelial, adrenal, and adipocyte tissue dissociation.

The connective tissue segment of the cell dissociation industry is expected to grow at the highest CAGR during the forecast period

By tissue type, the cell dissociation market is segmented cell detachment and tissue dissociation. The tissue dissociation segment accounted for the largest market share in 2022. Collagen fibers are present in varying concentrations in almost all connective tissues. Elastic fibers are less abundant than the collagen varieties, somewhat similar to reticular fibers, wherein they form branching networks in connective tissues.

Pharmaceutical and biotechnology companies are the dominant end user segment of the cell dissociation industry in 2022

Based on end-users, the cell dissociation market is segmented into pharmaceutical & biotechnology companies, research institutes & academic institutes, and other end users. Pharmaceutical & biotechnology companies utilize cell culture products, including cell dissociation products, to research various chronic diseases. Additionally, the R&D investments in these companies have been increasing over the last few years, which has contributed to the dominance of this segment.
Cell Dissociation Market by Region

Asia Pacific region is anticipated to grow at the fastest pace in the cell dissociation industry through the forecast period

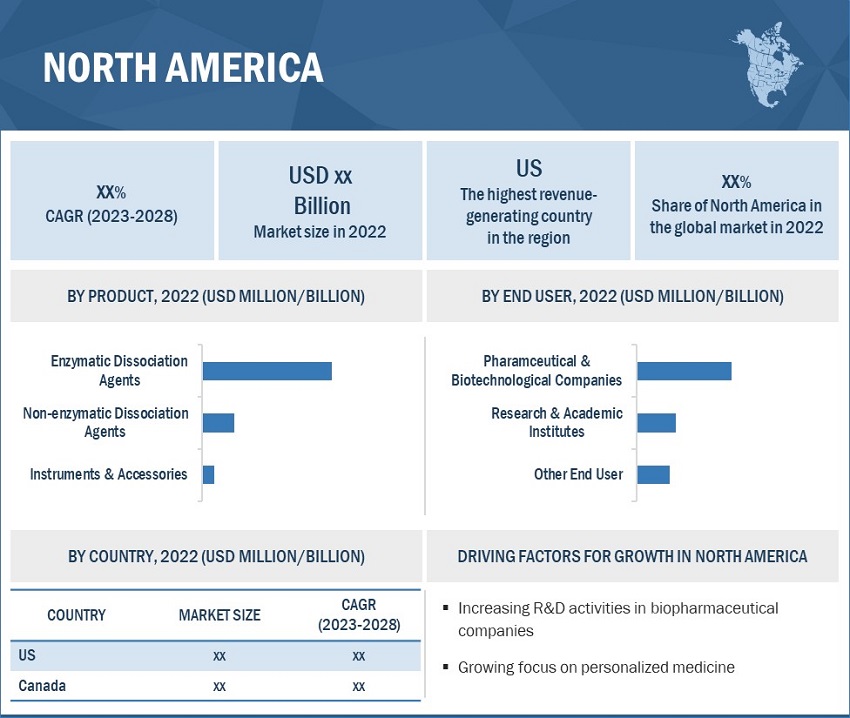
Based on the region, the cell dissociation market is segmented into North America, Europe, Asia Pacific, Latin America, and Middle East & Africa. Asia Pacific region is anticipated to grow at the fastest pace in the market through the forecast period. APAC’s pharmaceutical markets remain highly competitive and extremely fragmented, with thousands of small manufacturers competing for market shares. From an economic and policy standpoint, government support is expected to drive innovation in life sciences research and the growth of the pharmaceutical and biopharmaceutical sector.

The prominent players in the global cell dissociation market are Merck KGaA (Germany), Danaher Corporation (US), Thermo Fisher Scientific, Inc. (US), Corning Incorporated (US), Becton, Dickinson and Company (US), STEMCELL Technologies (Canada), PromoCell GmbH (Germany), Miltenyi Biotec (Germany), ATCC (US), HiMedia Laboratories (India), PAN-Biotech (Germany), CellSystems GmbH (Germany), AMSBIO (England), Neuromics (US), VitaCyte, LLC. (US), ALSTEM (US), Biological Industries (Israel), Gemini Bio (US), Innovative Cell Technologies, Inc. (US), Central Drug House (P) Ltd. (India), Worthington Biochemical Corporation (US), Capricorn Scientific (Germany), Abeomics (US), and Genlantis, Inc. (US).

Scope of the Cell Dissociation Industry:

Report Metric

Details

Market Revenue in 2023

$0.6 billion

Estimated Value by 2028

$1.4 billion

Revenue Rate

Poised to grow at a CAGR of 17.8%

Market Driver

Increase in recombinant therapeutics sourced from mammalian cells

Market Opportunity

Advancements in non-enzymatic tissue dissociation

This research report categorizes the cell dissociation market to forecast revenue and analyze trends in each of the following submarkets

By Product

  • Enzymatic Dissociation Products
    • Collagenase
    • Trypsin
    • Papain
    • Elastase
    • DNase
    • Hyaluronidase
    • Other Enzymes
  • Non-Enzymatic Dissociation Agents
  • Instruments & Accessories

By Tissue Type

  • Connective Tissues
  • Epithelial Tissues
  • Other tissues

By Application

  • Tissue dissociation
  • Cell detachment

By End User

  • Pharmaceutical and Biotechnology companies
  • Research and Academics
  • other end users

By Region

  • North America
    • US
    • Canada
  • Europe
    • Germany
    • UK
    • France
    • Spain
    • Italy
    • RoE
  • Asia Pacific
    • China
    • India
    • Japan
    • Australia
    • South Korea
    • RoAPAC
  • Rest of the World

Recent Development of Cell Dissociation Industry

  • In 2020, Miltenyi Biotec launched automated and closed adherent cell culture solutions on CliniMACS Prodigy.
  • In 2020, Merck The company expanded its Life Sciences production facilities in Danvers, Massachusetts, and Jaffrey, New Hampshire (US).
  • In 2020, STEMCELL Technologies partnered with CollPlant to secure CollPlant rhCollagen for STEMCELL’s use in cell culture applications.
  • In 2021, Danaher (Cytiva) partnered with Diamyd Medical, wherein Diamyd selected Cytiva’s FlexFactory platform for making precision medicine type-1 diabetes vaccines.
  • In 2021, Danaher (Cytiva) collaborated with the Government of Telangana (India) to strengthen the biopharma industry in India with new labs.

Frequently Asked Questions (FAQ):

To speak to our analyst for a discussion on the above findings, click Speak to Analyst

TABLE OF CONTENTS
 
1 INTRODUCTION (Page No. - 31)
    1.1 STUDY OBJECTIVES 
    1.2 MARKET DEFINITION 
           1.2.1 INCLUSIONS AND EXCLUSIONS
    1.3 STUDY SCOPE 
    1.4 YEARS CONSIDERED 
    1.5 CURRENCY CONSIDERED 
    1.6 LIMITATIONS 
    1.7 STAKEHOLDERS 
    1.8 RECESSION IMPACT 
 
2 RESEARCH METHODOLOGY (Page No. - 34)
    2.1 RESEARCH APPROACH 
          FIGURE 1 RESEARCH DESIGN
           2.1.1 SECONDARY DATA
           2.1.2 PRIMARY DATA
                    FIGURE 2 BREAKDOWN OF PRIMARIES: CELL DISSOCIATION MARKET
    2.2 MARKET SIZE ESTIMATION 
          FIGURE 3 MARKET SIZE ESTIMATION: BOTTOM-UP (SUPPLY SIDE): COLLECTIVE REVENUE OF CELL DISSOCIATION COMPANIES
          FIGURE 4 AVERAGE MARKET SIZE ESTIMATION, 2022
    2.3 GROWTH RATE ASSUMPTIONS/GROWTH FORECAST 
          FIGURE 5 CELL DISSOCIATION INDUSTRY: CAGR PROJECTIONS, 2022–2027
          FIGURE 6 MARKET SIZE ESTIMATION METHODOLOGY: TOP-DOWN APPROACH
    2.4 MARKET BREAKDOWN AND DATA TRIANGULATION 
          FIGURE 7 DATA TRIANGULATION METHODOLOGY
    2.5 INSIGHTS FROM PRIMARIES 
          FIGURE 8 MARKET VALIDATION FROM PRIMARY EXPERTS
    2.6 RESEARCH ASSUMPTIONS 
    2.7 RISK ASSESSMENT 
    2.8 RECESSION IMPACT ANALYSIS 
          TABLE 1 GLOBAL INFLATION RATE PROJECTIONS, 2021–2027 (% GROWTH)
 
3 EXECUTIVE SUMMARY (Page No. - 45)
    FIGURE 9 CELL DISSOCIATION MARKET, BY PRODUCT, 2023 VS. 2028 (USD MILLION)
    FIGURE 10 MARKET, BY TISSUE TYPE, 2023 VS. 2028 (USD MILLION)
    FIGURE 11 MARKET, BY APPLICATION, 2022 VS. 2026 (USD MILLION)
    FIGURE 12 MARKET, BY END USER, 2022 VS. 2026 (USD MILLION)
    FIGURE 13 GEOGRAPHICAL SNAPSHOT
 
4 PREMIUM INSIGHTS (Page No. - 49)
    4.1 CELL DISSOCIATION MARKET OVERVIEW 
          FIGURE 14 INCREASING INVESTMENTS AND FUNDING FOR CELL RESEARCH TO DRIVE MARKET
    4.2 NORTH AMERICA: MARKET 
          FIGURE 15 ENZYMATIC DISSOCIATION AGENTS TO COMMAND LARGEST SHARE OF NORTH AMERICAN MARKET
    4.3 NORTH AMERICA: MARKET, BY TISSUE TYPE, 2023 VS. 2028 (USD MILLION) 
          FIGURE 16 EPITHELIAL TISSUE SEGMENT TO GROW AT HIGHEST CAGR IN NORTH AMERICA
 
5 MARKET OVERVIEW (Page No. - 51)
    5.1 INTRODUCTION 
    5.2 MARKET DYNAMICS 
          FIGURE 17 CELL DISSOCIATION MARKET: DRIVERS, RESTRAINTS, OPPORTUNITIES, AND CHALLENGES
          TABLE 2 MARKET: IMPACT ANALYSIS
           5.2.1 DRIVERS
                    5.2.1.1 Increase in recombinant therapeutics sourced from mammalian cells
                                FIGURE 18 RISE IN MARKETED THERAPEUTICS, 2002 VS 2022
                                FIGURE 19 MARKETED THERAPEUTICS, BY ORIGIN, 2022
                    5.2.1.2 Growing focus on personalized medicine
                                FIGURE 20 SHARE OF PERSONALIZED MEDICINES IN TOTAL NUMBER OF FDA-APPROVED NEW MOLECULAR ENTITIES, 2015–2021
                    5.2.1.3 cGMP approvals for new cell therapy production facilities
                                TABLE 3 NEW GMP FACILITIES AND EXPANSIONS, 2017-2022
           5.2.2 RESTRAINTS
                    5.2.2.1 High cost of cell-based research
           5.2.3 OPPORTUNITIES
                    5.2.3.1 Advancements in non-enzymatic tissue dissociation
           5.2.4 CHALLENGES
                    5.2.4.1 Limitations associated with dissociated cell culture
    5.3 TECHNOLOGY ANALYSIS 
    5.4 SUPPLY/VALUE CHAIN ANALYSIS 
          FIGURE 21 MARKET: VALUE CHAIN ANALYSIS
    5.5 ECOSYSTEM ANALYSIS 
          FIGURE 22 MARKET: ECOSYSTEM ANALYSIS
    5.6 PORTER’S FIVE FORCES ANALYSIS 
          TABLE 4 MARKET: PORTER’S FIVE FORCES ANALYSIS
           5.6.1 THREAT OF NEW ENTRANTS
           5.6.2 THREAT OF SUBSTITUTES
           5.6.3 BARGAINING POWER OF SUPPLIERS
           5.6.4 BARGAINING POWER OF BUYERS
           5.6.5 DEGREE OF COMPETITION
    5.7 REGULATORY ANALYSIS 
           5.7.1 REGULATORY BODIES, GOVERNMENT AGENCIES, AND OTHER ORGANIZATIONS
                    TABLE 5 NORTH AMERICA: LIST OF REGULATORY BODIES, GOVERNMENT AGENCIES, AND OTHER ORGANIZATIONS
                    TABLE 6 EUROPE: LIST OF REGULATORY BODIES, GOVERNMENT AGENCIES, AND OTHER ORGANIZATIONS
                    TABLE 7 ASIA PACIFIC: LIST OF REGULATORY BODIES, GOVERNMENT AGENCIES, AND OTHER ORGANIZATIONS
                    TABLE 8 ROW: LIST OF REGULATORY BODIES, GOVERNMENT AGENCIES, AND OTHER ORGANIZATIONS
    5.8 PRICING ANALYSIS 
          TABLE 9 AVERAGE SELLING PRICES OF KEY PLAYERS, BY PRODUCT (REAGENTS)
           5.8.1 AVERAGE SELLING PRICE TREND
                    TABLE 10 PRICING TRENDS FOR CELL DISSOCIATION REAGENTS OFFERED BY KEY PLAYERS
    5.9 KEY CONFERENCES & EVENTS, 2023–2024 
          TABLE 11 CELL DISSOCIATION CONFERENCES & EVENTS (2023–2024)
    5.10 KEY STAKEHOLDERS AND BUYING CRITERIA 
           5.10.1 KEY STAKEHOLDERS IN BUYING PROCESS
                     FIGURE 23 INFLUENCE OF STAKEHOLDERS ON BUYING PROCESS OF CELL DISSOCIATION PRODUCTS
           5.10.2 BUYING CRITERIA FOR CELL DISSOCIATION PRODUCTS
                     FIGURE 24 KEY BUYING CRITERIA FOR END USERS
 
6 CELL DISSOCIATION MARKET, BY PRODUCT (Page No. - 66)
    6.1 INTRODUCTION 
          TABLE 12 CELL DISSOCIATION INDUSTRY, BY PRODUCT, 2021–2028 (USD MILLION)
    6.2 ENZYMATIC DISSOCIATION AGENTS 
          TABLE 13 MARKET FOR ENZYMATIC DISSOCIATION AGENTS, BY TYPE, 2021–2028 (USD MILLION)
          TABLE 14 MARKET FOR ENZYMATIC DISSOCIATION AGENTS, BY REGION, 2021–2028 (USD MILLION)
          TABLE 15 NORTH AMERICA: MARKET FOR ENZYMATIC DISSOCIATION AGENTS, BY COUNTRY, 2021–2028 (USD MILLION)
          TABLE 16 EUROPE: MARKET FOR ENZYMATIC DISSOCIATION AGENTS, BY COUNTRY, 2021–2028 (USD MILLION)
          TABLE 17 ASIA PACIFIC: MARKET FOR ENZYMATIC DISSOCIATION AGENTS, BY COUNTRY, 2021–2028 (USD MILLION)
           6.2.1 COLLAGENASE
                    6.2.1.1 Collagenase to hold largest share of enzymatic dissociation agents market
                                TABLE 18 MARKET FOR COLLAGENASE, BY REGION, 2021–2028 (USD MILLION)
                                TABLE 19 NORTH AMERICA: MARKET FOR COLLAGENASE, BY COUNTRY, 2021–2028 (USD MILLION)
                                TABLE 20 EUROPE: MARKET FOR COLLAGENASE, BY COUNTRY, 2021–2028 (USD MILLION)
                                TABLE 21 ASIA PACIFIC: MARKET FOR COLLAGENASE, BY COUNTRY, 2021–2028 (USD MILLION)
           6.2.2 TRYPSIN
                    6.2.2.1 Established protocols for using trypsin to contribute to segment growth
                                TABLE 22 MARKET FOR TRYPSIN, BY REGION, 2021–2028 (USD MILLION)
                                TABLE 23 NORTH AMERICA: MARKET FOR TRYPSIN, BY COUNTRY, 2021–2028 (USD MILLION)
                                TABLE 24 EUROPE: MARKET FOR TRYPSIN, BY COUNTRY, 2021–2028 (USD MILLION)
                                TABLE 25 ASIA PACIFIC: MARKET FOR TRYPSIN, BY COUNTRY, 2021–2028 (USD MILLION)
           6.2.3 PAPAIN
                    6.2.3.1 Benefits of papain-based dissociation to drive usage
                                TABLE 26 MARKET FOR PAPAIN, BY REGION, 2021–2028 (USD MILLION)
                                TABLE 27 NORTH AMERICA: MARKET FOR PAPAIN, BY COUNTRY, 2021–2028 (USD MILLION)
                                TABLE 28 EUROPE: MARKET FOR PAPAIN, BY COUNTRY, 2021–2028 (USD MILLION)
                                TABLE 29 ASIA PACIFIC: MARKET FOR PAPAIN, BY COUNTRY, 2021–2028 (USD MILLION)
           6.2.4 ELASTASE
                    6.2.4.1 Elastase to find frequent use in dissociating tissues containing extensive intercellular fiber networks
                                TABLE 30 MARKET FOR ELASTASE, BY REGION, 2021–2028 (USD MILLION)
                                TABLE 31 NORTH AMERICA: MARKET FOR ELASTASE, BY COUNTRY, 2021–2028 (USD MILLION)
                                TABLE 32 EUROPE: MARKET FOR ELASTASE, BY COUNTRY, 2021–2028 (USD MILLION)
                                TABLE 33 ASIA PACIFIC: MARKET FOR ELASTASE, BY COUNTRY, 2021–2028 (USD MILLION)
           6.2.5 DNASE
                    6.2.5.1 Increasing demand in single-cell suspensions to propel market
                                TABLE 34 MARKET FOR DNASE, BY REGION, 2021–2028 (USD MILLION)
                                TABLE 35 NORTH AMERICA: MARKET FOR DNASE, BY COUNTRY, 2021–2028 (USD MILLION)
                                TABLE 36 EUROPE: MARKET FOR DNASE, BY COUNTRY, 2021–2028 (USD MILLION)
                                TABLE 37 ASIA PACIFIC: MARKET FOR DNASE, BY COUNTRY, 2021–2028 (USD MILLION)
           6.2.6 HYALURONIDASE
                    6.2.6.1 Increasing use of hyaluronidase as supplement for tissue dissociation to support market growth
                                TABLE 38 MARKET FOR HYALURONIDASE, BY REGION, 2021–2028 (USD MILLION)
                                TABLE 39 NORTH AMERICA: MARKET FOR HYALURONIDASE, BY COUNTRY, 2021–2028 (USD MILLION)
                                TABLE 40 EUROPE: MARKET FOR HYALURONIDASE, BY COUNTRY, 2021–2028 (USD MILLION)
                                TABLE 41 ASIA PACIFIC: MARKET FOR HYALURONIDASE, BY COUNTRY, 2021–2028 (USD MILLION)
           6.2.7 OTHER ENZYMES
                    TABLE 42 MARKET FOR OTHER ENZYMES, BY REGION, 2021–2028 (USD MILLION)
                    TABLE 43 NORTH AMERICA: MARKET FOR OTHER ENZYMES, BY COUNTRY, 2021–2028 (USD MILLION)
                    TABLE 44 EUROPE: MARKET FOR OTHER ENZYMES, BY COUNTRY, 2021–2028 (USD MILLION)
                    TABLE 45 ASIA PACIFIC: MARKET FOR OTHER ENZYMES, BY COUNTRY, 2021–2028 (USD MILLION)
    6.3 NON-ENZYMATIC DISSOCIATION AGENTS 
           6.3.1 HIGH YIELD AND OTHER BENEFITS TO DRIVE DEMAND FOR NON-ENZYMATIC PRODUCTS
                    TABLE 46 MARKET FOR NON-ENZYMATIC DISSOCIATION AGENTS, BY REGION, 2021–2028 (USD MILLION)
                    TABLE 47 NORTH AMERICA: MARKET FOR NON-ENZYMATIC DISSOCIATION AGENTS, BY COUNTRY, 2021–2028 (USD MILLION)
                    TABLE 48 EUROPE: MARKET FOR NON-ENZYMATIC DISSOCIATION AGENTS, BY COUNTRY, 2021–2028 (USD MILLION)
                    TABLE 49 ASIA PACIFIC: MARKET FOR NON-ENZYMATIC DISSOCIATION AGENTS, BY COUNTRY, 2021–2028 (USD MILLION)
    6.4 INSTRUMENTS & ACCESSORIES 
           6.4.1 INTRODUCTION OF ADVANCED BENCHTOP INSTRUMENTS TO PROPEL MARKET
                    TABLE 50 MARKET FOR INSTRUMENTS & ACCESSORIES, BY REGION, 2021–2028 (USD MILLION)
                    TABLE 51 NORTH AMERICA: MARKET FOR INSTRUMENTS & ACCESSORIES, BY COUNTRY, 2021–2028 (USD MILLION)
                    TABLE 52 EUROPE: MARKET FOR INSTRUMENTS & ACCESSORIES, BY COUNTRY, 2021–2028 (USD MILLION)
                    TABLE 53 ASIA PACIFIC: MARKET FOR INSTRUMENTS & ACCESSORIES, BY COUNTRY, 2021–2028 (USD MILLION)
 
7 CELL DISSOCIATION MARKET, BY TISSUE TYPE (Page No. - 86)
    7.1 INTRODUCTION 
          TABLE 54 CELL DISSOCIATION INDUSTRY, BY TISSUE TYPE, 2021–2028 (USD MILLION)
    7.2 CONNECTIVE TISSUE 
           7.2.1 EXTENSIVE RESEARCH ON CONNECTIVE TISSUES TO PROPEL SEGMENT GROWTH
                    FIGURE 25 NUMBER OF RESEARCH ARTICLES FOR CONNECTIVE TISSUE, 2020–2022
                    TABLE 55 MARKET FOR CONNECTIVE TISSUE, BY REGION, 2021–2028 (USD MILLION)
                    TABLE 56 NORTH AMERICA: MARKET FOR CONNECTIVE TISSUE, BY COUNTRY, 2021–2028 (USD MILLION)
                    TABLE 57 EUROPE: MARKET FOR CONNECTIVE TISSUE, BY COUNTRY, 2021–2028 (USD MILLION)
                    TABLE 58 ASIA PACIFIC: MARKET FOR CONNECTIVE TISSUE, BY COUNTRY, 2021–2028 (USD MILLION)
    7.3 EPITHELIAL TISSUE 
           7.3.1 NEW PROTOCOLS TO COMBAT DISSOCIATION-INDUCED CHANGES IN EPITHELIAL CELLS LIKELY TO SUPPORT GROWTH
                    TABLE 59 MARKET FOR EPITHELIAL TISSUE, BY REGION, 2021–2028 (USD MILLION)
                    TABLE 60 NORTH AMERICA: MARKET FOR EPITHELIAL TISSUE, BY COUNTRY, 2021–2028 (USD MILLION)
                    TABLE 61 EUROPE: MARKET FOR EPITHELIAL TISSUE, BY COUNTRY, 2021–2028 (USD MILLION)
                    TABLE 62 ASIA PACIFIC: MARKET FOR EPITHELIAL TISSUE, BY COUNTRY, 2021–2028 (USD MILLION)
    7.4 OTHER TISSUES 
          TABLE 63 MARKET FOR OTHER TISSUES, BY REGION, 2021–2028 (USD MILLION)
          TABLE 64 NORTH AMERICA: MARKET FOR OTHER TISSUES, BY COUNTRY, 2021–2028 (USD MILLION)
          TABLE 65 EUROPE: MARKET FOR OTHER TISSUES, BY COUNTRY, 2021–2028 (USD MILLION)
          TABLE 66 ASIA PACIFIC: MARKET FOR OTHER TISSUES, BY COUNTRY, 2021–2028 (USD MILLION)
 
8 CELL DISSOCIATION MARKET, BY APPLICATION (Page No. - 94)
    8.1 INTRODUCTION 
          TABLE 67 CELL DISSOCIATION INDUSTRY, BY APPLICATION, 2021–2028 (USD MILLION)
    8.2 TISSUE DISSOCIATION 
           8.2.1 INCREASING USE OF TISSUE DISSOCIATION PRODUCTS IN SINGLE-CELL ANALYSIS TO CONTRIBUTE TO SEGMENT GROWTH
                    TABLE 68 TISSUE DISSOCIATION MARKET, BY REGION, 2021–2028 (USD MILLION)
                    TABLE 69 NORTH AMERICA: TISSUE DISSOCIATION MARKET, BY COUNTRY, 2021–2028 (USD MILLION)
                    TABLE 70 EUROPE: TISSUE DISSOCIATION MARKET, BY COUNTRY, 2021–2028 (USD MILLION)
                    TABLE 71 ASIA PACIFIC: TISSUE DISSOCIATION MARKET, BY COUNTRY, 2021–2028 (USD MILLION)
    8.3 CELL DETACHMENT 
           8.3.1 USE OF CELL DETACHMENT PRODUCTS IN ADHERENT CELL CULTURES TO DRIVE MARKET
                    TABLE 72 CELL DETACHMENT MARKET, BY REGION, 2021–2028 (USD MILLION)
                    TABLE 73 NORTH AMERICA: CELL DETACHMENT MARKET, BY COUNTRY, 2021–2028 (USD MILLION)
                    TABLE 74 EUROPE: CELL DETACHMENT MARKET, BY COUNTRY, 2021–2028 (USD MILLION)
                    TABLE 75 ASIA PACIFIC: CELL DETACHMENT MARKET, BY COUNTRY, 2021–2028 (USD MILLION)
 
9 CELL DISSOCIATION MARKET, BY END USER (Page No. - 99)
    9.1 INTRODUCTION 
          TABLE 76 CELL DISSOCIATION INDUSTRY, BY END USER, 2021–2028 (USD MILLION)
    9.2 PHARMACEUTICAL & BIOTECHNOLOGY COMPANIES 
           9.2.1 PHARMA & BIOTECH COMPANIES TO HOLD LARGEST MARKET SHARE
                    TABLE 77 MARKET FOR PHARMACEUTICAL & BIOTECHNOLOGY COMPANIES, BY REGION, 2021–2028 (USD MILLION)
                    TABLE 78 NORTH AMERICA: MARKET FOR PHARMACEUTICAL & BIOTECHNOLOGY COMPANIES, BY COUNTRY, 2021–2028 (USD MILLION)
                    TABLE 79 EUROPE: MARKET FOR PHARMACEUTICAL & BIOTECHNOLOGY COMPANIES, BY COUNTRY, 2021–2028 (USD MILLION)
                    TABLE 80 ASIA PACIFIC: MARKET FOR PHARMACEUTICAL & BIOTECHNOLOGY COMPANIES, BY COUNTRY, 2021–2028 (USD MILLION)
    9.3 RESEARCH & ACADEMIC INSTITUTES 
           9.3.1 RISING FUNDING FOR CELL-BASED RESEARCH TO DRIVE MARKET
                    TABLE 81 MARKET FOR RESEARCH & ACADEMIC INSTITUTES, BY REGION, 2021–2028 (USD MILLION)
                    TABLE 82 NORTH AMERICA: MARKET FOR RESEARCH & ACADEMIC INSTITUTES, BY COUNTRY, 2021–2028 (USD MILLION)
                    TABLE 83 EUROPE: MARKET FOR RESEARCH & ACADEMIC INSTITUTES, BY COUNTRY, 2021–2028 (USD MILLION)
                    TABLE 84 ASIA PACIFIC: MARKET FOR RESEARCH & ACADEMIC INSTITUTES, BY COUNTRY, 2021–2028 (USD MILLION)
    9.4 OTHER END USERS 
          TABLE 85 MARKET FOR OTHER END USERS, BY REGION, 2021–2028 (USD MILLION)
          TABLE 86 NORTH AMERICA: MARKET FOR OTHER END USERS, BY COUNTRY, 2021–2028 (USD MILLION)
          TABLE 87 EUROPE: MARKET FOR OTHER END USERS, BY COUNTRY, 2021–2028 (USD MILLION)
          TABLE 88 ASIA PACIFIC: MARKET FOR OTHER END USERS, BY COUNTRY, 2021–2028 (USD MILLION)
 
10 CELL DISSOCIATION MARKET, BY REGION (Page No. - 107)
     10.1 INTRODUCTION 
          TABLE 89 CELL DISSOCIATION INDUSTRY, BY REGION, 2021–2028 (USD MILLION)
     10.2 NORTH AMERICA 
             10.2.1 RECESSION IMPACT
                        FIGURE 26 NORTH AMERICA: CELL DISSOCIATION MARKET SNAPSHOT
                        TABLE 90 NORTH AMERICA: MARKET, BY COUNTRY, 2021–2028 (USD MILLION)
                        TABLE 91 NORTH AMERICA: MARKET, BY PRODUCT, 2021–2028 (USD MILLION)
                        TABLE 92 NORTH AMERICA: ENZYMATIC DISSOCIATION AGENTS MARKET, BY TYPE, 2021–2028 (USD MILLION)
                        TABLE 93 NORTH AMERICA: MARKET, BY TISSUE TYPE, 2021–2028 (USD MILLION)
                        TABLE 94 NORTH AMERICA: MARKET, BY APPLICATION, 2021–2028 (USD MILLION)
                        TABLE 95 NORTH AMERICA: MARKET, BY END USER, 2021–2028 (USD MILLION)
             10.2.2 US
                        10.2.2.1 US to dominate North American market
                                      TABLE 96 US: CELL DISSOCIATION MARKET, BY PRODUCT, 2021–2028 (USD MILLION)
                                      TABLE 97 US: ENZYMATIC DISSOCIATION AGENTS MARKET, BY TYPE, 2021–2028 (USD MILLION)
                                      TABLE 98 US: MARKET, BY TISSUE TYPE, 2021–2028 (USD MILLION)
                                      TABLE 99 US: MARKET, BY APPLICATION, 2021–2028 (USD MILLION)
                                      TABLE 100 US: CELL DISSOCIATION INDUSTRY, BY END USER, 2021–2028 (USD MILLION)
             10.2.3 CANADA
                        10.2.3.1 Advancements in regenerative medicine to drive market
                                      TABLE 101 CANADA: CELL DISSOCIATION MARKET, BY PRODUCT, 2021–2028 (USD MILLION)
                                      TABLE 102 CANADA: ENZYMATIC DISSOCIATION AGENTS MARKET, BY TYPE, 2021–2028 (USD MILLION)
                                      TABLE 103 CANADA: MARKET, BY TISSUE TYPE, 2021–2028 (USD MILLION)
                                      TABLE 104 CANADA: MARKET, BY APPLICATION, 2021–2028 (USD MILLION)
                                      TABLE 105 CANADA: MARKET, BY END USER, 2021–2028 (USD MILLION)
     10.3 EUROPE 
             10.3.1 RECESSION IMPACT
                        TABLE 106 EUROPE: CELL DISSOCIATION MARKET, BY COUNTRY, 2021–2028 (USD MILLION)
                        TABLE 107 EUROPE: MARKET, BY PRODUCT, 2021–2028 (USD MILLION)
                        TABLE 108 EUROPE: ENZYMATIC DISSOCIATION AGENTS MARKET, BY TYPE, 2021–2028 (USD MILLION)
                        TABLE 109 EUROPE: MARKET, BY TISSUE TYPE, 2021–2028 (USD MILLION)
                        TABLE 110 EUROPE: MARKET, BY APPLICATION, 2021–2028 (USD MILLION)
                        TABLE 111 EUROPE: CELL DISSOCIATION INDUSTRY, BY END USER, 2021–2028 (USD MILLION)
             10.3.2 GERMANY
                        10.3.2.1 Germany to hold largest share of European market
                                      TABLE 112 GERMANY: CELL DISSOCIATION MARKET, BY PRODUCT, 2021–2028 (USD MILLION)
                                      TABLE 113 GERMANY: ENZYMATIC DISSOCIATION AGENTS MARKET, BY TYPE, 2021–2028 (USD MILLION)
                                      TABLE 114 GERMANY: MARKET, BY TISSUE TYPE, 2021–2028 (USD MILLION)
                                      TABLE 115 GERMANY: MARKET, BY APPLICATION, 2021–2028 (USD MILLION)
                                      TABLE 116 GERMANY: MARKET, BY END USER, 2021–2028 (USD MILLION)
             10.3.3 UK
                        10.3.3.1 Government investments in biotech industry to support market growth
                                      TABLE 117 UK: CELL DISSOCIATION MARKET, BY PRODUCT, 2021–2028 (USD MILLION)
                                      TABLE 118 UK: ENZYMATIC DISSOCIATION AGENTS MARKET, BY TYPE, 2021–2028 (USD MILLION)
                                      TABLE 119 UK: MARKET, BY TISSUE TYPE, 2021–2028 (USD MILLION)
                                      TABLE 120 UK: MARKET, BY APPLICATION, 2021–2028 (USD MILLION)
                                      TABLE 121 UK: CELL DISSOCIATION INDUSTRY, BY END USER, 2021–2028 (USD MILLION)
             10.3.4 FRANCE
                        10.3.4.1 Increasing R&D investments by key players to boost market
                                      TABLE 122 FRANCE: CELL DISSOCIATION MARKET, BY PRODUCT, 2021–2028 (USD MILLION)
                                      TABLE 123 FRANCE: ENZYMATIC DISSOCIATION AGENTS MARKET, BY TYPE, 2021–2028 (USD MILLION)
                                      TABLE 124 FRANCE: MARKET, BY TISSUE TYPE, 2021–2028 (USD MILLION)
                                      TABLE 125 FRANCE: MARKET, BY APPLICATION, 2021–2028 (USD MILLION)
                                      TABLE 126 FRANCE: MARKET, BY END USER, 2021–2028 (USD MILLION)
             10.3.5 ITALY
                        10.3.5.1 Large life science research base in Italy to boost market prospects
                                      TABLE 127 ITALY: CELL DISSOCIATION MARKET, BY PRODUCT, 2021–2028 (USD MILLION)
                                      TABLE 128 ITALY: ENZYMATIC DISSOCIATION AGENTS MARKET, BY TYPE, 2021–2028 (USD MILLION)
                                      TABLE 129 ITALY: MARKET, BY TISSUE TYPE, 2021–2028 (USD MILLION)
                                      TABLE 130 ITALY: MARKET, BY APPLICATION, 2021–2028 (USD MILLION)
                                      TABLE 131 ITALY: CELL DISSOCIATION INDUSTRY, BY END USER, 2021–2028 (USD MILLION)
             10.3.6 SPAIN
                        10.3.6.1 Increasing funding from private and public organizations to aid market growth
                                      TABLE 132 SPAIN: CELL DISSOCIATION MARKET, BY PRODUCT, 2021–2028 (USD MILLION)
                                      TABLE 133 SPAIN: ENZYMATIC DISSOCIATION AGENTS MARKET, BY TYPE, 2021–2028 (USD MILLION)
                                      TABLE 134 SPAIN: MARKET, BY TISSUE TYPE, 2021–2028 (USD MILLION)
                                      TABLE 135 SPAIN: MARKET, BY APPLICATION, 2021–2028 (USD MILLION)
                                      TABLE 136 SPAIN: MARKET, BY END USER, 2021–2028 (USD MILLION)
             10.3.7 REST OF EUROPE
                        TABLE 137 ROE: CELL DISSOCIATION MARKET, BY PRODUCT, 2021–2028 (USD MILLION)
                        TABLE 138 ROE: ENZYMATIC DISSOCIATION AGENTS MARKET, BY TYPE, 2021–2028 (USD MILLION)
                        TABLE 139 ROE: MARKET, BY TISSUE TYPE, 2021–2028 (USD MILLION)
                        TABLE 140 ROE: MARKET, BY APPLICATION, 2021–2028 (USD MILLION)
                        TABLE 141 ROE: CELL DISSOCIATION INDUSTRY, BY END USER, 2021–2028 (USD MILLION)
     10.4 ASIA PACIFIC 
             10.4.1 RECESSION IMPACT
                        FIGURE 27 ASIA PACIFIC: CELL DISSOCIATION MARKET SNAPSHOT
                        TABLE 142 ASIA PACIFIC: MARKET, BY COUNTRY, 2021–2028 (USD MILLION)
                        TABLE 143 ASIA PACIFIC: MARKET, BY PRODUCT, 2021–2028 (USD MILLION)
                        TABLE 144 ASIA PACIFIC: ENZYMATIC DISSOCIATION AGENTS MARKET, BY TYPE, 2021–2028 (USD MILLION)
                        TABLE 145 ASIA PACIFIC: MARKET, BY TISSUE TYPE, 2021–2028 (USD MILLION)
                        TABLE 146 ASIA PACIFIC: MARKET, BY APPLICATION, 2021–2028 (USD MILLION)
                        TABLE 147 ASIA PACIFIC: MARKET, BY END USER, 2021–2028 (USD MILLION)
             10.4.2 CHINA
                        10.4.2.1 China to dominate APAC market
                                      TABLE 148 CHINA: CELL DISSOCIATION MARKET, BY PRODUCT, 2021–2028 (USD MILLION)
                                      TABLE 149 CHINA: ENZYMATIC DISSOCIATION AGENTS MARKET, BY TYPE, 2021–2028 (USD MILLION)
                                      TABLE 150 CHINA: MARKET, BY TISSUE TYPE, 2021–2028 (USD MILLION)
                                      TABLE 151 CHINA: MARKET, BY APPLICATION, 2021–2028 (USD MILLION)
                                      TABLE 152 CHINA: CELL DISSOCIATION INDUSTRY, BY END USER, 2021–2028 (USD MILLION)
             10.4.3 JAPAN
                        10.4.3.1 Strategic developments by companies to drive market
                                      TABLE 153 JAPAN: CELL DISSOCIATION MARKET, BY PRODUCT, 2021–2028 (USD MILLION)
                                      TABLE 154 JAPAN: ENZYMATIC DISSOCIATION AGENTS MARKET, BY TYPE, 2021–2028 (USD MILLION)
                                      TABLE 155 JAPAN: MARKET, BY TISSUE TYPE, 2021–2028 (USD MILLION)
                                      TABLE 156 JAPAN: MARKET, BY APPLICATION, 2021–2028 (USD MILLION)
                                      TABLE 157 JAPAN: MARKET, BY END USER, 2021–2028 (USD MILLION)
             10.4.4 INDIA
                        10.4.4.1 Growing life sciences industry to push growth
                                      TABLE 158 INDIA: CELL DISSOCIATION MARKET, BY PRODUCT, 2021–2028 (USD MILLION)
                                      TABLE 159 INDIA: ENZYMATIC DISSOCIATION AGENTS MARKET, BY TYPE, 2021–2028 (USD MILLION)
                                      TABLE 160 INDIA: MARKET, BY TISSUE TYPE, 2021–2028 (USD MILLION)
                                      TABLE 161 INDIA: MARKET, BY APPLICATION, 2021–2028 (USD MILLION)
                                      TABLE 162 INDIA: CELL DISSOCIATION INDUSTRY, BY END USER, 2021–2028 (USD MILLION)
             10.4.5 AUSTRALIA
                        10.4.5.1 New cell/tissue culture technologies to promote market growth
                                      TABLE 163 AUSTRALIA: CELL DISSOCIATION MARKET, BY PRODUCT, 2021–2028 (USD MILLION)
                                      TABLE 164 AUSTRALIA: ENZYMATIC DISSOCIATION AGENTS MARKET, BY TYPE, 2021–2028 (USD MILLION)
                                      TABLE 165 AUSTRALIA: MARKET, BY TISSUE TYPE, 2021–2028 (USD MILLION)
                                      TABLE 166 AUSTRALIA: MARKET, BY APPLICATION, 2021–2028 (USD MILLION)
                                      TABLE 167 AUSTRALIA: MARKET, BY END USER, 2021–2028 (USD MILLION)
             10.4.6 SOUTH KOREA
                        10.4.6.1 Increasing pharmaceutical and biotech R&D investment to bolster market
                                      TABLE 168 SOUTH KOREA: CELL DISSOCIATION MARKET, BY PRODUCT, 2021–2028 (USD MILLION)
                                      TABLE 169 SOUTH KOREA: ENZYMATIC DISSOCIATION AGENTS MARKET, BY TYPE, 2021–2028 (USD MILLION)
                                      TABLE 170 SOUTH KOREA: MARKET, BY TISSUE TYPE, 2021–2028 (USD MILLION)
                                      TABLE 171 SOUTH KOREA: MARKET, BY APPLICATION, 2021–2028 (USD MILLION)
                                      TABLE 172 SOUTH KOREA: CELL DISSOCIATION INDUSTRY, BY END USER, 2021–2028 (USD MILLION)
             10.4.7 REST OF ASIA PACIFIC
                        TABLE 173 ROAPAC: CELL DISSOCIATION MARKET, BY PRODUCT, 2021–2028 (USD MILLION)
                        TABLE 174 ROAPAC: ENZYMATIC DISSOCIATION AGENTS MARKET, BY TYPE, 2021–2028 (USD MILLION)
                        TABLE 175 ROAPAC: MARKET, BY TISSUE TYPE, 2021–2028 (USD MILLION)
                        TABLE 176 ROAPAC: MARKET, BY APPLICATION, 2021–2028 (USD MILLION)
                        TABLE 177 ROAPAC: MARKET, BY END USER, 2021–2028 (USD MILLION)
     10.5 LATIN AMERICA 
             10.5.1 GOVERNMENT INVESTMENTS AND FAVORABLE FUNDING SCENARIO TO PROPEL MARKET
             10.5.2 RECESSION IMPACT
                        TABLE 178 LATIN AMERICA: CELL DISSOCIATION MARKET, BY PRODUCT, 2021–2028 (USD MILLION)
                        TABLE 179 LATIN AMERICA: ENZYMATIC DISSOCIATION AGENTS MARKET, BY TYPE, 2021–2028 (USD MILLION)
                        TABLE 180 LATIN AMERICA: MARKET, BY TISSUE TYPE, 2021–2028 (USD MILLION)
                        TABLE 181 LATIN AMERICA: MARKET, BY APPLICATION, 2021–2028 (USD MILLION)
                        TABLE 182 LATIN AMERICA: CELL DISSOCIATION INDUSTRY, BY END USER, 2021–2028 (USD MILLION)
     10.6 MIDDLE EAST & AFRICA 
             10.6.1 INCREASING R&D FUNDING FOR STEM CELL THERAPY TO BOOST MARKET
             10.6.2 RECESSION IMPACT
                        TABLE 183 MIDDLE EAST & AFRICA: CELL DISSOCIATION MARKET, BY PRODUCT, 2021–2028 (USD MILLION)
                        TABLE 184 MIDDLE EAST & AFRICA: ENZYMATIC DISSOCIATION AGENTS MARKET, BY TYPE, 2021–2028 (USD MILLION)
                        TABLE 185 MIDDLE EAST & AFRICA: MARKET, BY TISSUE TYPE, 2021–2028 (USD MILLION)
                        TABLE 186 MIDDLE EAST & AFRICA: MARKET, BY APPLICATION, 2021–2028 (USD MILLION)
                        TABLE 187 MIDDLE EAST & AFRICA: MARKET, BY END USER, 2021–2028 (USD MILLION)
 
11 COMPETITIVE LANDSCAPE (Page No. - 154)
     11.1 INTRODUCTION 
     11.2 RIGHT-TO-WIN APPROACHES ADOPTED BY KEY PLAYERS 
             FIGURE 28 CELL DISSOCIATION MARKET: STRATEGIES ADOPTED BY KEY PLAYERS
     11.3 MARKET SHARE ANALYSIS 
             FIGURE 29 MARKET: MARKET SHARE ANALYSIS OF KEY PLAYERS (2022)
             TABLE 188 MARKET: DEGREE OF COMPETITION
     11.4 REVENUE ANALYSIS 
             FIGURE 30 REVENUE ANALYSIS OF TOP FIVE MARKET PLAYERS (2020–2022)
     11.5 COMPANY EVALUATION QUADRANT (2022) 
             11.5.1 STARS
             11.5.2 EMERGING LEADERS
             11.5.3 PERVASIVE PLAYERS
             11.5.4 PARTICIPANTS
                        FIGURE 31 CELL DISSOCIATION INDUSTRY: COMPANY EVALUATION MATRIX, 2022
     11.6 COMPANY EVALUATION QUADRANT FOR START-UPS/SMES (2022) 
             11.6.1 PROGRESSIVE COMPANIES
             11.6.2 STARTING BLOCKS
             11.6.3 RESPONSIVE COMPANIES
             11.6.4 DYNAMIC COMPANIES
                        FIGURE 32 MARKET: COMPANY EVALUATION MATRIX FOR START-UPS/SMES, 2022
     11.7 COMPETITIVE BENCHMARKING OF START-UPS/SMES 
             TABLE 189 MARKET: DETAILED LIST OF KEY START-UPS/SMES
             TABLE 190 MARKET: COMPETITIVE BENCHMARKING OF KEY START-UPS/SMES
     11.8 COMPETITIVE SCENARIO AND TRENDS 
             11.8.1 PRODUCT LAUNCHES
                        TABLE 191 CELL DISSOCIATION INDUSTRY: PRODUCT LAUNCHES, JANUARY 2020 TO JANUARY 2023
             11.8.2 DEALS
                        TABLE 192 CELL DISSOCIATION MARKET: DEALS, JANUARY 2020 TO JANUARY 2023
 
12 COMPANY PROFILES (Page No. - 165)
     12.1 KEY PLAYERS 
(Business Overview, Products/Services/Solutions Offered, MnM View, Key Strengths and Right to Win, Strategic Choices Made, Weaknesses and Competitive Threats, Recent Developments)*
             12.1.1 THERMO FISHER SCIENTIFIC
                        TABLE 193 THERMO FISHER SCIENTIFIC: BUSINESS OVERVIEW
                        FIGURE 33 THERMO FISHER SCIENTIFIC: COMPANY SNAPSHOT (2021)
             12.1.2 MERCK KGAA
                        TABLE 194 MERCK KGAA: BUSINESS OVERVIEW
                        FIGURE 34 MERCK KGAA: COMPANY SNAPSHOT (2021)
             12.1.3 CYTIVA (DANAHER CORPORATION)
                        TABLE 195 CYTIVA: BUSINESS OVERVIEW
                        FIGURE 35 DANAHER CORPORATION: COMPANY SNAPSHOT (2021)
             12.1.4 BECTON, DICKINSON AND COMPANY
                        TABLE 196 BECTON, DICKINSON AND COMPANY: BUSINESS OVERVIEW
                        FIGURE 36 BD: COMPANY SNAPSHOT (2021)
             12.1.5 CORNING INC.
                        TABLE 197 CORNING INC.: BUSINESS OVERVIEW
                        FIGURE 37 CORNING INC.: COMPANY SNAPSHOT (2020)
             12.1.6 STEMCELL TECHNOLOGIES
                        TABLE 198 STEMCELL TECHNOLOGIES: BUSINESS OVERVIEW
             12.1.7 PROMOCELL GMBH
                        TABLE 199 PROMOCELL GMBH: BUSINESS OVERVIEW
             12.1.8 MILTENYI BIOTEC
                        TABLE 200 MILTENYI BIOTEC: BUSINESS OVERVIEW
             12.1.9 ATCC
                        TABLE 201 ATCC: BUSINESS OVERVIEW
             12.1.10 HIMEDIA LABORATORIES
                        TABLE 202 HIMEDIA LABORATORIES: BUSINESS OVERVIEW
             12.1.11 PAN-BIOTECH
                        TABLE 203 PAN-BIOTECH: BUSINESS OVERVIEW
             12.1.12 CELLSYSTEMS GMBH
                        TABLE 204 CELLSYSTEMS: BUSINESS OVERVIEW
             12.1.13 AMSBIO
                        TABLE 205 AMSBIO: BUSINESS OVERVIEW
             12.1.14 NEUROMICS
                        TABLE 206 NEUROMICS: BUSINESS OVERVIEW
*Business Overview, Products/Services/Solutions Offered, MnM View, Key Strengths and Right to Win, Strategic Choices Made, Weaknesses and Competitive Threats, Recent Developments might not be captured in case of unlisted companies.
     12.2 OTHER PLAYERS 
             12.2.1 VITACYTE
             12.2.2 ALSTEMBIO
             12.2.3 BIOLOGICAL INDUSTRIES (SARTORIUS)
             12.2.4 GEMINIBIO
             12.2.5 INNOVATIVE CELL TECHNOLOGIES, INC.
             12.2.6 CENTRAL DRUG HOUSE (P) LTD.
             12.2.7 WORTHINGTON BIOCHEMICAL CORPORATION
             12.2.8 CAPRICORN SCIENTIFIC
             12.2.9 ABEOMICS
             12.2.10 GENLANTIS
 
13 APPENDIX (Page No. - 198)
     13.1 DISCUSSION GUIDE 
     13.2 KNOWLEDGESTORE: MARKETSANDMARKETS’ SUBSCRIPTION PORTAL 
     13.3 CUSTOMIZATION OPTIONS 
     13.4 RELATED REPORTS 
     13.5 AUTHOR DETAILS 

This study involved four major activities in estimating the current size of the cell dissociation market. Exhaustive secondary research was carried out to collect information on the market, its peer markets, and its parent market. The next step was to validate these findings, assumptions, and sizing with industry experts across the value chain through primary research. Both top-down and bottom-up approaches were employed to estimate the complete market size. After that, market breakdown and data triangulation procedures were used to estimate the market size of segments.

Secondary Research

Secondary research was used mainly to identify and collect information for the extensive, technical, market-oriented, and commercial study of the cell dissociation market. The secondary sources used for this study include publications from government sources National Cancer Institute (NCI), Cancer Research UK, Israel Cancer Research Fund (ICRF), Department of Health and Social Care (DHSC), Global Cancer Observatory (GLOBOCAN), Breast Cancer Research Foundation (BCRF), Centre for Cellular and Molecular Biology (CCMB), Chinese Academy of Medical Sciences (CAMS), National Centre for Cell Science (NCCS), Annual Reports, SEC Fillings, Press Releases, Investor Presentation, Expert Interviews, and MarketsandMarkets Analysis. These sources were also used to obtain key information about major players, market classification, and segmentation according to industry trends, regional/country-level markets, market developments, and technology perspectives.

Primary Research

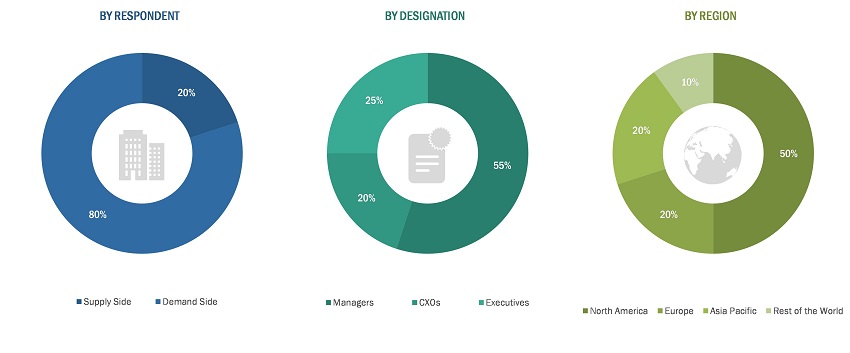
In-depth interviews were conducted with various primary respondents, including key industry participants, subject-matter experts (SMEs), C-level executives of key market players, and industry consultants, among other experts, to obtain and verify the critical qualitative and quantitative information as well as assess prospects of the market. Various primary sources from both the supply and demand sides of the market were interviewed to obtain qualitative and quantitative information.

The following is a breakdown of the primary respondents:
Cell Dissociation Market Size

To know about the assumptions considered for the study, download the pdf brochure

Market Size Estimation

Both top-down and bottom-up approaches were used to estimate and validate the total size of the cell dissociation market. These methods were also used extensively to estimate the size of various subsegments in the market. The research methodology used to estimate the market size includes the following:

  • The key players in the industry and markets have been identified through extensive secondary research
  • The industry’s supply chain and market size, in terms of value, have been determined through primary and secondary research processes
  • All percentage shares, splits, and breakdowns have been determined using secondary sources and verified through primary sources

Data Triangulation

After arriving at the overall market size—using the market size estimation processes—the market was split into several segments and subsegments. To complete the overall market engineering process and arrive at the exact statistics of each market segment and subsegment, the data triangulation, and market breakdown procedures were employed, wherever applicable. The data was triangulated by studying various factors and trends from both the demand and supply sides in the cell dissociation industry.

Report Objectives

  • To define, describe, and forecast the global cell dissociation market based on product, tissue type, application, end user, and region
  • To provide detailed information regarding the major factors influencing the growth of the market (drivers, restraints, opportunities, and industry-specific challenges)
  • To strategically analyze micromarkets1 with respect to individual growth trends, future prospects, and contributions to the total market
  • To analyze opportunities in the market for stakeholders and provide details of the competitive landscape for market leaders
  • To forecast the size of market segments with respect to four main regions—North America, Europe, Asia Pacific, Latin America and the Middle East and Africa
  • To strategically profile key players and comprehensively analyze their product portfolios, market shares, and core competencies
  • To track and analyze competitive developments such as acquisitions, new product launches, expansions, regulatory approvals, and agreements in the cell dissociation market

Available Customizations

With the given market data, MarketsandMarkets offers customizations as per the company’s specific needs. The following customization options are available for the report:

Product Analysis:

  • Product matrix, which gives a detailed comparison of the product portfolios of each company

Geographic Analysis:

  • Further breakdown of the Rest of the World cell dissociation market into Latin America, the Middle East, and Africa cell dissociation market.
Custom Market Research Services

We will customize the research for you, in case the report listed above does not meet with your exact requirements. Our custom research will comprehensively cover the business information you require to help you arrive at strategic and profitable business decisions.

Request Customization

Instant Answers with GPT - Ask Now!

Ask real questions. Get complete answers !
Report Code
BT 6129
Published ON
Mar, 2023
Choose License Type
BUY NOW
  • SHARE
X
Request Customization
Speak to Analyst
Speak to Analyst
OR FACE-TO-FACE MEETING
PERSONALIZE THIS RESEARCH
  • Triangulate with your Own Data
  • Get Data as per your Format and Definition
  • Gain a Deeper Dive on a Specific Application, Geography, Customer or Competitor
  • Any level of Personalization
REQUEST A FREE CUSTOMIZATION
LET US HELP YOU!
  • What are the Known and Unknown Adjacencies Impacting the Cell Dissociation Market
  • What will your New Revenue Sources be?
  • Who will be your Top Customer; what will make them switch?
  • Defend your Market Share or Win Competitors
  • Get a Scorecard for Target Partners
CUSTOMIZED WORKSHOP REQUEST
  • Call Us
  • +1-888-600-6441 (Corporate office hours)
  • +1-888-600-6441 (US/Can toll free)
  • +44-800-368-9399 (UK office hours)
CONNECT WITH US
ABOUT TRUST ONLINE
©2024 MarketsandMarkets Research Private Ltd. All rights reserved
DMCA.com Protection Status
Website Feedback