Cell Line Development Market by Product (Equipment, Media and Reagents), Source, type & by Application ( Bioproduction, Tissue Engineering & Regenerative medicine, Toxicity Testing, Research, Drug Discovery) - Analysis & Global Forecast to 2019


The global cell line development market is segmented on the basis of products, sources, types of cell lines, applications, and geographies. Based on products, the global market is categorized into equipment and media and reagents. The media and reagents segment is further divided into serum, media, and reagents.
The cell line development market, by type of cell lines is segmented into primary cell lines, continuous cell lines, hybridomas, and recombinant cell lines. On the basis of source, the market is segmented into mammalians, insects, and amphibians. On the basis of applications, the market is segmented into bioproduction, tissue engineering and regenerative medicine, toxicity testing, research, and drug discovery
Factors such as increasing demand for monoclonal antibodies, rising vaccine production, and use of innovative technologies propel the growth of the market. Some of the opportunities for the market are low income countries like India and Africa lacking access to basic healthcare and increasing risk of pandemic and communicable diseases. However, in spite of innovative technologies in the market, developing stable and authentic cell lines remains a major challenge of this market.
Some of the major players in the global cell line development market include American Type Culture Collection (ATCC) (U.S.), Lonza Group AG (Switzerland), Thermo Fisher Scientific, Inc. (U.S.), GE Healthcare (U.K.), Sigma-Aldrich Corporation (U.S.), Selexis SA (Switzerland), European Collection of Cell Cultures (ECACC) (U.K.), Corning, Inc. (U.S.), WuXi AppTec, Inc. (China), and Sartorious AG (Germany).
Scope of the Report
This research report categorizes the cell line development market into the following segments and subsegments:
By Product
- Equipment
- Biosafety Cabinets
- Cell Counters and Viability Systems
- Incubators
- Centrifuges
- Bioreactors
- Storage Equipment
- Cell Culture Refrigerators and Freezers
- Cell Culture Cryogenic Storage
- Automated Systems
- Microscopes
- Filtration Systems
- Others
- Media and Reagents
- Serum
- Fetal Bovine Serum
- Adult Bovine Serum
- Other Animal Serum
- Media
- Minimum Essential Media
- Reduced Serum Media
- Serum-free Media
- Reagents
- Supplements and Growth Factors
- Buffers and Chemicals
- Cell Dissociation Reagents
- Cryopreservative Reagents
- Others
- Serum
By Source
- Mammalians
- Insects
- Amphibians
By Type of Cell Lines
- Primary Cell Lines
- Continuous Cell Lines
- Hybridomas
- Recombinant Cell Lines
By Application
- Bioproduction
- Diagnostics
- Vaccines
- Recombinant Protein Therapeutics
- Tissue Engineering & Regenerative Medicines
- Toxicity Testing
- Research
- Drug Discovery
By Geography
- North America
- U.S
- Canada
- Europe
- France
- Germany
- U.K.
- Rest of Europe
- Asia
- Rest of the World (RoW)
The cell line development market is highly competitive with a large number of players, including both big and small players, operating in this market. Cell lines are used in many pharmaceutical and biotechnology industries, academic research institutes, and diagnostic laboratories. In order to develop high-yielding and stable cell lines, companies and research institutes are engaged in research activities to develop more efficient technologies for development of cell lines.
The global market is segmented on the basis of product, source, type, application, and geography. The global market, by product is categorized into equipment and media and reagents. The media and reagents segment is further divided into serum, media, and reagents. The reagents market is expected to account for the largest share of the market. However, media is expected to be the fastest-growing segment in the reagents market.
The cell line development market, by type is divided into primary cell lines, continuous cell lines, hybridomas, and recombinant cell lines. Recombinant cell lines accounted for the largest share of the market, by type. However, the primary cell lines segment is expected to grow at the fastest rate in the market, by type.
Based on the source of cell lines, the market is segmented into mammalians, insects, and amphibians. The mammalian segment is the largest and the fastest growing segment of the market, by source.
On the basis of applications, the market is segmented into bioproduction, tissue engineering and regenerative medicine, toxicity testing, research, and drug discovery. In 2014, the bioproduction segment accounted for the largest share of the cell line development application market, as cell lines are extensively used in diagnostics, vaccine production, and manufacturing of recombinant protein therapeutics.
The key factors that are expected to spur this market are increased demand for monoclonal antibodies, rising vaccine production, and use of innovative technologies. However, developing stable and authentic cell lines poses a major challenge for this market. Some of the opportunities for cell line development market are low income countries and increasing risk of pandemics and communicable diseases.
On the basis of geography, this market is classified into four regions, namely, North America, Europe, Asia, and Rest of the World (RoW).
Global Cell Line Development Market Size, by Geography, 2014 � 2019
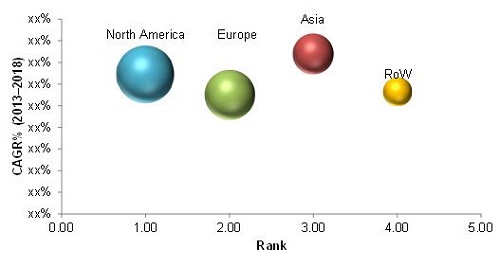
Source: MarketsandMarkets Analysis
The global cell line development market is expected to reach $3.96 billion by 2019 from $2.2 billion in 2014, and is expected to grow at a CAGR of 12.5% from 2014 to 2019. The market is dominated by North America, followed by Europe, Asia, and Rest of the World (RoW). North America is expected to maintain its leadership position in the market in the coming years.
Some of the major players in the global market include American Type Culture Collection (ATCC) (U.S.), Lonza Group AG (Switzerland), Thermo Fisher Scientific, Inc. (U.S.), GE Healthcare (U.K.), Sigma Aldrich Corporation (U.S.), Selexis SA (Switzerland), European Collection of Cell Cultures (ECACC) (U.K.), Corning, Inc. (U.S.), Wuxi App Tec, Inc. (China), and Sartorious AG (Germany).
 Exclusive indicates content/data unique to MarketsandMarkets and not available with any competitors.
Table of Contents
1 Introduction (Page No.- 19)
1.1 Objectives of the Study
1.2 Markets Covered
1.3 Stakeholders
2 Research Methodology (Page No.- 22)
2.1 Secondary and Primary Research Methodology
2.1.1 Secondary Research
2.2 Key Data From Secondary Sources
2.2.1 Primary Research
2.3 Key Data From Primary Sources
2.4 Key Insights From Primary Sources
2.4.1 Key Industry Insights 27
2.5 Market Size Estimation Methodology
2.6 Market Forecast Methodology
2.7 Market Data Validation and Data Triangulation
2.8 Assumptions
2.9 Limitations
3 Executive Summary (Page No.- 32)
4 Premium Insights (Page No.- 36)
4.1 Market Size
4.2 Cell Line Development Market, By Geography and Type
4.3 Geographical Snapshot
4.4 Market Share, By Product
4.5 Life Cycle Analysis, By Geography
5 Market Overview (Page No.- 40)
5.1 Introduction
5.2 Market Dynamics
5.2.1 Drivers
5.2.1.1 Global Increase in Demand for Monoclonal Antibodies
5.2.1.2 Innovative Technologies Accelerating the Scale-Up of Cell Lines
5.2.1.3 Rise in Vaccine Production
5.2.2 Challenge
5.2.2.1 Developing Stable and Authentic Cell Lines
5.2.3 Opportunities
5.2.3.1 Increasing Risk of Pandemics and Communicable Diseases
5.2.3.2 Low Income Countries to Create Opportunities for the Cell Line Market
6 Industry Insights (Page No.- 46)
6.1 Introduction
6.2 Competitive Positioning, By Key Player (2014)
6.2.1 Introduction
6.2.2 Key Highlights
6.3 Cell Line Development Market: Emperical Assessment of Growth Strategies
6.3.1 Route to Growth Strategies: Organic and Inorganic Growth Strategies 50
6.3.2inorganic Growth Strategies 51
6.3.3organic Growth Strategies 52
6.4 Technology Assessment
6.4.1 Expression Systems
6.4.1.1 Methotrexate Amplification (DHFR) Technology
6.4.1.2 Glutamine Synthatase (GS) Technology
6.4.1.3 Viral-Based Technology
7 Global Cell Line Development Market, By Product (Page No.- 55)
7.1 Introduction
7.2 Cell Line Development Market, By Product
7.3 Global Cell Line Development Market, By Equipment
7.3.1 Introduction
7.3.2 Biosafety Cabinets
7.3.3 Cell Counters & Viability Analysis Systems
7.3.4 Incubators
7.3.5 Centrifuges
7.3.6 Bioreactors
7.3.7 Storage Equipment
7.3.7.1 Refrigerators & Freezers
7.3.7.2 Cryostorage Systems
7.3.8 Automation Systems
7.3.9 Microscopes
7.3.10 Filtration Systems
7.3.11 Other Equipment
7.4 Global Cell Line Development Market, By Media & Reagents
7.4.1 Introduction
7.4.2 Cell Line Media & Reagents
7.4.2.1 Sera
7.4.2.1.1 Fetal Bovine Sera (FBS)
7.4.2.1.2 Adult Bovine Sera (ABS)
7.4.2.1.3 Other Animal Sera
7.4.2.2 Media
7.4.2.2.1 Minimum Essential Media (MEM)
7.4.2.2.2 Reduced Serum Media
7.4.2.2.3 Serum-Free Media (SFM)
7.4.2.3 Reagents
7.4.2.3.1 Supplements & Growth Factors
7.4.2.3.2 Buffers & Chemicals
7.4.2.3.3 Cell Dissociation Reagents
7.4.2.3.4 Cryopreservative Reagents
7.4.2.3.5 Other Reagents
8 Cell Line Development Market, By Source (Page No.- 90)
8.1introduction
8.2 Mammalian
8.3 Insect
8.4 Amphibian
9 Cell Line Development Market, By Type (Page No.- 96)
9.1 Introduction
9.2 Primary Cell Lines
9.3 Continuous Cell Lines
9.4 Hybridomas
9.5 Recombinant Cell Lines
10 Global Cell Line Development Market, By Application (Page No.- 104)
10.1 Introduction
10.2 Bioproduction
10.2.1 Diagnostics
10.2.2 Vaccine Production
10.2.3 Recombinant Protein Therapeutics
10.3 Tissue Engineering & Regenerative Medicine
10.4 toxicity Testing
10.5 Research
10.6 Drug Discovery
10.6.1 Target Validation
10.6.2 Disease Modeling
10.6.3 Drug Screening and Development
11 Cell Line Development Market, By Geography (Page No.- 116)
11.1 Introduction
11.2 North America
11.2.1 U.S.
11.2.1.1 R&D Investments By Pharmaceutical Companies in the U.S. to Propel the Cell Line Development Market
11.2.1.2 Rise in Funding for Vaccine Production Likely to Fuel Demand of Cell Line Market
11.2.1.3 Conferences on Cell Line to Propel Growth of Market
11.2.2 Canada
11.2.2.1 Increasing Investments on Regenerative Medicines By Canadian Government to Spur the Market
11.3 Europe
11.3.1 Flourishing Vaccine Market in Europe�A Major Propellant for the Cell Line Development Market
11.3.2 France
11.3.2.1 Increasing Use of Cell Lines for Vaccine Production to Spur Market in France
11.3.3 Germany
11.3.3.1 Advances in Biotechnology Fueling the Cell Line Development Market in Germany
11.3.4 U.K.
11.3.4.1 Conferences on Cell Line to Spur Market in the U.K.
11.3.5 Rest of Europe (ROE)
11.3.5.1 Increasing Research on Regenerative Medicines in Spain to Propel the Cell Line Market
11.4 Asia
11.4.1 India
11.4.1.1 Growing Pharmaceutical Industry to Propel the Market in India
11.4.2 China
11.4.2.1 Developing Pharmaceutical Industry to Spur the Market in China
11.4.3 Japan
11.4.3.1 Rise in Production of Vaccines in Japan to Propel the Use of Cell Lines
11.4.3.2 Regenerative Medicine, Biomedical, and Medical Research in Japan is on the Rise
11.4.4 Rest of Asia (Roa)
11.4.4.1 Initiation of Measles-Rubella Combined Vaccine Production in Vietnam
11.4.4.2 Government-Supported Strong Academic and Commercial R&D Activities in Taiwan
11.5 Rest of the World (ROW)
11.5.1 Pacific Countries
11.5.1.1 Federal Collaborations in Australia to Bolster the Demand of Cell Lines
11.5.1.2 Favorable Regulatory Changes to Drive the Market in New Zealand and Australia
11.5.2 Brazil
11.5.2.1 Flourishing Biotechnology and Pharmaceutical Markets in Brazil to Bolster the Cell Line Development Market
11.5.3 Africa
11.5.3.1 Increasing Focus on Africa By Pharmaceutical Companies Likely to Create Avenues for Cell Line Development Market
12 Competitive Landscape (Page No.- 157)
12.1 Overview
12.2 Market Share Analysis, Cell Line Development Market
12.2.1 Introduction
12.2.1.1 American Type Culture Collection (ATCC) (U.S.)
12.2.1.2 Lonza Group AG (Switzerland)
12.2.1.3 Thermo Fisher Scientific, Inc. (U.S.)
12.3 Competitive Situation and Trends
12.3.1 Agreements, Partnerships, and Collaborations
12.3.2 New Product Launches
12.3.3 Expansions
12.3.4 Acquisitions
12.3.5 Others
13 Company Profiles (Page No.- 168)
(Overview, Financials, Products & Services, Strategy, & Developments)*
13.1 Introduction
13.2 American Type Culture Collection (ATCC)
13.3 Corning, Inc.
13.4 European Collection of Cell Cultures (ECACC)
13.5 Ge Healthcare
13.6 Lonza Group AG
13.7 Sartorius AG
13.8 Selexis SA
13.9 Sigma-Aldrich Corporation
13.10 Thermo Fisher Scientific, Inc.
13.11 Wuxi Apptec
*Details on Financials, Product & Services, Strategy, & Developments Might Not Be Captured in Case of Unlisted Companies.
14 Appendix (Page No.- 208)
14.1 Discussion Guide
14.2 Introducing RT: Real Time Market Intelligence
14.3 Available Customizations
14.4 Related Reports
List of Tables (114 Tables)
Table 1 Drivers Propelling the Growth of Cell Line Development Market
Table 2 Challenge of Cell Line Development Market
Table 3 Opportunies for Cell Line Development Market
Table 4 Market Size, By Product, 2012�2019 ($Million)
Table 5 Market Size for Equipment, By Region, 2012�2019 ($Million)
Table 6 Market Size, By Equipment, 2012�2019 ($Million)
Table 7 Market Size for Biosafety Cabinets, By Region,2012�2019 ($Million)
Table 8 Market Size for Cell Counters & Viability Analysis Systems, By Region, 2012�2019 ($Million)
Table 9 Market Size for Incubators, By Region, 2012�2019 ($Million)
Table 10 Cell Line Development Market Size for Centrifuges, By Region, 2012�2019 ($Million)
Table 11 Market Size for Bioreactors, By Region, 2012�2019 ($Million)
Table 12 Cell Line Development Market Size for Storage Equipment,By Region,2012�2019 ($Million)
Table 13 Cell Line Development Market Size for Storage Equipment, By Segment,2012�2019 ($Million)
Table 14 Market Size for Refrigerators & Freezers, By Region, 2012�2019 ($Million)
Table 15 Market Size for Cryostorage Systems, By Region, 2012�2019 ($Million)
Table 16 Market Size for Automation Systems, By Region,2012�2019 ($Million)
Table 17 Cell Line Development Market Size for Microscopes, By Region, 2012�2019 ($Million)
Table 18 Market Size for Filtration Systems, By Region,2012�2019 ($Million)
Table 19 Market Size for Other Equipment, By Region,2012�2019 ($Million)
Table 20 Cell Line Development Market Size for Media & Reagents, By Segment,2012�2019 ($Million)
Table 21 Market Size for Media & Reagents, By Region,2012�2019 ($Million)
Table 22 Market Size for Sera, By Region, 2012�2019 ($Million)
Table 23 Market Size for Sera, By Segment, 2012�2019 ($Million)
Table 24 Cell Line Development Market Size for Fetal Bovine Sera, By Region,2012�2019 ($Million)
Table 25 Cell Line Development Market Size for Adult Bovine Sera, By Region,2012�2019 ($Million)
Table 26 Market Size for Other Animal Sera, By Region,2012�2019 ($Million)
Table 27 Market Size for Media, By Region, 2012�2019 ($Million)
Table 28 Market Size for Media, By Segment, 2012�2019 ($Million)
Table 29 Market Size for Minimum Essential Media, By Region, 2012�2019 ($Million)
Table 30 Market Size for Reduced Serum Media, By Region, 2012�2019 ($Million)
Table 31 Cell Line Development Market Size for Serum-Free Media, By Region,2012�2019 ($Million)
Table 32 Market Size for Reagents, By Region, 2012�2019 ($Million)
Table 33 Market Size for Reagents, By Segment, 2012�2019 ($Million)
Table 34 Market Size for Supplements & Growth Factors,By Region, 2012�2019 ($Million)
Table 35 Market Size for Buffers & Chemicals, By Region,2012�2019 ($Million)
Table 36 Market Size for Cell Dissociation Reagents, By Region, 2012�2019 ($Million)
Table 37 Market Size for Cryopreservative Reagents, By Region, 2012�2019 ($Million)
Table 38 Market Size for Other Reagents, By Region,2012�2019 ($Million)
Table 39 Market Size, By Source, 2012�2019 ($Million)
Table 40 Types of Mammalian Cell Lines and Their Applications
Table 41 Market Size for Mammalian Sources, By Region,2012�2019 ($Million)
Table 42 Market Size for Insect Sources, By Region,2012�2019 ($Million)
Table 43 Market Size for Amphibian Sources, By Region,2012�2019 ($Million)
Table 44 Market Size, By Type, 2012�2019 ($Million)
Table 45 Market Size for Primary Cell Lines, By Region,2012�2019 ($Million)
Table 46 Market Size for Continuous Cell Lines, By Region, 2012�2019 ($Million)
Table 47 Market Size for Hybridomas, By Region, 2012�2019 ($Million)
Table 48 Biologics Produced Using Cho Cells (2006-2012)
Table 49 Market Size for Recombinant Cell Lines, By Region,2012�2019 ($Million)
Table 50 Cell Line Development Applications Market Size, By Region, 2012�2019 ($Million)
Table 51 Cell Line Development Market Size, By Application, 2012�2019 ($Million)
Table 52 Market Size for Bioproduction, By Region,2012�2019 ($Million)
Table 53 Market Size for Bioproduction, By Segment,2012�2019 ($Million)
Table 54 Cell Line Development Market Size for Diagnostics, By Region, 2012�2019 ($Million)
Table 55 Market Size for Vaccine Production, By Region,2012�2019 ($Million)
Table 56 Market Size for Recombinant Protein Therapeutics,By Region, 2012�2019 ($Million)
Table 57 Market Size for Tissue Engineering & Regenerative Medicine, By Region, 2012�2019 ($Million)
Table 58 Cell Line Development Market Size for toxicity Testing, By Region,2012�2019 ($Million)
Table 59 Market Size for Research Applications, By Region, 2012�2019 ($Million)
Table 60 Market Size for Drug Discovery, By Region,2012�2019 ($Million)
Table 61 Cell Line Development Market Size, By Region, 2012�2019 ($Million)
Table 62 North America: Cell Line Development Market Size, By Product, 2012�2019 ($Million)
Table 63 North America: Equipment Market Size, 2012�2019 ($Million)
Table 64 North America: Media & Reagents Market Size, 2012�2019 ($Million)
Table 65 North America: Market Size, By Source, 2012�2019 ($Million)
Table 66 North America: Market Size, By Type, 2012�2019 ($Million)
Table 67 North America: Market Size, By Application, 2012�2019 ($Million)
Table 68 U.S.: Cell Line Development Market Size, By Product, 2012�2019 ($Million)
Table 69 U.S.: Market Size, By Source, 2012�2019 ($Million)
Table 70 U.S.: Cell Line Development Market Size, By Type, 2012�2019 ($Million)
Table 71 U.S.: Market Size, By Application, 2012�2019 ($Million)
Table 72 Canada: Market Size, By Product, 2012�2019 ($Million)
Table 73 Canada: Market Size, By Source, 2012�2019 ($Million)
Table 74 Canada: Cell Line Development Market Size, By Type, 2012�2019 ($Million)
Table 75 Canada: Market Size, By Application, 2012�2019 ($Million)
Table 76 Europe: Cell Line Development Market Size, By Product, 2012�2019 ($Million)
Table 77 Europe: Cell Line Development Equipment Market Size, 2012�2019 ($Million)
Table 78 Europe: Cell Line Development Media & Reagents Market Size, 2012�2019 ($Million)
Table 79 Europe: Market Size, By Source, 2012�2019 ($Million)
Table 80 Europe: Cell Line Development Market Size, By Type, 2012�2019 ($Million)
Table 81 Europe: Market Size, By Application, 2012�2019 ($Million)
Table 82 France: Market Size, By Product, 2012�2019 ($Million)
Table 83 France: Market Size, By Source, 2012�2019 ($Million)
Table 84 France: Market Size, By Type, 2012�2019 ($Million)
Table 85 France: Market Size, By Application, 2012�2019 ($Million)
Table 86 Germany: Market Size, By Product, 2012�2019 ($Million)
Table 87 Germany: Market Size, By Source, 2012�2019 ($Million)
Table 88 Germany: Cell Line Development Market Size, By Type, 2012�2019 ($Million)
Table 89 Germany: Market Size, By Application, 2012�2019 ($Million)
Table 90 U.K.: Market Size, By Product, 2012�2019 ($Million)
Table 91 U.K.: Market Size, By Source, 2012�2019 ($Million)
Table 92 U.K.: Market Size, By Type, 2012�2019 ($Million)
Table 93 U.K.: Market Size, By Application, 2012�2019 ($Million)
Table 94 ROE: Market Size, By Product, 2012�2019 ($Million)
Table 95 ROE: Market Size, By Source, 2012�2019 ($Million)
Table 96 ROE: Market Size, By Type, 2012�2019 ($Million)
Table 97 ROE: Market Size, By Application, 2012�2019 ($Million)
Table 98 Asia: Market Size, By Product, 2012�2019 ($Million)
Table 99 Asia: Cell Line Development Equipment Market Size, 2012�2019 ($Million)
Table 100 Asia: Media & Reagents Market Size, 2012�2019 ($Million)
Table 101 Asia: Market Size, By Source, 2012�2019 ($Million)
Table 102 Asia: Market Size, By Type, 2012�2019 ($Million)
Table 103 Asia: Market Size, By Application, 2012�2019 ($Million)
Table 104 ROW: Cell Line Development Market Size, By Product, 2012�2019 ($Million)
Table 105 ROW: Cell Line Development Equipment Market Size, 2012�2019 ($Million)
Table 106 ROW: Cell Line Development Media & Reagents Market Size, 2012�2019 ($Million)
Table 107 ROW: Market Size, By Source, 2012�2019 ($Million)
Table 108 ROW: Market Size, By Type, 2012�2019 ($Million)
Table 109 ROW: Market Size, By Application, 2012�2019 ($Million)
Table 110 Agreements, Partnerships, and Collaborations 2011�2014
Table 111 New Product Launches, 2011�2013
Table 112 Expansions, 2011�2014
Table 113 Acquisitions, 2011�2014
Table 114 Others, 2011�2014
List of Figures (64 Figures)
Figure 1 Market Segmentation
Figure 2 Research Methodology Steps
Figure 3 Sampling Frame: Primary Research
Figure 4 Break Down of Primary Interviews: By Company Type, Designation, and Region
Figure 5 Market Size Estimation Methodology: Bottom-Up Approach
Figure 6 Market Size Estimation Methodology: Top-Down Approach
Figure 7 Market forecast Methodology
Figure 8 Data Triangulation Methodology
Figure 9 Market Snapshot, By Product, 2014�2019 32
Figure 10 Media and Reagents Market To Witness Highest CAGR of 13% From 2014 To 2019 33
Figure 11 Market Share, 2014
Figure 12 Market Overview
Figure 13 North America Accounts for Largest Share of Market; Recombinant Cell Lines Accounts for 70% of Market, By Type
Figure 14 Asian Cell Line Market To Grow At the Highest CAGR Between 2014 and 2019
Figure 15 Media and Reagents To Command Over 50% of the Market Share, 2014 Vs. 2019 38
Figure 16 ROW is Expected To Enter the Exponential Growth Phase in the Coming Years
Figure 17 increasing Demand for Monoclonal Antibodies To Spur the Demand for This Market
Figure 18 Competitive Positioning, By Key Player (2014)
Figure 19 Competitive Positioning, By Key Player (2014)
Figure 20 Evolution of Cell Line Development Technologies
Figure 21 Comparative Technology Assessment � Cell Line Market
Figure 22 The Media & Reagents Segment is Expected To Grow At A Faster Pace Than the Equipment Segment From 2014 To 2019
Figure 23 Asia is Expected To Be the Fastest-Growing Cell Line Market At A CAGR of 14.8% From 2014 To 2019
Figure 24 North America is Expected To Account for the Largest Share of the Cell Line Equipment Market in 2014
Figure 25 The Other Equipment Segment is Expected To Command the Largest Share of the Cell Line Equipment Market in 2014
Figure 26 Refrigerators & Freezers Segment is Expected To Account for the Largest Share of 70% of the Cell Line Market for Storage Equipment in 2014
Figure 27 The Reagents Segment is Expected To Dominate the Cell Line Market
Figure 28 Asia is the Fastest-Growing Regional Segment of the Cell Line Market for Media & Reagents
Figure 29 Cell Line Market for Sera, By Segment
Figure 30 The Fetal Bovine Sera Segment is Expected To Command 60% of the Cell Line Market, Growing At the Highest CAGR of 5.8%
Figure 31 Cell Line Market for Media, By Segment
Figure 32 Minimal Essential Media To Grow At A Higher Rate From 2014 To 2019
Figure 33 Cell Line Market for Reagents, By Segment
Figure 34 The Supplements & Growth Factors Segment is Expected To Account for More Than 54% of the Global Market, and is Growing At the Highest CAGR of 13.3%
Figure 35 Cell Line Market, By Source
Figure 36 Mammalian Segment is Poised To Double in Size By 2019
Figure 37 With Wide Application Areas, Mammalian Segment Holds 75% of the Market in 2014
Figure 38 Cell Line Market, By Type
Figure 39 Recombinant Cell Lines Segment Accounts for 70% of the Cell Line Market, By Type
Figure 40 Hybridomas is the Fastest-Growing Segment of the Cell Line Market, By Type
Figure 41 Cell Line Applications Market, 2014�2019
Figure 42 Asia is the Fastest-Growing Region in the Global Cell Line Applications Market
Figure 43 Cell Line Development Market, By Application
Figure 44 Recombinant Protein therapeutics is Expected To Account for the Largest Share of 60% and is Growing At the Highest CAGR of 13.5%
Figure 45 North America is Expected To Command of the Largest Share of Global Cell Line Market in 2014
Figure 46 North America Accounted for Largest Share of 40% of the Market in 2014
Figure 47 European Cell Line Market Estimated To Grow At A Gagr of 11% From 2014 To 2019)
Figure 48 Asia is the Fastest Growing Cell Line Market With A CAGR of 14.8% From 2014 To 2019
Figure 49 ROW To Grow At A CAGR of 11.3% From 2014 To 2019
Figure 50 Companies Adopted Agreements, Partnerships, and Collaborations As the Key Growth Strategy Over the Last Three Years
Figure 51 Market Share Analysis, By Key Player, 2013
Figure 52 Key Growth Strategies of the Global Market, 2011�2014
Figure 53 Battle for Market Share: Agreements, Partnerships, and Collaborations Was the Key Strategy
Figure 54 Geographical Revenue Mix of Top 5 Market Players
Figure 55 Company Snapshot
Figure 56 Company Snapshot
Figure 57 Company Snapshot
Figure 58 Company Snapshot
Figure 59 Company Snapshot
Figure 60 Company Snapshot
Figure 61 Company Snapshot
Figure 62 Company Snapshot
Figure 63 Company Snapshot
Figure 64 Company Snapshot

 Generating Response ...


Growth opportunities and latent adjacency in Cell Line Development Market