Cell Surface Markers Market by Product (Antibody, PCR Array), Source (Mice, Rat), Cell Type (T cells, B cells, NK cell), Application (Research (Stem Cell, Immunology), Clinical (Oncology, Hematology)), End User (Hospitals) & Region - Global Forecasts to 2023


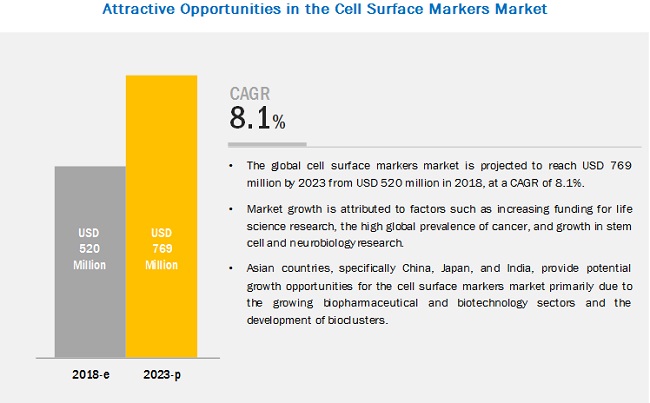
The cell surface markers market is projected to reach USD 769 million by 2023, at a CAGR of 8.1%. Factors such as the increasing funding for life sciences research, high global prevalence of cancer, and growth in stem cell and neurobiology research are expected to drive the growth of this market in the coming years.
The demand for mice as a source of antibodies to increase in the coming years
On the basis of antibodies by source, the global cell surface markers industry is segmented into mice, rats, and other sources. In 2018, the mice segment is expected to account for the largest share of the cell surface markers market. This segment is also expected to grow at the highest CAGR during the forecast period primarily due to the cost-effectiveness offered by mice models as a source of antibody production.
T cell surface markers segment to dominate the cell surface markers market, by cell type, during the forecast period
The cell surface markers market, by cell type, is segmented into T cell surface markers, B cell surface markers, NK cell surface markers, monocyte cell surface markers, and other cell types. In 2018, the T cell surface markers segment is expected to account for the largest share of the cell surface markers market. The increasing use of these cell surface markers in research and diagnostics is expected to fuel the growth of this segment.
Research applications segment to dominate the cell surface markers market, by application, in 2018
Based on application, the cell surface markers market is segmented into research and clinical applications. In 2018, the research applications segment is expected to account for the largest share of the cell surface markers market. The large share of this segment can primarily be attributed to the rising public-private funding for cell surface marker-based research and the growing use of cell surface markers in cancer, stem cell, and HIV research.
Academic & research institutes estimated to be the largest end users of cell surface markers in 2018
On the basis of end user, the cell surface markers market is segmented into academic & research institutes, hospitals & clinical testing laboratories, and pharmaceutical & biotechnology companies. In 2018, the academic & research institutes segment is expected to account for the largest share of the cell surface markers market. The growing use of cell surface markers in cancer, stem cell, and HIV research; increasing number of cancer and stem cell research projects across the globe; and the rising public-private funding for cell surface marker-based research are the major factors driving the growth of this end-user segment.
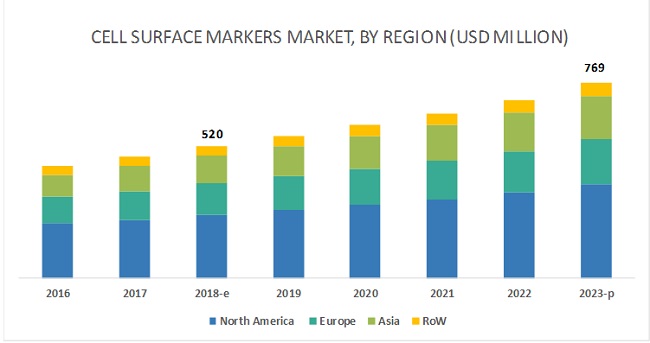
North America is expected to be the largest regional market for cell surface markers
Market growth in North America, the largest regional market for cell surface markers, is primarily driven by the increasing number of R&D activities and the growing use of cell surface markers in personalized medicine and drug discovery & development. However, the market in Asia is estimated to grow at the highest CAGR during the forecast period. The high growth of the Asian market can be attributed to the increasing number of life sciences research activities and government initiatives to boost the biotechnology and pharmaceutical industries in several Asian countries.
Key Market Players
The cell surface markers market is highly fragmented in nature, with several big as well as emerging players. Prominent players in this market include Thermo Fisher Scientific (US), QIAGEN N.V. (Netherlands), Becton, Dickinson and Company (US), F. Hoffman-La Roche (Switzerland), Bio-Rad Laboratories (US), Danaher Corporation (US), Abcam (UK), GenScript (China), BioLegend (US), Cell Signaling Technology (US), Merck KGaA (Germany), and Bio-Techne (US).
Abcam is one of the prominent players operating in the cell surface markers market. The strong position of the company in this market can be attributed to its robust product portfolio. The company has a strong geographical presence in the European and Asia Pacific markets with its manufacturing facilities in the UK, Japan, and China. The company also has significant market presence in the US and Latin America.
Thermo Fisher Scientific is another leading player in the cell surface markers market. The company’s strong brand recognition and extensive product portfolio in this market are its key strengths. To maintain its leading position in the market, the company adopts organic as well as inorganic growth strategies such as acquisitions and expansions.
Recent Developments
- In 2018, Thermo Fisher Scientific acquired the Advanced Bioprocessing business of Becton, Dickinson and Company. This will be integrated into the Life Sciences Solutions segment of Thermo Fisher.
- In 2018, Abcam entered into an exclusive license agreement with Roche. Under this agreement, the product portfolio of Spring Bioscience Corporation has been licensed to Abcam for research use only (RUO) applications.
- In 2018, QIAGEN opened its new shared service center in Manila—QIAGEN Business Services (QBS). QBS will provide services related to supply chain management, customer care, accounting, technical services, and other sales support activities to QIAGEN'S global operations.
Key Questions Addressed by the Report
- Where will all these developments take the industry in the mid-to-long term?
- What types of cell surface markers are companies exploring?
- What are the recent trends affecting cell surface markers?
- Who are the key players in the market and how intense is the competition?
- What are the new application areas of cell surface markers?
To speak to our analyst for a discussion on the above findings, click Speak to Analyst
 Exclusive indicates content/data unique to MarketsandMarkets and not available with any competitors.
Table of Contents
1 Introduction (Page No. - 16)
1.1 Objectives of the Study
1.2 Market Definition
1.3 Market Scope
1.3.1 Market Covered
1.3.2 Years Considered for the Study
1.4 Currency
1.5 Limitations
1.6 Stakeholders
2 Research Methodology (Page No. - 19)
2.1 Research Design
2.1.1 Secondary Data
2.1.1.1 Key Data From Secondary Sources
2.1.2 Primary Data
2.1.2.1 Key Data From Primary Sources
2.2 Market Size Estimation
2.3 Market Breakdown and Data Triangulation
2.4 Assumptions for the Study
3 Executive Summary (Page No. - 26)
4 Premium Insights (Page No. - 30)
4.1 Cell Surface Markers: Market Overview
4.2 Cell Surface Markers Market, By Product
4.3 Cell Surface Markers Market, By Cell Type (2018)
4.4 Cell Surface Markers Market, By Application, 2018 vs 2023 (USD Million)
4.5 Cell Surface Markers Market, By End User, 2018 vs 2023 (USD Million)
4.6 Cell Surface Markers Market: Geographic Growth Opportunities
5 Market Overview (Page No. - 35)
5.1 Introduction
5.2 Market Dynamics
5.2.1 Drivers
5.2.1.1 Increasing Funding for Life Science Research
5.2.1.2 High Global Prevalence of Cancer
5.2.1.3 Growth in Stem Cell and Neurobiology Research
5.2.2 Restraints
5.2.2.1 Costly and Time-Intensive Antibody Development Process
5.2.3 Opportunities
5.2.3.1 High Growth Opportunities in Emerging Markets
6 Cell Surface Markers Market, By Product (Page No. - 39)
6.1 Introduction
6.2 Antibodies
6.2.1 Antibodies to Dominate the Cell Surface Marker Products Market During the Forecast Period
6.3 Pcr Arrays
6.3.1 Pcr Array Profiles the Expression of Genes Relevant to Research at the Cell Surface Marker Level
7 Cell Surface Marker Antibodies Market, By Source (Page No. - 43)
7.1 Introduction
7.2 Mice
7.2.1 Mice are the Most Preferred Hosts for Research-Use Cell Surface Antibody Production
7.3 Rats
7.3.1 Rats are the Second-Most-Widely Used Animal Hosts for Monoclonal Antibody Production
7.4 Other Sources
8 Cell Surface Markers Market, By Cell Type (Page No. - 47)
8.1 Introduction
8.2 T Cell Surface Markers
8.2.1 T Cell Surface Markers to Account for the Largest Market Share in 2018
8.3 B Cell Surface Markers
8.3.1 B Cell Surface Markers are Used to Identify B Cells From Heterogeneous Samples
8.4 NK Cell Surface Markers
8.4.1 NK Cell Surface Markers Identify NK Cells at Various Stages of Development
8.5 Monocyte Cell Surface Markers
8.5.1 Monocytes Play A Critical Role in Maintaining Overall Health
8.6 Other Cell Types
9 Cell Surface Markers Market, By Application (Page No. - 53)
9.1 Introduction
9.2 Research Applications
9.2.1 Drug Discovery
9.2.1.1 Cell Surface Markers Play an Important Role in Guiding Decisions in Every Phase of Drug Development
9.2.2 Immunology
9.2.2.1 The Assessment of Cell Surface Antigens Using Cell Surface Markers is an Important Field of Immunological Research
9.2.3 Stem Cell Research
9.2.3.1 Cell Surface Biomarkers are Used to Characterize, Isolate, and Analyze Stem Cells
9.2.4 Other Research Applications
9.3 Clinical Applications
9.3.1 Oncology
9.3.1.1 Cell Surface Markers are an Emerging Diagnostic Tool in the Field of Hematological Oncology.
9.3.2 Immunodeficiency Diseases
9.3.2.1 Cell Surface Markers are Used for the Detection of Hiv Infections
9.3.3 Other Clinical Applications
10 Cell Surface Markers Market, By End User (Page No. - 62)
10.1 Introduction
10.2 Academic & Research Institutes
10.2.1 Academic & Research Institutes are the Largest End Users of the Cell Surface Markers Market
10.3 Hospitals & Clinical Testing Laboratories
10.3.1 Hospitals & Clinical Testing Laboratories Use Cell Surface Markers for the Diagnosis of Various Diseases
10.4 Pharmaceutical & Biotechnology Companies
10.4.1 Patent Expiration of Blockbuster Drugs to Drive the Growth of the Cell Markers Market for This End-User Segment
11 Cell Surface Markers Market, By Region (Page No. - 67)
11.1 Introduction
11.2 North America
11.2.1 US
11.2.1.1 High Prevalence of Chronic Diseases
11.2.1.2 Favorable Funding for Precision Medicine Research Activities
11.2.2 Canada
11.2.2.1 Availability of Research Funding
11.2.2.2 Increasing Prevalence of Cancer
11.3 Europe
11.3.1 Germany
11.3.1.1 Availability of Funding Driving the Number of Research Activities
11.3.1.2 Large-Scale Outsourcing of Clinical Diagnostic Testing By Hospitals to Commercial Service Providers
11.3.2 France
11.3.2.1 Presence of A Large Biotechnology Industry
11.3.2.2 Government Initiatives to Boost Research and Development Activities
11.3.3 UK
11.3.3.1 Government Initiatives to Strengthen Academic Research
11.3.3.2 Increasing Incidence and Prevalence of Chronic and Infectious Diseases
11.3.4 RoE
11.4 Asia
11.5 RoW
12 Competitive Landscape (Page No. - 103)
12.1 Overview
12.2 Market Ranking Analysis
12.3 Competitive Scenario
12.3.1 Partnerships and Agreements (2016–2018)
12.3.2 Product Launches (2016–2018)
12.3.3 Acquisitions (2016–2018)
12.3.4 Expansions (2016–2018)
13 Company Profiles (Page No. - 108)
(Introduction, Products & Services, Strategy, & Analyst Insights, Developments, MnM View)*
13.1 Thermo Fisher Scientific
13.2 Becton, Dickinson and Company
13.3 Abcam
13.4 Qiagen N.V.
13.5 F. Hoffman-La Roche
13.6 Bio-Rad Laboratories
13.7 Danaher Corporation
13.8 Genscript
13.9 Biolegend
13.10 Cell Signaling Technology
13.11 Bio-Techne
13.12 Merk KGaA
*Details on Marketsandmarkets View, Introduction, Product & Services, Strategy, & Analyst Insights, New Developments Might Not Be Captured in Case of Unlisted Companies.
14 Appendix (Page No. - 134)
14.1 Discussion Guide
14.2 Knowledge Store: Marketsandmarkets’ Subscription Portal
14.3 Available Customizations
14.4 Related Reports
14.5 Author Details
List of Tables (91 Tables)
Table 1 Global Cancer Incidence, 2018 vs 2025
Table 2 Cell Surface Markers Market, By Product, 2016–2023 (USD Million)
Table 3 Cell Surface Marker Antibodies Market, By Region, 2016–2023 (USD Million)
Table 4 Cell Surface Marker Pcr Arrays Market, By Region, 2016–2023 (USD Million)
Table 5 Cell Surface Marker Antibodies Market, By Source, 2016–2023 (USD Million)
Table 6 Cell Surface Marker Antibodies Market for Mice, By Region, 2016–2023 (USD Million)
Table 7 Cell Surface Marker Antibodies Market for Rats, By Region, 2016–2023 (USD Million)
Table 8 Cell Surface Marker Antibodies Market for Other Sources, By Region, 2016–2023 (USD Million)
Table 9 Markers Market, By Cell Type, 2016–2023 (USD Million)
Table 10 T Cell Surface Markers Market, By Region, 2016–2023 (USD Million)
Table 11 B Cell Surface Markers Market, By Region, 2016–2023 (USD Million)
Table 12 NK Cell Surface Markers Market, By Region, 2016–2023 (USD Million)
Table 13 Monocyte Cell Surface Markers Market, By Region, 2016–2023 (USD Million)
Table 14 Markers Market for Other Cell Types, By Region, 2016–2023 (USD Million)
Table 15 Markers Market, By Application, 2016–2023 (USD Million)
Table 16 Markers Market for Research Applications, By Type, 2016–2023 (USD Million)
Table 17 Markers Market for Research Applications, By Region, 2016–2023 (USD Million)
Table 18 Markers Market for Drug Discovery, By Region, 2016–2023 (USD Million)
Table 19 Markers Market for Immunology, By Region, 2016–2023 (USD Million)
Table 20 Markers Market for Stem Cell Research, By Region, 2016–2023 (USD Million)
Table 21 Markers Market for Other Research Applications, By Region, 2016–2023 (USD Million)
Table 22 Markers Market for Clinical Applications, By Type, 2016–2023 (USD Million)
Table 23 Markers Market for Clinical Applications, By Region, 2016–2023 (USD Million)
Table 24 Markers Market for Oncology, By Region, 2016–2023 (USD Million)
Table 25 Markers Market for Immunodeficiency Diseases, By Region, 2016–2023 (USD Million)
Table 26 Markers Market for Other Clinical Applications, By Region, 2016–2023 (USD Million)
Table 27 Markers Market, By End User, 2016–2023 (USD Million)
Table 28 Markers Market for Academic & Research Institutes, By Region, 2016–2023 (USD Million)
Table 29 Markers Market for Hospitals & Clinical Testing Laboratories, By Region, 2016–2023 (USD Million)
Table 30 Markers Market for Pharmaceutical & Biotechnology Companies, By Region, 2016–2023 (USD Million)
Table 31 Cell Surface Markers Market, By Region, 2016–2023 (USD Million)
Table 32 North America: Cell Surface Markers Market, By Country, 2016–2023 (USD Million)
Table 33 North America: Market, By Product, 2016–2023 (USD Million)
Table 34 North America: Cell Surface Marker Antibodies Market, By Source, 2016–2023 (USD Million)
Table 35 North America: Cell Surface Markers Market, By Cell Type, 2016–2023 (USD Million)
Table 36 North America: Market, By Application, 2016–2023 (USD Million)
Table 37 North America: Cell Surface Markers Market for Research Applications, By Type, 2016–2023 (USD Million)
Table 38 North America: Cell Surface Markers Market for Clinical Applications, By Type, 2016–2023 (USD Million)
Table 39 North America: Market, By End User, 2016–2023 (USD Million)
Table 40 US: Cell Surface Markers Market, By Product, 2016–2023 (USD Million)
Table 41 US: Cell Surface Marker Antibodies Market, By Source, 2016–2023 (USD Million)
Table 42 US: Cell Surface Markers Market, By Cell Type, 2016–2023 (USD Million)
Table 43 US: Market, By Application, 2016–2023 (USD Million)
Table 44 US: Cell Surface Markers Market, By End User, 2016–2023 (USD Million)
Table 45 Canada: Market, By Product, 2016–2023 (USD Million)
Table 46 Canada: Cell Surface Marker Antibodies Market, By Source, 2016–2023 (USD Million)
Table 47 Canada: Cell Surface Markers Market, By Cell Type, 2016–2023 (USD Million)
Table 48 Canada: Market, By Application, 2016–2023 (USD Million)
Table 49 Canada: Cell Surface Markers Market, By End User, 2016–2023 (USD Million)
Table 50 Europe: Market, By Country, 2016–2023 (USD Million)
Table 51 Europe: Cell Surface Markers Market, By Product, 2016–2023 (USD Million)
Table 52 Europe: Cell Surface Marker Antibodies Market, By Source, 2016–2023 (USD Million)
Table 53 Europe: Cell Surface Markers Market, By Cell Type, 2016–2023 (USD Million)
Table 54 Europe: Market, By Application, 2016–2023 (USD Million)
Table 55 Europe: Cell Surface Markers Market for Research Applications, By Type, 2016–2023 (USD Million)
Table 56 Europe: Market for Clinical Applications, By Type, 2016–2023 (USD Million)
Table 57 Europe: Cell Surface Markers Market, By End User, 2016–2023 (USD Million)
Table 58 Germany: Market, By Product, 2016–2023 (USD Million)
Table 59 Germany: Cell Surface Marker Antibodies Market, By Source, 2016–2023 (USD Million)
Table 60 Germany: Cell Surface Markers Market, By Cell Type, 2016–2023 (USD Million)
Table 61 Germany: Market, By Application, 2016–2023 (USD Million)
Table 62 Germany: Cell Surface Markers Market, By End User, 2016–2023 (USD Million)
Table 63 France: Market, By Product, 2016–2023 (USD Million)
Table 64 France: Cell Surface Marker Antibodies Market, By Source, 2016–2023 (USD Million)
Table 65 France: Cell Surface Markers Market, By Cell Type, 2016–2023 (USD Million)
Table 66 France: Market, By Application, 2016–2023 (USD Million)
Table 67 France: Cell Surface Markers Market, By End User, 2016–2023 (USD Million)
Table 68 UK: Market, By Product, 2016–2023 (USD Million)
Table 69 UK: Cell Surface Marker Antibodies Market, By Source, 2016–2023 (USD Million)
Table 70 UK: Cell Surface Markers Market, By Cell Type, 2016–2023 (USD Million)
Table 71 UK: Market, By Application, 2016–2023 (USD Million)
Table 72 UK: Cell Surface Markers Market, By End User, 2016–2023 (USD Million)
Table 73 RoE: Market, By Product, 2016–2023 (USD Million)
Table 74 RoE: Cell Surface Marker Antibodies Market, By Source, 2016–2023 (USD Million)
Table 75 RoE: Cell Surface Markers Market, By Cell Type, 2016–2023 (USD Million)
Table 76 RoE: Market, By Application, 2016–2023 (USD Million)
Table 77 RoE: Cell Surface Markers Market, By End User, 2016–2023 (USD Million)
Table 78 Asia: Cell Surface Markers Market, By Product, 2016–2023 (USD Million)
Table 79 Asia: Cell Surface Marker Antibodies Market, By Source, 2016–2023 (USD Million)
Table 80 Asia: Market, By Cell Type, 2016–2023 (USD Million)
Table 81 Asia: Cell Surface Markers Market, By Application, 2016–2023 (USD Million)
Table 82 Asia: Cell Surface Markers Market for Research Applications, By Type, 2016–2023 (USD Million)
Table 83 Asia: Market for Clinical Applications, By Type, 2016–2023 (USD Million)
Table 84 Asia: Cell Surface Markers Market, By End User, 2016–2023 (USD Million)
Table 85 RoW: Market, By Product, 2016–2023 (USD Million)
Table 86 RoW: Cell Surface Marker Antibodies Market, By Source, 2016–2023 (USD Million)
Table 87 RoW: Cell Surface Markers Market, By Cell Type, 2016–2023 (USD Million)
Table 88 RoW: Market, By Application, 2016–2023 (USD Million)
Table 89 RoW: Cell Surface Markers Market for Research Applications, By Type, 2016–2023 (USD Million)
Table 90 RoW: Market for Clinical Applications, By Type, 2016–2023 (USD Million)
Table 91 RoW: Cell Surface Markers Market, By End User, 2016–2023 (USD Million)
List of Figures (40 Figures)
Figure 1 Cell Surface Marker Market Segmentation
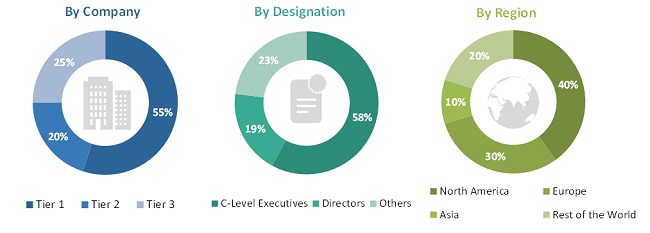
Figure 2 Breakdown of Primary Interviews: By Company Type, Designation, and Region
Figure 3 Market Size Estimation: Bottom-Up Approach
Figure 4 Market Size Estimation: Top-Down Approach
Figure 5 Data Triangulation Methodology
Figure 6 Cell Surface Markers Market, By Product, 2018 vs 2023 (USD Million)
Figure 7 Cell Surface Marker Antibodies Market, By Source
Figure 8 Cell Surface Markers Market, By Cell Type, 2018 vs 2023 (USD Million)
Figure 9 Cell Surface Markers Market, By Application, 2018 vs 2023 (USD Million)
Figure 10 Cell Surface Markers Market, By End User, 2018 vs 2023 (USD Million)
Figure 11 Geographical Snapshot of the Cell Surface Markers Market
Figure 12 High Global Burden of Cancer & Increasing Funding for Life Science Research are Driving the Growth of the Cell Surface Markers Market
Figure 13 Antibodies Segment to Register the Highest Growth During the Forecast Period
Figure 14 T Cell Surface Markers Segment to Account for the Largest Market Share in 2018
Figure 15 Clinical Applications Segment to Witness the Highest Growth During the Forecast Period
Figure 16 Academic & Research Institutes Segment to Dominate the Cell Surface Markers Market During the Forecast Period
Figure 17 Asia is the Fastest-Growing Region in the Cell Surface Markers Market
Figure 18 Cell Surface Markers Market: Drivers, Restraints, and Opportunities
Figure 19 Antibodies Segment Will Continue to Dominate the Cell Surface Marker Products Market During the Forecast Period
Figure 20 Mice Segment to Witness the Highest Growth in the Cell Surface Marker Antibodies Market During the Forecast Period
Figure 21 T Cell Surface Markers Segment to Dominate the Market During the Forecast Period
Figure 22 Research Applications Segment to Account for the Largest Share of the Cell Surface Markers Market in 2018
Figure 23 Hospitals & Clinical Testing Laboratories Segment to Witness the Highest Growth During the Forecast Period
Figure 24 North America: Cell Surface Markers Market Snapshot
Figure 25 Europe: Cell Surface Markers Market Snapshot
Figure 26 Asia: Cell Surface Markers Market Snapshot
Figure 27 RoW: Cell Surface Markers Market Snapshot
Figure 28 Key Developments in the Cell Surface Markers Market (Jan 2016-Nov 2018)
Figure 29 Market Evolution Framework
Figure 30 Cell Surface Markers Market Ranking Analysis, By Key Player (2017)
Figure 31 Company Snapshot: Thermo Fisher Scientific (2017)
Figure 32 Becton, Dickinson and Company: Company Snapshot (2017)
Figure 33 Company Snapshot: Abcam (2018*)
Figure 34 Company Snapshot: Qiagen N.V. (2017)
Figure 35 Company Snapshot: F. Hoffmann-La Roche AG (2017)
Figure 36 Company Snapshot: Bio-Rad Laboratories, Inc. (2017)
Figure 37 Company Snapshot: Danaher Corporation (2017)
Figure 38 Company Snapshot: Genscript (2017)
Figure 39 Company Snapshot: Bio-Techne (2017)
Figure 40 Company Snapshot: Merck KGaA (2017)
This study involved four major activities to estimate the current size of the cell surface markers market. Exhaustive secondary research was carried out to collect information on the market, its peer markets, and its parent market. The next step was to validate these findings, assumptions, and sizing with industry experts across the value chain through primary research. Both top-down and bottom-up approaches were employed to estimate the complete market size. Thereafter, market breakdown and data triangulation were used to estimate the market size of segments and subsegments.
Secondary Research
Secondary research was mainly used to identify and collect information for the extensive, technical, market-oriented, and commercial study of the cell surface markers market. Secondary sources such as The Antibody Society, Pharmaceutical Research and Manufacturers of America (PhRMA), National Institutes of Health (NIH), American Medical Association (AMA), Association of Medical Laboratory Immunologists (AMLI), National Cancer Institute (NCI), American Society of Clinical Oncology (ASCO), American Association for Cancer Research (AACR), European Medicines Agency (EMA), and the British Society for Immunology (BSI) were used. These sources were also used to obtain key information about major players, market classification, and segmentation according to industry trends, regional/country-level markets, market developments, and technology perspectives.
Primary Research
In-depth interviews were conducted with various primary respondents, including key industry participants, subject-matter experts (SMEs), C-level executives of key market players, and industry consultants, among other experts, to obtain and verify the critical qualitative and quantitative information as well as assess future prospects of the market. Various primary sources from both the supply and demand sides of the market were interviewed to obtain qualitative and quantitative information. Following is the breakdown of primary respondents:
To know about the assumptions considered for the study, download the pdf brochure
Market Size Estimation
Both top-down and bottom-up approaches were used to estimate and validate the total size of the cell surface markers market. These methods were also used extensively to estimate the size of various subsegments in the market. The research methodology used to estimate the market size includes the following:
- The key players in the industry and markets have been identified through extensive secondary research.
- The cell surface markers market generated by leading players has been determined through primary and secondary research.
- All percentage shares, splits, and breakdowns have been determined using secondary sources and verified through primary sources.
Data Triangulation
After arriving at the overall market size from the market size estimation process, the total market was split into several segments and subsegments. To complete the overall market engineering process and arrive at the exact statistics for all segments and subsegments, data triangulation and market breakdown procedures were employed, wherever applicable. The data was triangulated by studying various factors and trends from both the demand and supply sides.
Report Objectives
- To define, describe, and forecast the global cell surface markers market on the basis of product type, antibodies by source, cell type, application, end user, and region
- To provide detailed information about the factors influencing market growth (drivers, restraints, and opportunities)
- To strategically analyze micromarkets with respect to individual growth trends, prospects, and contributions to the total market
- To analyze market opportunities for stakeholders and provide details of the competitive landscape for key players
- To forecast the size of market segments in North America, Europe, Asia, and the Rest of the World
- To profile key players and comprehensively analyze their product portfolios, market shares, and core competencies
- To track and analyze competitive developments, such as acquisitions, product launches, expansions, regulatory approvals, and agreements in the global cell surface markers market
Scope of the report
|
Report Metric |
Details |
|
Market size available for years |
2016–2023 |
|
Base year considered |
2017 |
|
Forecast period |
2018–2023 |
|
Forecast units |
Value (USD) |
|
Segments covered |
Product type, antibodies by source, cell type, application, end user, and region |
|
Geographies covered |
North America, Asia, Europe, and the Rest of the World |
|
Companies covered |
Thermo Fisher Scientific (US), QIAGEN N.V. (Netherlands), Becton, Dickinson and Company (US), F. Hoffman-La Roche (Switzerland), Bio-Rad Laboratories (US), Danaher Corporation (US), Abcam (UK), GenScript (China), BioLegend (US), Cell Signaling Technology (US), Merck KGaA (Germany), and Bio-Techne (US) |
This report categorizes the cell surface markers market into the following segments and subsegments:
On the basis of Product Type, the cell surface markers market has been segmented as follows:
- Antibodies
- PCR Arrays
On the basis of Antibodies by Source, the cell surface markers market has been segmented as follows:
- Mice
- Rats
- Other Sources (Chicken, Goats, Rabbits, Pigs, Hamsters, and Sheep)
On the basis of Cell Type, the cell surface markers market has been segmented as follows:
- T Cell Surface Markers
- B Cell Surface Markers
- Natural Killer Cell Surface Markers
- Monocyte Cell Surface Markers
- Other Cell Surface Markers (Dendritic, Granulocyte, Platelet, Erythrocyte, Endothelial, Fibroblast, Adipocyte, and Epithelial Cell Surface Markers)
On the basis of application, the cell surface markers market has been segmented as follows:
-
Research Applications
- Drug Discovery
- Stem Cell Research
- Immunology
- Other Applications (Neurobiology, Cell Sorting, Apoptosis, Cell Cycle Analysis, Cell Viability, and Cell Counting)
-
Clinical Applications
- Oncology
- Immunodeficiency Diseases
- Other Clinical Applications (Hematological Disorders, Organ Transplantation, and Infectious Diseases)
On the basis of End User, the cell surface markers market has been segmented as follows:
- Academic & Research Institutes
- Hospitals & Clinical Testing Laboratories
- Pharmaceutical & Biotechnology Companies
On the basis of Region, the cell surface markers market has been segmented as follows:
- North America
- Europe
- Asia
- RoW
Available Customizations
With the given market data, MarketsandMarkets offers customizations as per the company‘s specific needs.
he following customization options are available for this report:
Company Information
- Detailed analysis and profiling of additional market players (up to 5)

 Generating Response ...


Growth opportunities and latent adjacency in Cell Surface Markers Market