Chemical Tankers Market by Product Type (Organic Chemicals, Inorganic Chemicals, Vegetable Oils & Fats), Fleet Type (IMO 1, IMO 2, IMO 3), Fleet Material (Stainless Steel, Coated), Fleet Size, and Region - Global Forecast to 2022


To get the latest information, inquire now!
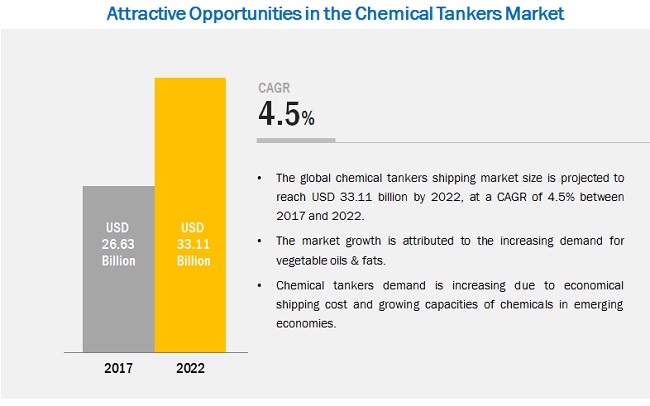
The chemical tankers market is projected to reach USD 33.11 Billion by 2022, at a CAGR of 4.5%. Chemical tanker market includes revenues earned through shipping of chemicals and related products. The base year that has been considered for this study on the chemical tankers market is 2016 while the forecast period considered has been from 2017 to 2022.
To get more details on this report, 
The Objectives of the Report are as follows:
- To define, describe, and forecast the chemical tankers market based on product type, fleet type, fleet material, fleet size, and region
- To forecast the market size, in terms of volume and value, with respect to five main regions, namely, North America, Europe, Asia Pacific, South America, and the Middle East & Africa
- To provide detailed information about the major factors such as drivers, restraints, opportunities, and industry-specific challenges influencing the growth of the chemical tanker market across the globe
- To analyze opportunities in the chemical tankers market for stakeholders and provide detailed information on the competitive landscape of the market
- To strategically profile the key players operating in the chemical tanker market and comprehensively analyze their market shares and core competencies
- To track and analyze the competitive developments such as expansions, joint ventures, acquisitions, and agreements in the chemical tankers market
Chemical Tankers Market Research Methodology
Top-down approach has been used to estimate and validate the size of the chemical tankers market. It has also been used to estimate the sizes of various other dependent submarkets of the overall chemical tankers market. The research study that has been used in this study involved extensive use of secondary sources, directories, and databases such as Hoovers, Bloomberg, Chemical Weekly, Factiva, and other government and private websites to identify and collect information useful for this technical, market-oriented, and commercial study of the chemical tankers market.

The supply chain of the chemical tankers market starts with the companies manufacturing chemical tankers. It is followed by owners of chemical tankers, who import and export chemicals from the chemical manufacturing companies and other users. The major players in the chemical tanker market are Bahri (Saudi Arabia), Stolt-Nielsen (UK), Odfjell (Norway), Navig8 (UK), MOL Chemical Tankers (Singapore), Nordic Tankers (Denmark), Wilmar International (Singapore), MISC Berhad (Malaysia), Team Tankers (Bermuda), and Iino Kaiun Kaisha (Japan).
Key Target Chemical Tankers Market Audience
- Chemical Tanker Companies
- Chemical Manufacturing Companies
- Traders and Distributors
- Trade Associations and Government Agencies
Chemical Tankers Market Report Scope
This research report categorizes the chemical tankers market based on product type, fleet type, fleet material, fleet size, and region.
Chemical tankers Market, by Product Type:
- Organic Chemicals
- Inorganic Chemicals
- Vegetable Oils & Fats
- Others (Additives, Lube Oils, and Molasses)
Chemical Tanker Market, by Fleet Type:
- IMO 1
- IMO 2
- IMO 3
Chemical Tankers Market, by Fleet Size:
- Inland Chemical Tankers (1,000-4,999 DWT)
- Coastal Chemical Tankers (5,000-9,999 DWT)
- Deep-Sea Chemical Tankers (10,000-50,000 DWT)
Chemical Tankers Market, by Fleet Material:
- Stainless Steel
- Coated
Chemical Tanker Market, by Region:
- North America
- Europe
- Asia Pacific
- South America
- Middle East & Africa
The market has been further analyzed for the key countries in each of these regions.
The chemical tankers market is projected to grow from USD 26.63 Billion in 2017 to USD 33.11 Billion by 2022, at a CAGR of 4.5% between 2017 and 2022. Note: Chemical tanker market includes revenues earned through shipping of chemicals and related products. The flourishing chemical industry and increasing capacities of chemical manufacturers are driving the demand for chemical tankers across the globe. Moreover, the increasing demand for vegetable oils & fats is also expected to fuel the growth of the chemical tankers market during the forecast period.
Based on product type, the chemical tankers market has been classified into organic chemicals, inorganic chemicals, and vegetable oils & fats. The vegetable oils & fats segment of the chemical tanker market is projected to grow at the highest CAGR, in terms of both, value and volume during the forecast period. The growth of this segment of the market can be attributed to the increasing awareness among masses about the health benefits resulting from the consumption of vegetable oils & fats.
Based on fleet type, the chemical tankers market has been classified into IMO 1, IMO 2, and IMO 3. The IMO 2 fleet type segment of the chemical tanker market is projected to grow at the highest CAGR, in terms of value and volume during the forecast period. The growth of the IMO 2 fleet type segment of the chemical tankers market can be attributed to the use of IMO 2 chemical tankers for shipping vegetable oils & fats along with different types of chemicals such as alcohols, alkanes, and alkenyl amide.
Based on fleet size, the chemical tankers market has been categorized into inland chemical tankers (1,000-4,999 DWT), coastal chemical tankers (5,000-9,999 DWT), and deep-sea chemical tankers (10,000-50,000 DWT). Deep sea chemical tankers are widely used chemical tankers for transporting chemicals as they have a large number of segregations.
Based on fleet material, the chemical tankers market has been segmented into stainless steel and coated. Chemical tankers have epoxy, phenolic, or zinc coatings. Epoxy coatings possess good resistance to alkalis, seawater, wines, vegetable oils, crude oils, gas oils, lube oils, jet fuels, gasoline, and weak acids. Most zinc coatings are porous and tend to trap or hold previous cargos, making it difficult to clean them to a good extent.
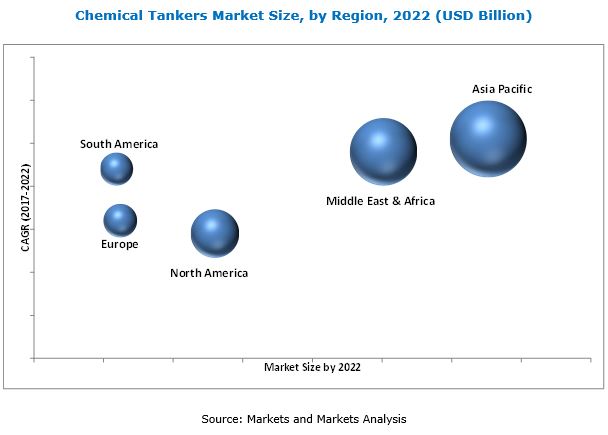
The Asia Pacific region is estimated to be the largest market for chemical tankers during the forecast period. The Asia Pacific chemical tankers market is also projected to grow at the highest CAGR, in terms of value and volume during the forecast period. China is projected to lead the Asia Pacific chemical tanker market during the forecast period. The China chemical tankers market is also projected to grow at the highest CAGR, in terms of value and volume during the forecast period.
Slow growth in the production of crude oil and formulation and implementation of regulations related to oil bunkering act as restraints to the growth of the chemical tankers market. Low international prices of crude oil and reduced capital investments for its exploration over the past few years have led to the slow production of crude oil. Moreover, low investments for exploring and producing crude oil between 2013 and 2015 in the US have impacted the production of shale oil in the country. The oil production has decreased in China as well, owing to the low oil price environment in the country.
The major players operating in the chemical tanker market are Bahri (Saudi Arabia), Stolt-Nielsen (UK), Odfjell (Norway), Navig8 (UK), MOL Chemical Tankers (Singapore), Nordic Tankers (Denmark), Wilmar International (Singapore), MISC Berhad (Malaysia), Team Tankers (Bermuda), and Iino Kaiun Kaisha (Japan).
These leading players have adopted the strategy of agreements to increase their shares in the chemical tankers market and cater to the increasing demand for tankers used for shipping chemicals and chemical products. For instance, Odfjell (Norway) signed an agreement with Sinochem Shipping (Singapore) in November 2017. According to this agreement, Odfjell (Norway) is expected to take four new orders from Sinochem Shipping (Singapore) to manufacture 840,900 DWT chemical tankers. This agreement aims at enabling Odfjell (Norway) to serve the growing demand for chemical tankers, which are used to ship chemicals and chemical products. The leading players operating in the market have also adopted the strategies of expansions, joint ventures, agreements, and acquisitions to increase their shares in the chemical tanker market between 2014 and 2017.
Frequently Asked Questions (FAQ):
How big is the chemical tanker market industry?
The chemical tankers market is projected to grow from USD 26.63 Billion in 2017 to USD 33.11 Billion by 2022, at a CAGR of 4.5% between 2017 and 2022.
Who leading market players in chemical tanker industry?
The major players operating in the chemical tankers market are Bahri (Saudi Arabia), Stolt-Nielsen (UK), Odfjell (Norway), Navig8 (UK), MOL Chemical Tankers (Singapore), Nordic Tankers (Denmark), Wilmar International (Singapore), MISC Berhad (Malaysia), Team Tankers (Bermuda), and Iino Kaiun Kaisha (Japan).
To speak to our analyst for a discussion on the above findings, click Speak to Analyst
 Exclusive indicates content/data unique to MarketsandMarkets and not available with any competitors.
Table of Contents
1 Introduction (Page No. - 18)
1.1 Objectives of the Study
1.2 Market Scope
1.2.1 Market Definition
1.2.2 Years Considered for the Study
1.3 Currency
1.4 Unit Considered
1.5 Stakeholders
2 Research Methodology (Page No. - 21)
2.1 Research Data
2.2 Secondary Data
2.2.1 Key Data From Secondary Sources
2.3 Primary Data
2.3.1 Key Data From Primary Sources
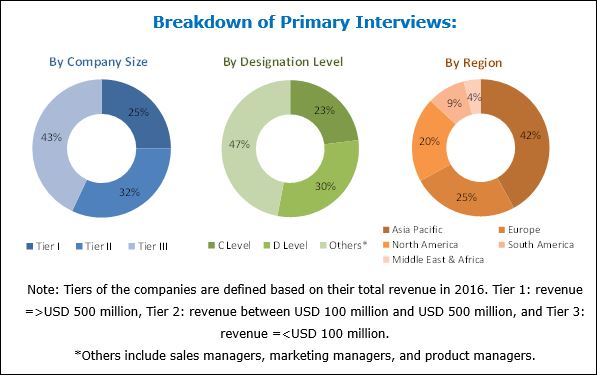
2.3.2 Breakdown of Primary Interviews
2.4 Market Size Estimation
2.5 Data Triangulation
2.6 Assumptions
2.7 Limitations
3 Executive Summary (Page No. - 28)
4 Premium Insights (Page No. - 32)
4.1 Attractive Opportunities for the Chemical Tanker Shipping Market
4.2 APAC: Chemical Tankers Shipping Market, By Product Type and Country
4.3 Chemical Tankers Market, By Fleet Type
4.4 Chemical Tanker Market, By Fleet Size
4.5 Chemical Tankers Market, By Fleet Material
5 Market Overview (Page No. - 35)
5.1 Introduction
5.2 Market Dynamics
5.2.1 Drivers
5.2.1.1 Growth of the Chemical Industry
5.2.1.2 Increasing Demand for Oilseeds/Vegetable Oils & Fats
5.2.2 Restraints
5.2.2.1 Slow Growth in Crude Oil Production
5.2.2.2 Oil Bunkering Regulations
5.2.3 Opportunities
5.2.3.1 Increasing Production of Chemicals in APAC
5.2.3.2 Oversupply in the Chemical Tankers Industry
5.2.4 Challenges
5.2.4.1 Political Unrest in the Middle East & North Africa
5.3 Porter’s Five Forces Analysis
5.3.1 Threat of Substitutes
5.3.2 Bargaining Power of Suppliers
5.3.3 Bargaining Power of Buyers
5.3.4 Threat of New Entrants
5.3.5 Intensity of Rivalry
5.4 Macroeconomic Indicators
5.4.1 GDP Growth Rate Forecast of Major Economies
5.4.2 Chemicals and Vegetable Oils Statistics
6 Chemical Tankers Shipping Market, By Product Type (Page No. - 43)
6.1 Introduction
6.2 Organic Chemicals
6.3 Inorganic Chemicals
6.4 Vegetable Oils & Fats
6.5 Others
7 Chemical Tanker Shipping Market, By Fleet Type (Page No. - 51)
7.1 Introduction
7.2 IMO Type 1
7.3 IMO Type 2
7.4 IMO Type 3
8 Chemical Tankers Market, By Fleet Size (Page No. - 57)
8.1 Introduction
8.2 Inland
8.3 Coastal
8.4 Deep Sea
9 Chemical Tanker Market, By Fleet Material (Page No. - 67)
9.1 Introduction
9.2 Stainless Steel
9.3 Coated
10 Chemical Tankers Shipping Market, By Region (Page No. - 72)
10.1 Introduction
10.2 North America
10.2.1 US
10.2.2 Canada
10.2.3 Mexico
10.3 Europe
10.3.1 Germany
10.3.2 France
10.3.3 UK
10.3.4 Netherlands
10.3.5 Russia
10.3.6 Rest of Europe
10.4 APAC
10.4.1 China
10.4.2 Japan
10.4.3 South Korea
10.4.4 Singapore
10.4.5 India
10.4.6 Rest of APAC
10.5 Middle East & Africa
10.5.1 Saudi Arabia
10.5.2 UAE
10.5.3 Rest of the Middle East & Africa
10.6 South America
10.6.1 Brazil
10.6.2 Argentina
10.6.3 Rest of South America
11 Competitive Landscape (Page No. - 127)
11.1 Overview
11.2 Competitive Scenario
11.2.1 Expansions
11.2.2 Joint Ventures
11.2.3 Acquisitions
11.2.4 Agreements
12 Company Profiles (Page No. - 130)
12.1 Bahri
12.1.1 Business Overview
12.1.2 Products Offered
12.1.3 Recent Developments
12.1.4 SWOT Analysis
12.1.5 MnM View
12.2 Stolt-Nielsen
12.2.1 Business Overview
12.2.2 Products Offered
12.2.3 Recent Developments
12.2.4 SWOT Analysis
12.2.5 MnM View
12.3 Odfjell
12.3.1 Business Overview
12.3.2 Products Offered
12.3.3 Recent Developments
12.3.4 SWOT Analysis
12.3.5 MnM View
12.4 Navig8
12.4.1 Business Overview
12.4.2 Products Offered
12.4.3 Recent Developments
12.4.4 SWOT Analysis
12.4.5 MnM View
12.5 Mol Chemical Tankers Pte. Ltd.
12.5.1 Business Overview
12.5.2 Products Offered
12.5.3 SWOT Analysis
12.5.4 MnM View
12.6 Nordic Tankers A/S
12.6.1 Business Overview
12.6.2 Products Offered
12.6.3 Recent Developments
12.6.4 MnM View
12.7 Wilmar International Ltd.
12.7.1 Business Overview
12.7.2 Products Offered
12.7.3 Recent Developments
12.7.4 MnM View
12.8 Misc Berhad
12.8.1 Business Overview
12.8.2 Products Offered
12.8.3 Recent Developments
12.8.4 MnM View
12.9 Team Tankers International Ltd.
12.9.1 Business Overview
12.9.2 Products Offered
12.9.3 MnM View
12.10 Iino Kaiun Kaisha, Ltd.
12.10.1 Business Overview
12.10.2 Products Offered
12.10.3 MnM View
12.11 Other Company Profiles
12.11.1 Stena Bulk
12.11.2 Laurine Maritime
12.11.3 Waterfront Shipping
12.11.4 Chembulk
12.11.5 Aurora Tankers Management Pte. Ltd.
12.11.6 Maersk Tankers
12.11.7 Champion Tankers
12.11.8 Southern Chemical Corporation
13 Appendix (Page No. - 149)
13.1 Insights From Industry Experts
13.2 Discussion Guide
13.3 Knowledge Store: Marketsandmarkets’ Subscription Portal
13.4 Introducing RT: Real-Time Market Intelligence
13.5 Available Customizations
13.6 Related Reports
13.7 Author Details
List of Tables (181 Tables)
Table 1 Forecast of GDP Growth Rates, By Key Country, 2016–2022
Table 2 Market Share of Chemical Exports, By Key Country, 2016
Table 3 Chemical Tanker Shipping Market Size, By Product Type, 2015–2022 (Million Ton)
Table 4 Chemical Tankers Shipping Market Size, By Product Type, 2015–2022 (USD Billion)
Table 5 Chemical Tanker Market Size for Organic Chemicals, By Region, 2015–2022 (Million Ton)
Table 6 Chemical Tankers Shipping Market Size for Organic Chemicals, By Region, 2015–2022 (USD Billion)
Table 7 Chemical Tanker Shipping Market Size for Inorganic Chemicals, By Region, 2015–2022 (Million Ton)
Table 8 Chemical Tankers Shipping Market Size for Inorganic Chemicals, By Region, 2015–2022 (USD Billion)
Table 9 Chemical Tanker Market Size for Vegetable Oils & Fats, By Region, 2015–2022 (Million Ton)
Table 10 Chemical Tankers Shipping Market Size for Vegetable Oils & Fats, By Region, 2015–2022 (USD Billion)
Table 11 Chemical Tanker Shipping Market Size for Other Products, By Region, 2015–2022 (Million Ton)
Table 12 Chemical Tankers Shipping Market Size for Other Products, By Region, 2015–2022 (USD Billion)
Table 13 Chemical Tanker Market Size, By Fleet Type, 2015–2022 (Million Ton)
Table 14 Chemical Tankers Shipping Market Size, By Fleet Type, 2015–2022 (USD Billion)
Table 15 IMO Type 1: Chemical Tanker Shipping Market Size, By Region, 2015–2022 (Million Ton)
Table 16 IMO Type 1: Chemical Tankers Shipping Market Size, By Region, 2015–2022 (USD Billion)
Table 17 IMO Type 2: Chemical Tanker Market Size, By Region, 2015–2022 (Million Ton)
Table 18 IMO Type 2: Chemical Tankers Shipping Market Size, By Region, 2015–2022 (USD Billion)
Table 19 IMO Type 3: Chemical Tanker Shipping Market Size, By Region, 2015–2022 (Million Ton)
Table 20 IMO Type 3: Chemical Tankers Shipping Market Size, By Region, 2015–2022 (USD Billion)
Table 21 Chemical Tanker Market Size, By Fleet Size, 2015–2022 (Million Ton)
Table 22 Chemical Tankers Shipping Market Size, By Fleet Size, 2015–2022 (USD Billion)
Table 23 Inland Chemical Tanker Shipping Market Size, By Region, 2015–2022 (Million Ton)
Table 24 Inland Chemical Tankers Shipping Market Size, By Region, 2015–2022 (USD Billion)
Table 25 Chemical Tanker Market Size, By Region, 2015–2022 (Million Ton)
Table 26 Chemical Tankers Shipping Market Size, By Region, 2015–2022 (USD Billion)
Table 27 Deep Sea 10,000-19,999 DWT Chemical Tanker Shipping Market Size, By Region, 2015–2022 (Million Ton)
Table 28 Deep Sea 10,000-19,999 DWT Chemical Tankers Shipping Market Size, By Fleet Size, 2015–2022 (USD Billion)
Table 29 Deep Sea 20,000-29,999 DWT Chemical Tanker Market Size, By Fleet Size, 2015–2022 (Million Ton)
Table 30 Deep Sea 20,000-29,999 DWT Chemical Tankers Shipping Market Size, By Fleet Size, 2015–2022 (USD Billion)
Table 31 Deep Sea 30,000-39,999 DWT Chemical Tanker Shipping Market Size, By Fleet Size, 2015–2022 (Million Ton)
Table 32 Deep Sea 30,000-39,999 DWT Chemical Tankers Shipping Market Size, By Fleet Size, 2015–2022 (USD Billion)
Table 33 Deep Sea 40,000-49,999 DWT Chemical Tanker Market Size, By Fleet Size, 2015–2022 (Million Ton)
Table 34 Deep Sea 40,000-49,999 DWT Chemical Tankers Shipping Market Size, By Fleet Size, 2015–2022 (USD Billion)
Table 35 Deep Sea 50,000+ DWT Chemical Tanker Shipping Market Size, By Fleet Size, 2015–2022 (Million Ton)
Table 36 Deep Sea 50,000+ DWT Chemical Tankers Shipping Market Size, By Fleet Size, 2015–2022 (USD Billion)
Table 37 Chemical Tanker Market Size, By Fleet Material, 2015–2022 (Million Ton)
Table 38 Chemical Tankers Shipping Market Size, By Fleet Material, 2015–2022 (USD Billion)
Table 39 Stainless Steel Chemical Tanker Shipping Market Size, By Region, 2015–2022 (Million Ton)
Table 40 Stainless Steel Chemical Tankers Shipping Market Size, By Region, 2015–2022 (USD Billion)
Table 41 Coated Chemical Tanker Market Size, By Region, 2015–2022 (Million Ton)
Table 42 Coated Chemical Tankers Shipping Market Size, By Region, 2015–2022 (USD Billion)
Table 43 Chemical Tanker Shipping Market Size, By Region, 2015–2022 (Million Ton)
Table 44 Chemical Tankers Market Size, By Region, 2015–2022 (USD Billion)
Table 45 North America: Chemical Tanker Shipping Market Size, By Country, 2015–2022 (Million Ton)
Table 46 North America: Market Size, By Country, 2015–2022 (USD Billion)
Table 47 North America: Market Size, By Product Type, 2015–2022 (Million Ton)
Table 48 North America: Market Size, By Product Type, 2015–2022 (USD Billion)
Table 49 North America: Market Size, By Fleet Type, 2015–2022 (Million Ton)
Table 50 North America: Market Size, By Fleet Type, 2015–2022 (USD Billion)
Table 51 North America: Market Size, By Fleet Size, 2015–2022 (Million Ton)
Table 52 North America: Market Size, By Fleet Size, 2015–2022 (USD Billion)
Table 53 North America: Market Size, By Fleet Material, 2015–2022 (Million Ton)
Table 54 North America: Market Size, By Fleet Material, 2015–2022 (USD Billion)
Table 55 US: Chemical Tankers Shipping Market Size, By Product Type, 2015–2022 (Million Ton)
Table 56 US: Chemical Tankers Market Size, By Fleet Type, 2015–2022 (Million Ton)
Table 57 US: Chemical Tanker Market Size, By Fleet Size, 2015–2022 (Million Ton)
Table 58 US: Market Size, By Fleet Material, 2015–2022 (Million Ton)
Table 59 Canada: Chemical Tanker Shipping Market Size, By Product Type, 2015–2022 (Million Ton)
Table 60 Canada: Market Size, By Fleet Type, 2015–2022 (Million Ton)
Table 61 Canada: Market Size, By Fleet Size, 2015–2022 (Million Ton)
Table 62 Canada: Market Size, By Fleet Material, 2015–2022 (Million Ton)
Table 63 Mexico: Chemical Tanker Shipping Market Size, By Product Type, 2015–2022 (Million Ton)
Table 64 Mexico: Market Size, By Fleet Type, 2015–2022 (Million Ton)
Table 65 Mexico: Chemical Tanker Market Size, By Fleet Size, 2015–2022 (Million Ton)
Table 66 Mexico: Chemical Tankers Market Size, By Fleet Material, 2015–2022 (Million Ton)
Table 67 Europe: Chemical Tanker Shipping Market Size, By Country, 2015–2022 (Million Ton)
Table 68 Europe: Market Size, By Country, 2015–2022 (USD Billion)
Table 69 Europe: Market Size, By Product Type, 2015–2022 (Million Ton)
Table 70 Europe: Market Size, By Product Type, 2015–2022 (USD Billion)
Table 71 Europe: Market Size, By Fleet Type, 2015–2022 (Million Ton)
Table 72 Europe: Market Size, By Fleet Type, 2015–2022 (USD Billion)
Table 73 Europe: Market Size, By Fleet Size, 2015–2022 (Million Ton)
Table 74 Europe: Market Size, By Fleet Size, 2015–2022 (USD Billion)
Table 75 Europe: Market Size, By Fleet Material, 2015–2022 (Million Ton)
Table 76 Europe: Chemical Tankers Market Size, By Fleet Material, 2015–2022 (USD Billion)
Table 77 Germany: Chemical Tanker Shipping Market Size, By Product Type, 2015–2022 (Million Ton)
Table 78 Germany: Market Size, By Fleet Type, 2015–2022 (Million Ton)
Table 79 Germany: Market Size, By Fleet Size, 2015–2022 (Million Ton)
Table 80 Germany: Chemical Tankers Market Size, By Fleet Material, 2015–2022 (Million Ton)
Table 81 France: Chemical Tankers Shipping Market Size, By Product Type, 2015–2022 (Million Ton)
Table 82 France: Market Size, By Fleet Type, 2015–2022 (Million Ton)
Table 83 France: Market Size, By Fleet Size, 2015–2022 (Million Ton)
Table 84 France: Chemical Tankers Market Size, By Fleet Material, 2015–2022 (Million Ton)
Table 85 UK: Chemical Tanker Market Size, By Product Type, 2015–2022 (Million Ton)
Table 86 UK: Market Size, By Fleet Type, 2015–2022 (Million Ton)
Table 87 UK: Market Size, By Fleet Size, 2015–2022 (Million Ton)
Table 88 UK: Chemical Tankers Shipping Market Size, By Fleet Material, 2015–2022 (Million Ton)
Table 89 Netherlands: Chemical Tankers Market Size, By Product Type, 2015–2022 (Million Ton)
Table 90 Netherlands: Market Size, By Fleet Type, 2015–2022 (Million Ton)
Table 91 Netherlands: Market Size, By Fleet Size, 2015–2022 (Million Ton)
Table 92 Netherlands: Chemical Tanker Shipping Market Size, By Fleet Material, 2015–2022 (Million Ton)
Table 93 Russia: Chemical Tankers Shipping Market Size, By Product Type, 2015–2022 (Million Ton)
Table 94 Russia: Market Size, By Fleet Type, 2015–2022 (Million Ton)
Table 95 Russia: Market Size, By Fleet Size, 2015–2022 (Million Ton)
Table 96 Russia: Chemical Tanker Market Size, By Fleet Material, 2015–2022 (Million Ton)
Table 97 Rest of Europe: Chemical Tanker Shipping Market Size, By Product Type, 2015–2022 (Million Ton)
Table 98 Rest of Europe: Market Size, By Fleet Type, 2015–2022 (Million Ton)
Table 99 Rest of Europe: Market Size, By Fleet Size, 2015–2022 (Million Ton)
Table 100 Rest of Europe: Chemical Tankers Market Size, By Fleet Material, 2015–2022 (Million Ton)
Table 101 APAC: Chemical Tanker Shipping Market Size, By Country, 2015–2022 (Million Ton)
Table 102 APAC: Market Size, By Country, 2015–2022 (USD Billion)
Table 103 APAC: Chemical Tankers Market Size, By Product Type, 2015–2022 (Million Ton)
Table 104 APAC: Market Size, By Product Type, 2015–2022 (USD Billion)
Table 105 APAC: Chemical Tanker Market Size, By Fleet Type, 2015–2022 (Million Ton)
Table 106 APAC: Market Size, By Fleet Type, 2015–2022 (USD Billion)
Table 107 APAC: Chemical Tankers Shipping Market Size, By Fleet Size, 2015–2022 (Million Ton)
Table 108 APAC: Market Size, By Fleet Size, 2015–2022 (USD Billion)
Table 109 APAC: Chemical Tankers Market Size, By Fleet Material, 2015–2022 (Million Ton)
Table 110 APAC: Market Size, By Fleet Material, 2015–2022 (USD Billion)
Table 111 China: Chemical Tanker Shipping Market Size, By Product Type, 2015–2022 (Million Ton)
Table 112 China: Market Size, By Fleet Type, 2015–2022 (Million Ton)
Table 113 China: Market Size, By Fleet Size, 2015–2022 (Million Ton)
Table 114 China: Chemical Tankers Shipping Market Size, By Fleet Material, 2015–2022 (Million Ton)
Table 115 Japan: Chemical Tanker Market Size, By Product Type, 2015–2022 (Million Ton)
Table 116 Japan: Market Size, By Fleet Type, 2015–2022 (Million Ton)
Table 117 Japan: Chemical Tankers Market Size, By Fleet Size, 2015–2022 (Million Ton)
Table 118 Japan: Market Size, By Fleet Material, 2015–2022 (Million Ton)
Table 119 South Korea: Chemical Tanker Shipping Market Size, By Product Type, 2015–2022 (Million Ton)
Table 120 South Korea: Chemical Tankers Shipping Market Size, By Fleet Type, 2015–2022 (Million Ton)
Table 121 South Korea: Chemical Tanker Market Size, By Fleet Size, 2015–2022 (Million Ton)
Table 122 South Korea: Chemical Tankers Market Size, By Fleet Material, 2015–2022 (Million Ton)
Table 123 Singapore: Chemical Tanker Shipping Market Size, By Product Type, 2015–2022 (Million Ton)
Table 124 Singapore: Market Size, By Fleet Type, 2015–2022 (Million Ton)
Table 125 Singapore: Market Size, By Fleet Size, 2015–2022 (Million Ton)
Table 126 Singapore: Market Size, By Fleet Material, 2015–2022 (Million Ton)
Table 127 India: Chemical Tankers Shipping Market Size, By Product Type, 2015–2022 (Million Ton)
Table 128 India: Market Size, By Fleet Type, 2015–2022 (Million Ton)
Table 129 India: Market Size, By Fleet Size, 2015–2022 (Million Ton)
Table 130 India: Market Size, By Fleet Material, 2015–2022 (Million Ton)
Table 131 Rest of APAC: Chemical Tanker Market Size, By Product Type, 2015–2022 (Million Ton)
Table 132 Rest of APAC: Chemical Tankers Market Size, By Fleet Type, 2015–2022 (Million Ton)
Table 133 Rest of APAC: Chemical Tanker Shipping Market Size, By Fleet Size, 2015–2022 (Million Ton)
Table 134 Rest of APAC: Chemical Tankers Shipping Market Size, By Fleet Material, 2015–2022 (Million Ton)
Table 135 Middle East & Africa: Chemical Tanker Shipping Market Size, By Country, 2015–2022 (Million Ton)
Table 136 Middle East & Africa: Chemical Tankers Shipping Market Size, By Country, 2015–2022 (USD Billion)
Table 137 Middle East & Africa: Chemical Tanker Market Size, By Product Type, 2015–2022 (Million Ton)
Table 138 Middle East & Africa: Chemical Tankers Market Size, By Product Type, 2015–2022 (USD Billion)
Table 139 Middle East & Africa: Chemical Tanker Shipping Market Size, By Fleet Type, 2015–2022 (Million Ton)
Table 140 Middle East & Africa: Chemical Tankers Shipping Market Size, By Fleet Type, 2015–2022 (USD Billion)
Table 141 Middle East & Africa: Chemical Tanker Market Size, By Fleet Size, 2015–2022 (Million Ton)
Table 142 Middle East & Africa: Chemical Tankers Market Size, By Fleet Size, 2015–2022 (USD Billion)
Table 143 Middle East & Africa: Chemical Tanker Shipping Market Size, By Fleet Material, 2015–2022 (Million Ton)
Table 144 Middle East & Africa: Chemical Tankers Shipping Market Size, By Fleet Material, 2015–2022 (USD Billion)
Table 145 Saudi Arabia: Chemical Tanker Market Size, By Product Type, 2015–2022 (Million Ton)
Table 146 Saudi Arabia: Chemical Tankers Market Size, By Fleet Type, 2015–2022 (Million Ton)
Table 147 Saudi Arabia: Chemical Tanker Shipping Market Size, By Fleet Size, 2015–2022 (Million Ton)
Table 148 Saudi Arabia: Chemical Tankers Shipping Market Size, By Fleet Material, 2015–2022 (Million Ton)
Table 149 UAE: Chemical Tanker Market Size, By Product Type, 2015–2022 (Million Ton)
Table 150 UAE: Chemical Tankers Market Size, By Fleet Type, 2015–2022 (Million Ton)
Table 151 UAE: Chemical Tanker Shipping Market Size, By Fleet Size, 2015–2022 (Million Ton)
Table 152 UAE: Chemical Tankers Shipping Market Size, By Fleet Material, 2015–2022 (Million Ton)
Table 153 Rest of the Middle East & Africa: Chemical Tanker Market Size, By Product Type, 2015–2022 (Million Ton)
Table 154 Rest of the Middle East & Africa: Chemical Tankers Market Size, By Fleet Type, 2015–2022 (Million Ton)
Table 155 Rest of the Middle East & Africa: Chemical Tanker Shipping Market Size, By Fleet Size, 2015–2022 (Million Ton)
Table 156 Rest of the Middle East & Africa: Chemical Tankers Shipping Market Size, By Fleet Material, 2015–2022 (Million Ton)
Table 157 South America: Chemical Tanker Shipping Market Size, By Country, 2015–2022 (Million Ton)
Table 158 South America: Chemical Tankers Shipping Market Size, By Country, 2015–2022 (USD Billion)
Table 159 South America: Chemical Tanker Market Size, By Product Type, 2015–2022 (Million Ton)
Table 160 South America: Chemical Tankers Market Size, By Product Type, 2015–2022 (USD Billion)
Table 161 South America: Market Size, By Fleet Type, 2015–2022 (Million Ton)
Table 162 South America: Market Size, By Fleet Type, 2015–2022 (USD Billion)
Table 163 South America: Market Size, By Fleet Size, 2015–2022 (Million Ton)
Table 164 South America: Market Size, By Fleet Size, 2015–2022 (USD Billion)
Table 165 South America: Market Size, By Fleet Material, 2015–2022 (Million Ton)
Table 166 South America: Market Size, By Fleet Material, 2015–2022 (USD Billion)
Table 167 Brazil: Chemical Tanker Shipping Market Size, By Product Type, 2015–2022 (Million Ton)
Table 168 Brazil: Chemical Tankers Shipping Market Size, By Fleet Type, 2015–2022 (Million Ton)
Table 169 Brazil: Chemical Tanker Market Size, By Fleet Size, 2015–2022 (Million Ton)
Table 170 Brazil: Chemical Tankers Market Size, By Fleet Material, 2015–2022 (Million Ton)
Table 171 Argentina: Chemical Tanker Shipping Market Size, By Product Type, 2015–2022 (Million Ton)
Table 172 Argentina: Chemical Tankers Shipping Market Size, By Fleet Type, 2015–2022 (Million Ton)
Table 173 Argentina: Chemical Tanker Market Size, By Fleet Size, 2015–2022 (Million Ton)
Table 174 Argentina: Chemical Tankers Market Size, By Fleet Material, 2015–2022 (Million Ton)
Table 175 Rest of South America: Chemical Tanker Shipping Market Size, By Product Type, 2015–2022 (Million Ton)
Table 176 Rest of South America: Chemical Tankers Market Size, By Fleet Type, 2015–2022 (Million Ton)
Table 177 South America: Chemical Tanker Shipping Market Size, By Fleet Size, 2015–2022 (Million Ton)
Table 178 Rest of South America: Chemical Tankers Shipping Market Size, By Fleet Material, 2015–2022 (Million Ton)
Table 179 Expansions, 2014—2017
Table 180 Joint Ventures, 2014—2017
Table 181 Acquisitions, 2014—2017
List of Figures (55 Figures)
Figure 1 Chemical Tankers Shipping Market: Research Design
Figure 2 Market Size Estimation: Bottom-Up Approach
Figure 3 Market Size Estimation: Top-Down Approach
Figure 4 Chemical Tanker Shipping Market: Data Triangulation
Figure 5 Vegetable Oils & Fats to Lead the Chemical Tankers SMarket Between 2017 and 2022
Figure 6 IMO 2 Type Chemical Tanker to Dominate the Chemical Tanker Shipping Market Between 2017 and 2022
Figure 7 Fleet Size 10,000–19,999 DWT to Lead the Chemical Tankers Shipping Market Between 2017 and 2022
Figure 8 Fleet Material By Coated Type to Dominate the Chemical Tanker Market Between 2017 and 2022
Figure 9 APAC to Witness Significant Growth in the Market During the Forecast Period
Figure 10 Chemical Tankers Shipping Market Size, 2017 vs 2022 (Million Ton)
Figure 11 Organic Chemicals is the Largest Product Type in the APAC Market
Figure 12 IMO 2 Type to Lead the Chemical Tanker Shipping Market By 2022
Figure 13 10,000–19,999 DWT Chemical Tanker to Lead the Market
Figure 14 Coated Type of Chemical Tanker to Dominate the Market
Figure 15 Factors Governing the Chemical Tankers Market
Figure 16 China Accounted for the Largest Market Share in Chemical Sales, 2016
Figure 17 Palm Oil Led the Global Vegetable Oil Production in 2015 (Kiloton and Percentage)
Figure 18 India Accounted for the Largest Palm Oil Consumption in 2015 (Million Ton and Percentage)
Figure 19 Organic Chemicals Accounted for the Largest Share of the Chemical Tanker Market in 2016
Figure 20 The Middle East & Africa to Be the Fastest-Growing Chemical Tankers Shipping Market for Organic Chemicals Between 2017 and 2022
Figure 21 APAC to Be the Largest Chemical Tanker Shipping Market for Inorganic Chemicals Between 2017 and 2022
Figure 22 APAC to Be the Fastest-Growing Chemical Tankers Market for Vegetable Oils & Fats Between 2017 and 2022
Figure 23 APAC to Be the Largest Chemical Tanker Shipping Market for Other Products Between 2017 and 2022
Figure 24 IMO Type 2 Tanker Accounted for the Largest Market Share in 2016
Figure 25 Middle East & Africa to Be the Fastest-Growing IMO Type 1 Market Between 2017 and 2022
Figure 26 APAC to Be the Largest IMO Type 2 Market By 2022
Figure 27 Middle East & Africa to Be the Second-Largest IMO Type 3 Market Between 2017 and 2022
Figure 28 10,000–19,000 DWT Fleet Size Accounted for the Largest Market Share in 2016
Figure 29 APAC to Be the Largest Chemical Tankers Shipping Market By Fleet Size 1,000–4,999 DWT Between 2017 and 2022
Figure 30 Middle East & Africa to Be the Second-Fastest Growing Chemical Tanker Market, By Fleet Size, 5,000–9,999 DWT
Figure 31 North America to Be the Third-Largest Chemical Tankers Shipping Market, By Fleet Size, 10,000–50,000 DWT
Figure 32 Europe to Be the Fourth-Largest Chemical Tanker Shipping Market By Fleet Size, 20,000-29,999 DWT
Figure 33 APAC to Be the Largest Chemical Tankers Market By Fleet Size, 30,000-39,999 DWT
Figure 34 APAC to Register Highest CAGR of Chemical Tankers Shipping Market By Fleet Size, 40,000-49,999 DWT
Figure 35 APAC to Be the Largest Chemical Tanker Shipping Market, By Fleet Size 50,000+ DWT
Figure 36 Coated Type Fleet Material Dominated the Chemical Tankers Shipping Market in 2016
Figure 37 Middle East & Africa to Be the Fastest-Growing Chemical Tanker Market of Stainless Steel Type
Figure 38 Middle East & Africa to Be the Second Fastest-Growing Chemical Tankers Shipping Market for Coated Type of Fleet Material Between 2017 and 2022
Figure 39 China to Be the Fastest-Growing Chemical Tanker Shipping Market Between 2017 and 2022
Figure 40 Organic Chemicals Led the Chemical Shipping Market in Germany in 2016
Figure 41 APAC Chemical Tanker Shipping Market Snapshot
Figure 42 Middle East & Africa Chemical Tankers Shipping Market Snapshot
Figure 43 Key Developments By Leading Players in Market Between 2014 and 2017
Figure 44 Bahri: Company Snapshot
Figure 45 Bahri: SWOT Analysis
Figure 46 Stolt-Nielsen: Company Snapshot
Figure 47 Stolt-Nielsen: SWOT Analysis
Figure 48 Odfjell: Company Snapshot
Figure 49 Odfjell: SWOT Analysis
Figure 50 Navig8 Group: SWOT Analysis
Figure 51 Mol Chemical Tankers Pte. Ltd.: SWOT Analysis
Figure 52 Wilmar International Ltd.: Company Snapshot
Figure 53 Misc Berhad: Company Snapshot
Figure 54 Team Tankers International Ltd.: Company Snapshot
Figure 55 Iino Kaiun Kaisha, Ltd.: Company Snapshot


Growth opportunities and latent adjacency in Chemical Tankers Market