TABLE OF CONTENTS
1 INTRODUCTION
1.1 KEY TAKE-AWAYS
1.2 REPORT DESCRIPTION
1.3 MARKETS COVERED
1.4 STAKEHOLDERS
1.5 RESEARCH METHODOLOGY
1.5.1 MARKET SIZE
1.5.2 KEY DATA POINTS TAKEN FROM SECONDARY SOURCES
1.5.3 KEY DATA POINTS TAKEN FROM PRIMARY SOURCES
1.5.4 ASSUMPTIONS MADE FOR THIS REPORT
1.5.5 KEY QUESTIONS ANSWERED
2 EXECUTIVE SUMMARY
3 MARKET OVERVIEW
3.1 INTRODUCTION
3.2 VEGETABLE OIL INDUSTRY STRUCTURE
3.2.1 VALUE CHAIN ANALYSIS
3.2.2 TRADE: IMPORTS & EXPORTS OF VEGETABLE OIL
3.2.3 PRICING TRENDS OF VEGETABLE OIL
3.2.4 GLOBAL PRODUCTION OF BIODIESEL
3.3 MARKET DYNAMICS
3.3.1 DRIVERS
3.3.1.1 Food sector - A constant boost for the vegetable oil demand
3.3.1.2 Growing consumption in Asian subcontinent markets
3.3.1.3 Biofuel policies & biodiesel requirements
3.3.2 RESTRAINTS
3.3.2.1 New label requirements & trans-fat levels hindering the growth
3.3.2.2 High price volatility & resulting lack in working capital
3.3.3 OPPORTUNITY
3.3.3.1 Palm & palm kernel oil - as a substitute for trans-fat oil
3.3.4 IMPACT ANALYSIS – DRIVERS, RESTRAINTS & OPPORTUNITY
3.4 BURNING ISSUE
3.4.1 ECOLOGICAL IMPACT OF PALM OIL PLANTATIONS
3.5 PATENT ANALYSIS
4 GLOBAL VEGETABLE OIL MARKET, BY TYPE
4.1 INTRODUCTION
4.2 PALM OIL
4.3 PALM KERNEL OIL
4.4 SOYBEAN OIL
4.5 RAPESEED (CANOLA) OIL
4.6 SUNFLOWER OIL
4.7 MINOR VEGETABLE OIL
5 GLOBAL VEGETABLE OIL MARKET, BY APPLICATION
5.1 INTRODUCTION
5.2 FOOD
5.3 INDUSTRIAL
5.4 BIODIESEL
6 GLOBAL VEGETABLE OIL MARKET, BY EXTRACTION METHOD
6.1 INTRODUCTION
6.2 MECHANICAL EXTRACTION
6.3 SOLVENT EXTRACTION
6.4 HYDROGENATION
6.5 SPARGING
7 VEGETABLE OIL MARKET, BY GEOGRAPHY
7.1 INTRODUCTION
7.2 ASIA-PACIFIC
7.2.1 INDIA
7.2.2 CHINA
7.2.3 INDONESIA & MALAYSIA
7.3 NORTH AMERICA
7.3.1 U.S.
7.3.2 CANADA
7.4 EUROPE
7.4.1 GERMANY
7.4.2 U.K.
7.4.3 FRANCE
7.5 REST OF THE WORLD
7.5.1 BRAZIL
8 COMPETITIVE LANDSCAPE
8.1 INTRODUCTION
8.2 MERGERS & ACQUISITIONS
8.3 NEW PRODUCTS LAUNCH
8.4 AGREEMENTS/PARTNERSHIPS/COLLABORATIONS/JOINT VENTURES
8.5 INVESTMENTS & EXPANSIONS
8.6 OTHER INDUSTRY ACTIVITY
9 COMPANY PROFILES
9.1 ACH FOOD COMPANIES INC.
9.1.1 OVERVIEW
9.1.2 PRODUCTS & SERVICES
9.1.3 FINANCIALS
9.1.4 STRATEGY
9.1.5 DEVELOPMENTS
9.2 ARCHER DANIELS MIDLAND COMPANY
9.2.1 OVERVIEW
9.2.2 PRODUCTS & SERVICES
9.2.3 FINANCIALS
9.2.4 STRATEGY
9.2.5 DEVELOPMENTS
9.3 BEIDAHUANG GROUP
9.3.1 OVERVIEW
9.3.2 PRODUCTS & SERVICES
9.3.3 FINANCIALS
9.3.4 STRATEGY
9.3.5 DEVELOPMENTS
9.4 BUNGE ALIMENTOS SA (BRAZIL)
9.4.1 OVERVIEW
9.4.2 PRODUCTS & SERVICES
9.4.3 FINANCIALS
9.4.4 STRATEGY
9.4.5 DEVELOPMENTS
9.5 BUNGE NORTH AMERICA INC.
9.5.1 OVERVIEW
9.5.2 PRODUCTS & SERVICES
9.5.3 FINANCIALS
9.5.4 STRATEGY
9.5.5 DEVELOPMENTS
9.6 CARAPELLI FIRENZE S.P.A (ITALY)
9.6.1 OVERVIEW
9.6.2 PRODUCTS & SERVICES
9.6.3 FINANCIALS
9.6.4 STRATEGY
9.7 CARGILL AGRICOLA S.A.
9.7.1 OVERVIEW
9.7.2 PRODUCTS & SERVICES
9.7.3 FINANCIALS
9.7.4 STRATEGY
9.7.5 DEVELOPMENTS
9.8 CARGILL INVESTMENT (CHINA) CO. LTD
9.8.1 OVERVIEW
9.8.2 PRODUCTS & SERVICES
9.8.3 FINANCIALS
9.8.4 STRATEGY
9.8.5 DEVELOPMENTS
9.9 CHINATEX CORPORATION
9.9.1 OVERVIEW
9.9.2 PRODUCTS & SERVICES
9.9.3 FINANCIALS
9.9.4 STRATEGY
9.9.5 DEVELOPMENTS
9.10 CHS INC.
9.10.1 OVERVIEW
9.10.2 PRODUCTS
9.10.3 FINANCIALS
9.10.4 STRATEGY
9.10.5 DEVELOPMENTS
9.11 CONAGRA FOODS INC.
9.11.1 OVERVIEW
9.11.2 PRODUCTS & SERVICES
9.11.3 FINANCIALS
9.11.4 STRATEGY
9.11.5 DEVELOPMENTS
9.12 FUJI OIL
9.12.1 OVERVIEW
9.12.2 PRODUCTS & SERVICES
9.12.3 FINANCIALS
9.12.4 STRATEGY
9.12.5 DEVELOPMENTS
9.13 IOI CORPORATION BERHAD
9.13.1 OVERVIEW
9.13.2 PRODUCTS & SERVICES
9.13.3 FINANCIALS
9.13.4 STRATEGY
9.13.5 DEVELOPMENTS
9.14 J-OIL MILLS INC.
9.14.1 OVERVIEW
9.14.2 PRODUCTS & SERVICES
9.14.3 FINANCIALS
9.14.4 STRATEGY
9.14.5 DEVELOPMENTS
9.15 KUALA LUMPUR KEPONG BERHAD
9.15.1 OVERVIEW
9.15.2 PRODUCTS & SERVICES
9.15.3 FINANCIALS
9.15.4 STRATEGY
9.15.5 DEVELOPMENTS
9.16 PT INTIBOGA SEJHATERA
9.16.1 OVERVIEW
9.16.2 PRODUCTS & SERVICES
9.16.3 FINANCIAL
9.16.4 STRATEGY
9.16.5 DEVELOPMENTS
9.17 RICHARDSON OILSEED LTD (CANADA)
9.17.1 OVERVIEW
9.17.2 PRODUCTS & SERVICES
9.17.3 FINANCIALS
9.17.4 STRATEGY
9.17.5 DEVELOPMENTS
9.18 SAVOLA GROUP
9.18.1 OVERVIEW
9.18.2 PRODUCTS & SERVICES
9.18.3 FINANCIALS
9.18.4 STRATEGY
9.18.5 DEVELOPMENTS
9.19 THE DOW AGROSCIENCES LLC
9.19.1 OVERVIEW
9.19.2 PRODUCTS & SERVICES
9.19.3 FINANCIALS
9.19.4 STRATEGY
9.19.5 DEVELOPMENTS
9.20 UNITED PLANTATIONS BERHAD
9.20.1 OVERVIEW
9.20.2 PRODUCTS & SERVICES
9.20.3 FINANCIAL
9.20.4 STRATEGY
9.20.5 DEVELOPMENTS
9.21 WILMAR INTERNATIONAL LTD
9.21.1 OVERVIEW
9.21.2 PRODUCTS & SERVICES
9.21.3 FINANCIALS
9.21.4 STRATEGY
9.21.5 DEVELOPMENTS
9.22 YIHAI KERRY INVESTMENT CO. LTD
9.22.1 OVERVIEW
9.22.2 PRODUCTS & SERVICES
9.22.3 FINANCIALS
9.22.4 STRATEGY
9.22.5 DEVELOPMENTS
APPENDIX
U.S. PATENTS
EUROPE PATENTS
JAPAN PATENTS
LIST OF TABLES
TABLE 1 GLOBAL VEGETABLE OIL MARKET REVENUE ($MILLION) & VOLUME (’000 METRIC TONS), 2010 – 2017
TABLE 2 BIODIESEL PRODUCTION CAPACITY RANKING, 2010 (MILLION GALLONS)
TABLE 3 FEEDSTOCK YIELD EFFICIENCY FOR BIODIESELS
TABLE 4 VEGETABLE OIL PATENTS, BY GEOGRAPHY, 2007 – 2012
TABLE 5 GLOBAL VEGETABLE OIL MARKET REVENUE, BY TYPE, 2010 – 2017 ($MILLION)
TABLE 6 GLOBAL VEGETABLE OIL MARKET VOLUME, BY TYPE, 2010 – 2017 (’000 METRIC TONS)
TABLE 7 GLOBAL PALM OIL MARKET REVENUE, BY APPLICATION, 2010 – 2017 ($MILLION)
TABLE 8 GLOBAL PALM OIL MARKET VOLUME, BY APPLICATION, 2010 – 2017 (’000 METRIC TONS)
TABLE 9 PALM OIL MARKET REVENUE, BY GEOGRAPHY, 2010 – 2017 ($MILLION)
TABLE 10 PALM OIL MARKET VOLUME, BY GEOGRAPHY, 2010 – 2017 (’000 METRIC TONS)
TABLE 11 GLOBAL PALM KERNEL OIL MARKET REVENUE, BY APPLICATION, 2010 – 2017 ($MILLION)
TABLE 12 GLOBAL PALM KERNEL OIL MARKET VOLUME, BY APPLICATION, 2010 – 2017 (’000 METRIC TONS)
TABLE 13 PALM KERNEL OIL MARKET REVENUE, BY GEOGRAPHY, 2010 – 2017 ($MILLION)
TABLE 14 PALM KERNEL OIL MARKET VOLUME, BY GEOGRAPHY, 2010 – 2017 (’000 METRIC TONS)
TABLE 15 GLOBAL SOYBEAN OIL MARKET REVENUE, BY APPLICATION, 2010 – 2017 ($MILLION)
TABLE 16 GLOBAL SOYBEAN OIL MARKET VOLUME, BY APPLICATION, 2010 – 2017 (’000 METRIC TONS)
TABLE 17 SOYBEAN OIL MARKET REVENUE, BY GEOGRAPHY, 2010 – 2017 ($MILLION)
TABLE 18 SOYBEAN OIL MARKET VOLUME, BY GEOGRAPHY, 2010 – 2017 (’000 METRIC TONS)
TABLE 19 GLOBAL RAPESEED OIL MARKET REVENUE, BY APPLICATION, 2010 – 2017 ($MILLION)
TABLE 20 GLOBAL RAPESEED OIL MARKET VOLUME, BY APPLICATION, 2010 – 2017 (’000 METRIC TONS)
TABLE 21 RAPESEED OIL MARKET REVENUE, BY GEOGRAPHY, 2010 – 2017 ($MILLION)
TABLE 22 RAPESEED OIL MARKET VOLUME, BY GEOGRAPHY, 2010 – 2017 (’000 METRIC TONS)
TABLE 23 GLOBAL SUNFLOWER OIL MARKET REVENUE, BY APPLICATION, 2010 – 2017 ($MILLION)
TABLE 24 GLOBAL SUNFLOWER OIL MARKET VOLUME, BY APPLICATION, 2010 – 2017 (’000 METRIC TONS)
TABLE 25 SUNFLOWER OIL MARKET REVENUE, BY GEOGRAPHY, 2010 – 2017 ($MILLION)
TABLE 26 SUNFLOWER OIL MARKET VOLUME, BY GEOGRAPHY, 2010 – 2017 (’000 METRIC TONS)
TABLE 27 GLOBAL MINOR VEGETABLE OIL MARKET REVENUE, BY APPLICATION, 2010 – 2017 ($MILLION)
TABLE 28 GLOBAL MINOR VEGETABLE OIL MARKET VOLUME, BY APPLICATION, 2010 – 2017 (’000 METRIC TONS)
TABLE 29 MINOR VEGETABLE OIL MARKET REVENUE, BY GEOGRAPHY, 2010 – 2017 ($MILLION)
TABLE 30 MINOR VEGETABLE OIL MARKET VOLUME, BY GEOGRAPHY, 2010 – 2017 (’000 METRIC TONS)
TABLE 31 GLOBAL VEGETABLE OIL MARKET REVENUE, BY APPLICATION, 2010 – 2017 ($MILLION)
TABLE 32 GLOBAL VEGETABLE OIL MARKET VOLUME, BY APPLICATION, 2010 – 2017 (’000 METRIC TONS)
TABLE 33 VEGETABLE OIL MARKET REVENUE FOR FOOD APPLICATION, BY GEOGRAPHY, 2010 – 2017 ($MILLION)
TABLE 34 VEGETABLE OIL MARKET VOLUME FOR FOOD APPLICATION, BY GEOGRAPHY, 2010 – 2017 (’000 METRIC TONS)
TABLE 35 GLOBAL VEGETABLE OIL MARKET REVENUE FOR FOOD APPLICATION, BY TYPE, 2010 – 2017 ($MILLION)
TABLE 36 GLOBAL VEGETABLE OIL MARKET VOLUME FOR FOOD APPLICATION, BY TYPE, 2010 – 2017 (’000 METRIC TONS)
TABLE 37 VEGETABLE OIL MARKET REVENUE FOR INDUSTRIAL APPLICATION, BY GEOGRAPHY, 2010 – 2017 ($MILLION)
TABLE 38 VEGETABLE OIL MARKET VOLUME FOR INDUSTRIAL APPLICATION, BY GEOGRAPHY, 2010 – 2017 (’000 METRIC TONS)
TABLE 39 GLOBAL VEGETABLE OIL MARKET REVENUE FOR INDUSTRIAL APPLICATION, BY TYPE, 2010 – 2017 ($MILLION)
TABLE 40 GLOBAL VEGETABLE OIL MARKET VOLUME FOR INDUSTRIAL APPLICATION, BY TYPE, 2010 – 2017 (’000 METRIC TONS)
TABLE 41 VEGETABLE OIL MARKET REVENUE FOR BIODIESEL APPLICATION, BY GEOGRAPHY, 2010 – 2017 ($MILLION)
TABLE 42 VEGETABLE OIL MARKET VOLUME FOR BIODIESEL APPLICATION, BY GEOGRAPHY, 2010 – 2017 (’000 METRIC TONS)
TABLE 43 VEGETABLE OIL MARKET REVENUE, BY GEOGRAPHY, 2010 – 2017 ($MILLION)
TABLE 44 VEGETABLE OIL MARKET VOLUME, BY GEOGRAPHY, 2010 – 2017 (’000 METRIC TONS)
TABLE 45 ASIA-PACIFIC: VEGETABLE OIL MARKET REVENUE, BY COUNTRY, 2010 – 2017 ($MILLION)
TABLE 46 ASIA-PACIFIC: VEGETABLE OIL MARKET VOLUME, BY COUNTRY, 2010 – 2017 (’000 METRIC TONS)
TABLE 47 ASIA-PACIFIC: VEGETABLE OIL MARKET REVENUE, BY APPLICATION, 2010 – 2017 ($MILLION)
TABLE 48 ASIA-PACIFIC: VEGETABLE OIL MARKET VOLUME, BY APPLICATION, 2010 – 2017 (’000 METRIC TONS)
TABLE 49 ASIA-PACIFIC: VEGETABLE OIL MARKET REVENUE, BY TYPE, 2010 – 2017 ($MILLION)
TABLE 50 ASIA-PACIFIC: VEGETABLE OIL MARKET VOLUME, BY TYPE, 2010 – 2017 (’000 METRIC TONS)
TABLE 51 INDIA: MARKET REVENUE, BY TYPE, 2010 – 2017 ($MILLION)
TABLE 52 INDIA: MARKET VOLUME, BY TYPE, 2010 – 2017 (’000 METRIC TONS)
TABLE 53 INDIA: MARKET REVENUE, BY APPLICATION, 2010 – 2017 ($MILLION)
TABLE 54 INDIA: MARKET VOLUME, BY APPLICATION, 2010 – 2017 (’000 METRIC TONS)
TABLE 55 CHINA: MARKET REVENUE, BY TYPE, 2010 – 2017 ($MILLION)
TABLE 56 CHINA: MARKET VOLUME, BY TYPE, 2010 – 2017 (’000 METRIC TONS)
TABLE 57 CHINA: MARKET REVENUE, BY APPLICATION, 2010 – 2017 ($MILLION)
TABLE 58 CHINA: MARKET VOLUME, BY APPLICATION, 2010 – 2017 (’000 METRIC TONS)
TABLE 59 INDONESIA & MALAYSIA: MARKET REVENUE, BY TYPE, 2010 – 2017 ($MILLION)
TABLE 60 INDONESIA & MALAYSIA: MARKET VOLUME, BY TYPE, 2010 – 2017 (’000 METRIC TONS)
TABLE 61 NORTH AMERICA: MARKET REVENUE, BY COUNTRY, 2010 – 2017 ($MILLION)
TABLE 62 NORTH AMERICA: MARKET VOLUME, BY COUNTRY, 2010 – 2017 (’000 METRIC TONS)
TABLE 63 NORTH AMERICA: MARKET REVENUE, BY APPLICATION, 2010 – 2017 ($MILLION)
TABLE 64 NORTH AMERICA: MARKET VOLUME, BY APPLICATION, 2010 – 2017 (’000 METRIC TONS)
TABLE 65 NORTH AMERICA: MARKET REVENUE, BY TYPE, 2010 – 2017 ($MILLION)
TABLE 66 NORTH AMERICA: MARKET VOLUME, BY TYPE, 2010 – 2017 (’000 METRIC TONS)
TABLE 67 U.S: MARKET REVENUE, BY TYPE, 2010 – 2017 ($MILLION)
TABLE 68 U.S: MARKET VOLUME, BY TYPE, 2010 – 2017 (’000 METRIC TONS)
TABLE 69 U.S: MARKET REVENUE, BY APPLICATION, 2010 – 2017 ($MILLION)
TABLE 70 U.S: MARKET VOLUME, BY TYPE, 2010 – 2017 (’000 METRIC TONS)
TABLE 71 CANADA: MARKET REVENUE, BY TYPE, 2010 – 2017 ($MILLION)
TABLE 72 CANADA: MARKET REVENUE, BY TYPE, 2010 – 2017 (’000 METRIC TONS)
TABLE 73 CANADA: MARKET REVENUE, BY APPLICATION, 2010 – 2017 ($MILLION)
TABLE 74 CANADA: MARKET REVENUE, BY APPLICATION, 2010 – 2017 (’000 METRIC TONS)
TABLE 75 EUROPE: MARKET REVENUE, BY COUNTRY, 2010 – 2017 ($MILLION)
TABLE 76 EUROPE: MARKET VOLUME, BY COUNTRY, 2010 – 2017 (’000 METRIC TONS)
TABLE 77 EUROPE: MARKET REVENUE, BY APPLICATION, 2010 – 2017 ($MILLION)
TABLE 78 EUROPE: MARKET VOLUME, BY APPLICATION, 2010 – 2017 (’000 METRIC TONS)
TABLE 79 EUROPE: MARKET REVENUE, BY TYPE, 2010 – 2017 ($MILLION)
TABLE 80 EUROPE: MARKET VOLUME, BY TYPE, 2010 – 2017 (’000 METRIC TONS)
TABLE 81 GERMANY: MARKET REVENUE, BY TYPE, 2010 – 2017 ($MILLION)
TABLE 82 GERMANY: MARKET REVENUE, BY TYPE, 2010 – 2017 (’000 METRIC TONS)
TABLE 83 GERMANY: MARKET REVENUE, BY APPLICATION, 2010 – 2017 ($MILLION)
TABLE 84 GERMANY: MARKET REVENUE, BY APPLICATION, 2010 – 2017 (’000 METRIC TONS)
TABLE 85 U.K: MARKET REVENUE, BY TYPE, 2010 – 2017 ($MILLION)
TABLE 86 U.K: MARKET REVENUE, BY TYPE, 2010 – 2017 (’000 METRIC TONS)
TABLE 87 U.K: MARKET REVENUE, BY APPLICATION, 2010 – 2017 ($MILLION)
TABLE 88 U.K: MARKET REVENUE, BY APPLICATION, 2010 – 2017 (’000 METRIC TONS)
TABLE 89 FRANCE: MARKET REVENUE, BY TYPE, 2010 – 2017 ($MILLION)
TABLE 90 FRANCE: MARKET REVENUE, BY TYPE, 2010 – 2017 (’000 METRIC TONS)
TABLE 91 FRANCE: MARKET REVENUE, BY APPLICATION, 2010 – 2017 ($MILLION)
TABLE 92 FRANCE: MARKET REVENUE, BY APPLICATION, 2010 – 2017 (’000 METRIC TONS)
TABLE 93 ROW: MARKET REVENUE, BY COUNTRY, 2010 – 2017 ($MILLION)
TABLE 94 ROW: MARKET VOLUME, BY COUNTRY, 2010 – 2017 (’000 METRIC TONS)
TABLE 95 ROW: MARKET REVENUE, BY APPLICATION, 2010 – 2017 ($MILLION)
TABLE 96 ROW: MARKET VOLUME, BY APPLICATION, 2010 – 2017 (’000 METRIC TONS)
TABLE 97 ROW: MARKET REVENUE, BY TYPE, 2010 – 2017 ($MILLION)
TABLE 98 ROW: MARKET VOLUME, BY TYPE, 2010 – 2017 (’000 METRIC TONS)
TABLE 99 BRAZIL: MARKET REVENUE, BY TYPE, 2010 – 2017 ($MILLION)
TABLE 100 BRAZIL: MARKET REVENUE, BY TYPE, 2010 – 2017 (’000 METRIC TONS)
TABLE 101 BRAZIL: MARKET REVENUE, BY APPLICATION, 2010 – 2017 ($MILLION)
TABLE 102 BRAZIL: MARKET REVENUE, BY APPLICATION, 2010 – 2017 (’000 METRIC TONS)
TABLE 103 MERGERS & ACQUISITIONS, 2008 – 2012
TABLE 104 NEW PRODUCTS LAUNCH, 2009 – 2012
TABLE 105 AGREEMENTS/PARTNERSHIPS/COLLABORATIONS/ JOINT VENTURES, 2008 – 2012
TABLE 106 INVESTMENTS & EXPANSIONS, 2008 – 2012
TABLE 107 OTHER INDUSTRY ACTIVITY, 2010 – 2012
TABLE 108 ACH FOOD: PRODUCTS & ITS APPLICATION
TABLE 109 ADM: PRODUCTS & ITS APPLICATION
TABLE 110 BUNGE ALIMENTOS: PRODUCTS & ITS BENEFITS
TABLE 111 BUNGE NORTH: PRODUCTS & ITS PACKAGING
TABLE 112 CARAPELLI: PRODUCTS, ITS FEATURES & APPLICATIONS
TABLE 113 CARGILL AGRICOLA: PRODUCTS, ITS BENEFITS & APPLICATIONS
TABLE 114 CARGILL INVESTMENT: PRODUCTS & ITS APPLICATION/PACK SIZES
TABLE 115 CHS: PRODUCTS & ITS APPLICATION
TABLE 116 CONAGRA FOODS: PRODUCTS & ITS BENEFITS/APPLICATION
TABLE 117 FUJI OIL: PRODUCTS & ITS BENEFITS/APPLICATION
TABLE 118 J-OIL MILLS: PRODUCTS & ITS PACKAGE SIZE
TABLE 119 KUALA LUMPUR: PRODUCTS & ITS APPLICATION
TABLE 120 PT INTIBOGA: PRODUCTS & ITS APPLICATION
TABLE 121 RICHARDSON: PRODUCTS & ITS BENEFITS/APPLICATION
TABLE 122 SAVOLA: PRODUCTS & ITS PACK SIZE
TABLE 123 DOW: PRODUCTS & ITS BENEFIT/APPLICATION
TABLE 124 UNITED PLANTATIONS: PRODUCTS & ITS PACKAGE SIZE/ APPLICATION
TABLE 125 WILMAR INTERNATIONAL: PRODUCTS & ITS ORIGINATION
TABLE 126 YIHAI KERRY: PRODUCTS & ITS ORIGINATION
LIST OF FIGURES
FIGURE 1 GLOBAL VEGETABLE OIL MARKET SEGMENTATION
FIGURE 2 GLOBAL VEGETABLE OIL REVENUE ($MILLION) & VOLUME (’000 METRIC TONS), 2010 – 2017
FIGURE 3 GLOBAL VEGETABLE OIL MARKET SHARE, BY APPLICATION, 2011
FIGURE 4 GLOBAL MARKET REVENUE RANKING, BY SEGMENT
FIGURE 5 GENERIC SUPPLY CHAIN IN VEGETABLE OIL MARKET
FIGURE 6 PLAYERS IN SUSTAINABLE PALM OIL SUPPLY CHAIN
FIGURE 7 MAJOR VEGETABLE OIL: WORLD IMPORTS, BY TYPE, 2009 – 2012
FIGURE 8 MAJOR VEGETABLE OIL: WORLD EXPORTS, BY TYPE, 2009 – 2012
FIGURE 9 MAJOR VEGETABLE OIL: WORLD IMPORTS, BY COUNTRY, 2009 – 2012
FIGURE 10 MAJOR VEGETABLE OIL: WORLD EXPORTS, BY COUNTRY, 2009 – 2012
FIGURE 11 PRICING TRENDS OF VEGETABLE OIL, BY TYPE, 2009 – 2017
FIGURE 12 BIODIESEL MARKET GROWTH, BY GEOGRAPHY, 2010 – 2020
FIGURE 13 TREND & PROJECTIONS: WORLD POPULATION (MILLION) & VEGETABLE OIL CONSUMPTION (KG/PERSON/YEAR), 1990 – 2030
FIGURE 14 GLOBAL & ASIAN REGION: VEGETABLE OIL CONSUMPTION PER CAPITA, 1990 – 2030
FIGURE 15 SHARE OF VEGETABLE OIL CONSUMPTION USED FOR BIODIESEL PRODUCTION, BY COUNTRY, 2010 – 2020
FIGURE 16 IMPACT ANALYSIS OF DRIVERS & RESTRAINTS ON GLOBAL VEGETABLE OIL MARKET, 2012 – 2017
FIGURE 17 IMPACT ANALYSIS OF OPPORTUNITY ON GLOBAL VEGETABLE OIL MARKET, 2012 – 2017
FIGURE 18 INDONESIAN LAND AREA UNDER PALM OIL PLANTATIONS, BY TYPE OF FARMER, 1997 – 2007
FIGURE 19 INDONESIA & MALAYSIA: THREATENED TERRESTRIAL VERTEBRATE SPECIES, 2007
FIGURE 20 INDONESIA & MALAYSIA: RAINFOREST LOSS DUE TO PALM OIL PLANTATIONS, 2007
FIGURE 21 GLOBAL VEGETABLE OIL FOOD APPLICATION MARKET SHARE, BY SECTOR, 2011
FIGURE 22 CONVERSION PROCESS FOR BIODIESEL FROM VEGETABLE OIL
FIGURE 23 GLOBAL VEGETABLE OIL MARKET SHARE, BY EXTRACTION METHOD, 2011
FIGURE 24 SIMPLIFIED VEGETABLE OIL MECHANICAL EXTRACTION WITH SOLVENT TREATMENT
FIGURE 25 SIMPLIFIED SOLVENT EXTRACTION PROCESS FOR VEGETABLE OIL
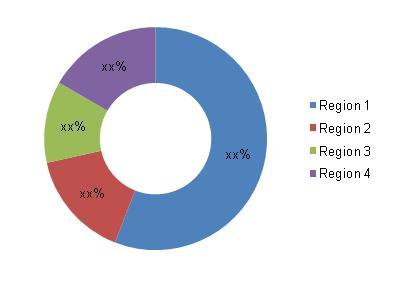
FIGURE 26 VEGETABLE OIL MARKET SHARE, BY GEOGRAPHY, 2011
FIGURE 27 GLOBAL VEGETABLE OIL MARKET SHARE, BY GROWTH STRATEGY, 2008 – 2012
FIGURE 28 MERGERS & ACQUISITIONS, 2008 – 2012
FIGURE 29 NEW PRODUCTS LAUNCH, 2009 – 2012
FIGURE 30 AGREEMENTS/PARTNERSHIPS/COLLABORATIONS/JOINT VENTURES, 2008 – 2012
FIGURE 31 INVESTMENTS & EXPANSIONS, 2008 – 2012


Growth opportunities and latent adjacency in Global Vegetable Oil Market